Bitcoin - Sell this upcoming pump! New Bear Flag - Target 74k!I am currently bullish on Bitcoin in the short term, and I believe Bitcoin will hit 96k, probably this week. The current price is around 91k, so this is definitely a good opportunity to sell or open a short position at 96k on futures because later this month/in January Bitcoin will most likely continue in a downtrend and hit 74k!
74k (74,508) is a significant swing low from April 2024. There is no doubt that a lot of retail traders have their stop losses placed exactly below this swing low. This acts like a strong magnet for huge institutions, hedge funds, and big banks (market makers). It's no longer a secret that Bitcoin's development and Bitcoin's price are completely controlled by these lizards. But let's take a look at the short-term prediction.
What we can see on the daily chart or on the 12h chart is a bear flag formation. This bear flag is so nice and almost textbook perfect! Inside the bear flag we have a WXY corrective pattern (3x ABC or 3x WXY). I think that this is a strong indication that the downtrend we see from the all-time high (126k) will likely continue in the next weeks.
Write a comment with your altcoin + hit the like button, and I will make an analysis for you in response. Trading is not hard if you have a good coach! This is not a trade setup, as there is no stop-loss or profit target. I share my trades privately. Thank you, and I wish you successful trades!
Community ideas

BITCOIN Why nobody talks about this??That was the last indicator standing and now it is as clear as it can get. With last month's candle close, Bitcoin (BTCUSD) has confirmed that it has already started a new Bear Cycle.
The reason is simple and it is one of the most basic trading indicators out there. The 1M MACD was already on a Bearish Cross since October, and November's closing widened the gap to such extent that it is not recoverable anymore.
This has happened every time during a BTC Bear Cycle and in two of the past three cases, it took place while already on the Bear Cycle. History has shown that there is no coming back from this and BTC should start looking for the 1M MA50 (blue trend-line) - 1M MA100 (green trend-line) Zone. If all the Bear Cycle indicators we've shown on analyses since September were early signs, the MACD is conclusive and as mentioned, has confirmed it.
But what do you think? Has the MACD Bearish Cross confirmed the new Bear Cycle beyond any doubt? Feel free to let us know in the comments section below!
---
** Please LIKE 👍, FOLLOW ✅, SHARE 🙌 and COMMENT ✍ if you enjoy this idea! Also share your ideas and charts in the comments section below! This is best way to keep it relevant, support us, keep the content here free and allow the idea to reach as many people as possible. **
---
💸💸💸💸💸💸
👇 👇 👇 👇 👇 👇

Bitcoin at Critical Resistance — Bull Trap!?Over the past couple of hours, Bitcoin ( BINANCE:BTCUSDT ) has surprised many traders—including myself—with its sharp movements. The potential reason behind this could be an anticipated interest rate cut tomorrow. However, the recent JOLTS Job Openings did not fully align with that expectation.
With our technical analysis tools, we can delve deeper into Bitcoin’s next moves. The key question is whether Bitcoin will maintain its recent bullish momentum or if a reversal is imminent.
It’s important to note that in the next 24 to 48 hours, we may see increased volatility in the financial markets, particularly in crypto. Therefore, it’s wise to practice good risk management—or even consider staying on the sidelines until the market settles.
At the moment, Bitcoin has managed to break through resistance lines, but the volume of this breakout hasn’t been particularly high. Bitcoin is also near a resistance zone($94,850-$93,000), monthly pivot points, and significant levels of Cumulative Short Liquidation Leverage($98,260-$94,600), all of which add to the complexity.
High sell orders: $96,000-$94,800
From a classical technical standpoint, there’s potential for a bearish flag pattern forming. As long as Bitcoin remains below $100,000, this scenario remains plausible.
From an Elliott Wave perspective, it seems that the main Wave B has completed, and we’re likely looking at a ZigZag correction(ABC/5-3-5). This correction might complete either at the resistance zone($94,850-$93,000) or near the daily 50_SMA(Daily).
Considering that the S&P 500 index ( SP:SPX ) is also showing a bearish trend, it’s more likely that Bitcoin’s main corrective Wave C will complete within these resistance levels.
Also, the USDT.D% ( CRYPTOCAP:USDT.D ) remains a crucial factor. Until it hits around 5.49%, the overall crypto market is likely to remain bearish.
In conclusion, I expect that Bitcoin will continue its downward movement, potentially testing $89,000 and even dropping below $85,000. This could represent a significant bearish phase for Bitcoin.
What are your thoughts? Do you think Bitcoin will maintain this bullish momentum, or are we headed for more downside?
Cumulative Long Liquidation Leverage: $89,430-$88,750
Cumulative Long Liquidation Leverage: $83,900-$82,400
First Target: $90,300
Second Target: $87,503
Stop Loss(SL): $100,020(Worst)
Points may shift as the market evolves
💡 Please respect each other's opinions and express agreement or disagreement politely.
📌Bitcoin Analysis (BTCUSDT), 4-hour time frame.
🛑 Always set a Stop Loss(SL) for every position you open.
✅ This is just my idea; I’d love to see your thoughts too!
🔥 If you find it helpful, please BOOST this post and share it with your friends.

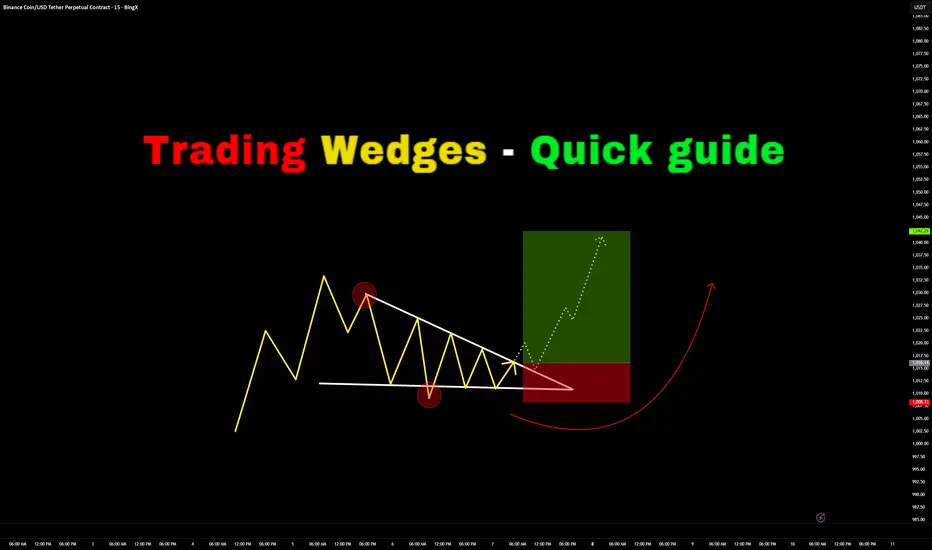
Trading Wedges - Quick Guide in 5 StepsWelcome back everyone to another guide, today we will speed run "Trading wedges" in a quick 5 step guide. Be sure to like, follow and join the community!
1) Identify the wedges:
- Falling Wedge
- Rising Wedge
- Symmetrical Wedge (Triangle)
2) Identify Breakout Direction:
- Falling Wedge > Bullish Breakout Expected
- Rising Wedge > Bearish Breakout Expected
- Symmetrical Wedge (Triangle) > Consolidation Expected
Breakout should show a candle closing outside the wedge.
3) Wait for retest to take place on previous key level or resistance (which would now be support)
If the retest holds with a strong rejection candle or consolidation - begin to long.
4) Enter Trade:
Enter on successful retest confirmation
SL for longs should be below previous low's
SL for shorts should be above previous highs.
5) TP levels:
TP 1) First high target
TP 2) Second high target
TP 3) Third high target.
RESULTS:
Price has soared up high and hit all three Take profits.
For trader who are wanting more profits you can potentially enable TP trailing afterwards - however I don't recommend this as you need to factor in your emotions of "GREED"
Thank you all so much for reading! Hopefully this is a useful guide in the future or present! If you would like me to make any simplified guides, let me know in the comments below or contact me through trading view!
Lingrid | GOLD Sideways Movement Ahead of FOMC DecisionOANDA:XAUUSD perfectly played out my previous trading idea . Price is holding inside a well-defined consolidation after its prior surge, with price rotating above the rising channel base. The trend remains constructive, but momentum has cooled, suggesting participants are waiting for a catalyst rather than committing aggressively.
If buyers continue to defend the trendline and the lower boundary of the range, gold could attempt another gradual push toward the upper resistance near 4,300. A brief dip toward the channel support may occur to gather liquidity, potentially offering a better positioning point before any renewed upside attempt.
➡️ Primary scenario: support holds near 4,160 → rotation higher toward 4,300.
⚠️ Risk scenario: a sustained breakdown below the channel could weaken the bullish structure.
If this idea resonates with you or you have your own opinion, traders, hit the comments. I’m excited to read your thoughts!

NQ Short (12-09-25)Basically same idea as Monday, not expecting much until Fed Decision. The O/N did use some failed auctions to pump the NAZ above nearside Danger Zone of 25,620-40 to upper resistance and KL 25,735, we are back under DZ at this time. Range today may be 630-730 for next move should the NAZ stay above 25,580, under play lower KL's.

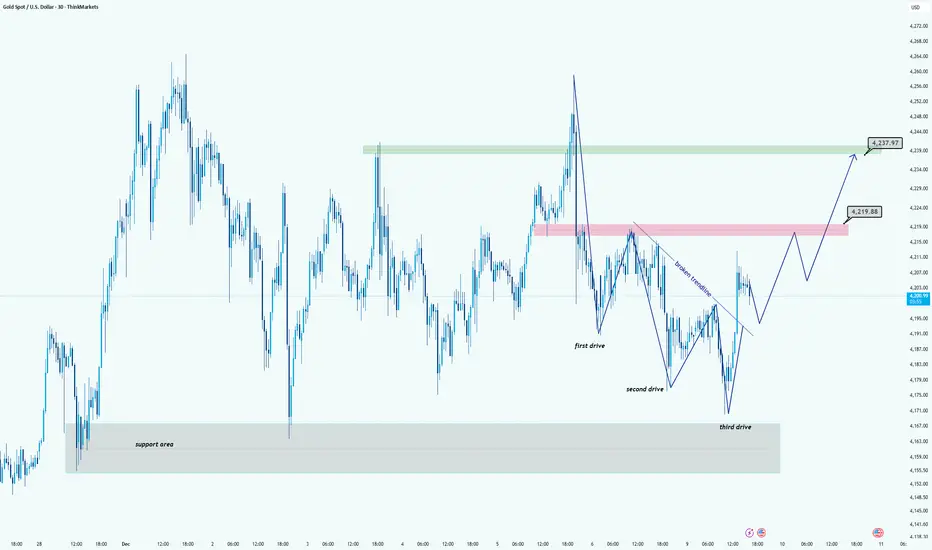
XAUUSD (GOLD) Trend Shift Confirmed After Third Drive ReactionHi!
Gold has completed a clear Three-Drive Reversal pattern, with the third drive tapping into the major support zone around 4165–4175. This area has repeatedly acted as a strong demand pocket, and the sharp reaction confirms buyers are still active. Following the third drive, price broke the minor descending trendline, signaling the first shift in short-term momentum.
Current Structure
After breaking the trendline, price is now forming a healthy sequence of higher lows. The next key area is the mid-range supply zone at 4215–4220 (highlighted in red). A controlled pullback into higher-low structure would maintain bullish pressure and build the base for continuation.
Upside Targets
If buyers successfully reclaim the 4215–4220 zone, the next major target sits at the 4237–4240 resistance (green zone). This aligns with the next liquidity cluster and previous strong reaction points.
⚠️ Validation
The bullish scenario remains valid as long as price holds above the structure created after the third drive. A heavy rejection back below the support zone would invalidate the setup.
Disclaimer: As part of ThinkMarkets’ Influencer Program, I am sponsored to share and publish their charts in my analysis.
XAUUSD Long: Demand Holds — Price Aiming for $4,260 RetestHello, traders! The current price action on GOLD (XAUUSD) is developing within a clearly defined ascending channel, showing that the broader bullish structure remains intact despite recent corrective movements. Earlier, the market formed a Double Top pattern near the upper Supply Zone around $4,260, which triggered a bearish reaction and a downside breakout from that distribution phase. After this rejection, price moved into a corrective decline, respecting the Triangle Supply and Demand lines, where multiple breakouts confirmed increasing volatility and active participation from both buyers and sellers. Following the corrective phase, Gold reached a key Pivot Point near the lower Triangle Demand Line, where strong buying interest appeared and initiated a bullish reversal. From this base, price broke back above resistance and entered the current Ascending Channel, forming higher highs and higher lows.
Currently, XAUUSD is consolidating near the $4,190–$4,200 Demand Zone, where buyers are actively defending the structure. The market is holding above channel support, suggesting that bullish momentum is stabilizing after the pullback.
My scenario remains bullish as long as price stays above the highlighted Demand Zone around $4,180–$4,190 and continues to respect the lower boundary of the ascending channel. I expect Gold to gradually build momentum and attempt another move toward the $4,260 Resistance level, which represents the next major target and the top of the recent supply area. A confident breakout above this zone would signal trend continuation and open the door for further upside. However, a failure to hold current demand could trigger a deeper correction back toward the lower channel area. For now, the structure favors buyers, with $4,260 as the main upside objective. Manage your risk!

BTCUSD Buyers Defend Support — Market Targets $91,5K — $93K ZoneHello traders! Here’s my technical outlook on BTC/USD based on the current market structure. After a strong bullish recovery from the lower demand area near $83,500–$85,000, the price formed a steady impulsive move upward and entered a consolidation phase inside the marked range below the key $93,000 resistance level. Multiple breakout attempts from the range were followed by corrective pullbacks, showing active participation from both buyers and sellers. Once BTC broke above the range, the price initiated another bullish leg but quickly transitioned into a symmetrical triangle structure, defined by the descending Triangle Resistance Line and the rising Triangle Support Line. Currently, BTC is compressing inside this triangle while holding above the critical $89,500 Support Level, which is acting as the main short-term demand zone. Buyers continue to defend this area, keeping the bullish bias technically valid. The price is now approaching the upper triangle resistance again, hinting at a possible volatility expansion. As long as BTC remains above $89,500, the bullish scenario stays in play. I expect a breakout from the triangle toward TP1 at $91,500, followed by a potential continuation toward TP2 at $93,000, which is the major resistance zone. However, a breakdown below the triangle support would invalidate the setup and may trigger a deeper corrective move. For now, the market remains in a compression phase, preparing for its next directional impulse. Please share this idea with your friends and click Boost 🚀

EURUSD Bearish Outlook After Trendline BreakQuick Summary
After breaking the ascending trendline, EURUSD is expected to continue moving lower. The market may target the previous two lows to collect liquidity, and there is currently no clear buy signal.
Full Analysis
The recent break of the ascending trendline on EURUSD changes the short term outlook and suggests that the market is preparing for a deeper move to the downside. This break indicates weakness in the previous bullish structure and opens the door for the pair to target lower liquidity levels.
Price is likely to continue its decline to sweep at least the last two lows. Whether the intention is to continue the broader downtrend or simply create a deeper correction before moving higher, the immediate expectation remains bearish.
At the moment, there is no strong buy signal. The market has not shown any clear rejection or shift in structure that would support a bullish entry. Until price reaches a meaningful demand zone and shows a convincing reaction, buying would carry unnecessary risk.

GOLD → Price within range ahead of Fed meeting FX:XAUUSD is consolidating within a wide range amid expectations of the Fed's interest rate meeting. The fact that interest rates will be lowered has most likely already been factored in by the market. There is a possibility of a long squeeze...
New threats of tariffs by Trump (on fertilizers from Canada and against Mexico) are weakening the dollar and supporting gold.
As for interest rates, the Fed is expected to cut rates by 25 basis points, but the market has most likely already priced in the cut. Accordingly, there may be countertrend movements (MM traps) to accumulate liquidity before further advances.
Today's JOLTS data on job vacancies may cause increased volatility. According to statistics, before and after interest rate cuts, gold forms a swing correction, within which it may test the support of the range against the backdrop of a bullish trend...
Resistance levels: 4219.5, 4256
Support levels: 4200, 4180, 4163
Ahead is a strong liquidity zone at 4220, and the retest may end in a decline. MM may continue to accumulate liquidity before further advancement. I expect a retest of the range support with the aim of retesting the liquidity pool at 4175-4165 before a possible rise.
Best regards, R. Linda!

All you need to know: WHEN and WHERE (short giude)Most traders lose money not because they’re wrong about direction… but because they’re wrong about WHEN and WHERE direction actually matters.
This is the missing piece in 99% of trading strategies.
Let’s break it down simply and clearly.
1. WHERE Matters First: Price Location Defines the Entire Trade
The market is not equally important at all prices.
There are only a few places where decisions actually have consequences:
🔹 1. Major Higher-Timeframe Levels
- Daily, Weekly and even monthly support, resistance, supply, demand.
- This is where big players care.
- Most BIG moves begin here.
🔹 2. Volatility Compression Zones
- Tight ranges, triangles, squeezes, etc
- When volatility compresses, potential energy builds.
- Breakouts here actually matter.
🔹 3. Break-and-Retest Structures
- The retest is where confirmation happens.
- It’s where weak hands exit and smart money enters.
🔹 4. Trend Extremes / Overextensions
- Parabolic rallies, vertical drops, stretched momentum.
- These locations create the most powerful reversals.
🔹 5. Liquidity Pools
- Above swing highs, below swing lows, around obvious trendlines.
- Institutions hunt these levels before moving the market.
If you’re not trading at one of these five locations, you are trading noise.
2. WHEN Matters Even More: Timing Is the Difference Between Chop and Trend
Even the best location is useless if the moment isn’t right.
Here are the only timing conditions that give your trade real probability:
🔸 1. Volatility Expansion After Compression
- Wait for candles to elongate, volume to increase, and the range to open up.
- Before expansion: fakeouts.
- After expansion: real moves.
🔸 2. Liquidity Sweeps
- The market clears stops → fills institutional orders → reveals true direction.
- You don’t act before the sweep; you act after it confirms.
🔸 3. Structural Confirmation
- Higher low in an uptrend.
- Lower high in a downtrend.
- Break → Retest → Continuation.
- Without structure, timing is random.
🔸 4. Active Market Sessions
- London open, NY open, session overlaps, major news events.
- The same setup at 03:00 means nothing — the same setup at NY open is a trade.
🔸 5. Multi-Timeframe Momentum Alignment
- HTF gives the bias
- MTF gives the setup
- LTF gives the entry
- When timeframes align, timing becomes obvious.
3. WHERE + WHEN = Non-Random Trades
This is what professional trading really is:
- WHERE = the place price must react
- WHEN = the moment price has conviction
Combine both and you no longer predict — you simply respond to high-probability situations.
- This is how you avoid chop.
- This is how you avoid forcing trades.
- This is how you become consistent.
4. The Psychological Shift
Retail traders think:
“I must forecast the next move.”
Professionals think:
“I only act at key locations, when timing conditions align.”
This removes:
- FOMO
- guessing
- impulsive entries
- emotional trading
You no longer chase the market.
You wait for the market to come to your WHERE and your WHEN.
That’s the edge.
5. Final Thoughts
You don’t need to predict the market.
You don’t even need to know what happens next.
You only need to know:
- WHERE the market becomes important
- WHEN a move becomes meaningful
Master these two, and everything else falls into place.
P.S.
I know this is easier said than done. Even after many years in the market, with a solid sense of direction and plenty of sniper-level entries, my WHEN is not always perfect either. That’s the part none of us ever truly “master” — we only learn to manage it better.
So take all of this as a blueprint, not a declaration that I execute flawlessly. I’m a professional, yes — but I’m also in a continuous process of adapting, refining, and learning from every new shift the market throws at us.
Experience helps, but the market keeps evolving, and so do I. Just like anyone else should.

Trading Plan - What should be included and how to improve it. I have been failing same like many traders are failing these days for same reason. Not having a plan and clearly defined when to trade , when not to trade and didn't have set barriers when to stop. Always wanted to make more. Yes it sounds boring and restrictive. But you will either lean on plan or on impulses.
Everything start with visualization of how your trade setup should looks like. You should know what exactly you are looking for and describe it as much as possible for example:
🧩 Basic Concept
Im looking for the fake break out of the range. Whether we call it manipulation or Stop hunt. It really doesn't matter. The idea is that once big candle is created it creates fomo and break out traders are entering continuation. I trade against them.
📍 Bullish continuation setups
Model 1 - Entry after manipulation - 50% target
Model 2 - Entry on pullback on level between 61.8 - 80% 📍 Bearish Continuation setups
Model 1 - Entry after manipulation - 50% target
Model 2 - Entry on pullback on level between 61.8 - 80% pullback This is your strategy, your pattern you are looking for in the specific situations and market conditions.
📍 Trading plan
is how, when and where , you are going to execute it. It's also good to describe your step by step process, so you remind it to yourself. I suggest to read it before every trading session. Especially beginners or if you adopted a new strategy. Describe every trade element as much as possible. With experiences you will be improving and shaping it. It has to be as simple as possible. 📍 Trading Pairs - If you are day trader / Intra week trader focus on 8 pairs maximum, You dont need more - DXY, EUR, GBP, CHF, BTC, ETH, SOL, XAU
📍 Market Bias - Describe how you analyze your Bias - Trend
Do you have HTF Trend / Liquidity ?
Internal LQ - Discount / Premium
External LQ - Significant HL taken
Monday, Friday, Weekly CLS Range
Key Level ? - If NO - NO trade
Liquidity Sweep + SMT
CIOD - Close - Model 1- 50% TP
📍 Down Trend - Trade Stop hunts above the highs
📍Up Trend - Trade Stop Hunt below the lows 📍 TF Alignment CLS Range + Entry - Structure of my Top Down analysis
Weekly / Daily Range - CLS Range
H4 / H1 / M30 / M15 - Entries
Don't overcomplicate it this works 📍 Setup Qualifications - If one of criteria is not met = No trade
High volatility Stop hunt
Stop run out of CLS range - 0.15%
Rejection from Key Level
CIOD on the LTF Model 1
Correct times - NY, LO , PM Sessions
📍 Entry Model 1
CIOD - the next candle below / above open
if the engulfing candle is too big, wait for a pullback
If range is too big take TP at 50%
Look for correlated pairs
If within HTF trend, target full range.
📍Bullish Scenario LTF Change in order flow is important aspect of the trade if you dont wait patiently for the candle close on the right timeframe, setup is invalid. 📍Bearish Scenario
as you can see price action never looks completely same you need to practice your eyes to see it, profiles, levels and what is happening on the edge of the range. Another and not less important part is knowing when not to trade. Also Im not perfect and even I have quite good plan sometimes I dont follow so reminding these mistakes and reading them in my trading plan is great way to eliminating them next time.
🧪 Low Probability Conditions
Day and Day before NPF, FOMC or CPI
Last and First day of a New Month
Dont buy or sell in the direction of overextended markets
An HTF objective has been met
Price tripped between two Key Levels
🧪 Don't trade IF
- Equal highs / Lows around your SL
- If stop run is to shallow
- Candle didn't closed yet
- If you didn't catch the initial move - don't fomo
- No room for at least 2RR
🧪 Recent Mistakes
- Trading within wrong market conditions
- Entering before CIOD confirmed
- Shallow manipulations
- Now waiting for the PWL / PDL Work on constant improvement, not by adding indicators or by looking for new strategy, commit to the one and master it . 1 Kick - 10 000 times
⁉️ This is questions Im asking myself when going thru past trades. It will help you improve as a trader and shape your trading plan.
- Was there a type of trade that did/didn’t work well?
- Was there a particular market that I did/didn’t trade well?
- Was there a particular day/time that I did/didn’t trade well?
- Did I enter trades too soon?
- Did I enter trades too late?
- Did I take profits too soon?
- Did I take profits too late?
- Did I put my stops loss too tight?
- Did I use an unnecessarily big stop loss?
- Did I take take any trades with poor Risk:Reward ratio?
- Did I risk too much?
- Did I risk too little?
- Did I deviate from my trading model?
- Did I deviate from my plan?
I promised myself I’d become the person I once needed the most as a beginner. Below are links to a powerful lessons I shared on Tradingview. Hope it can help you avoid years of trial and error I went thru.
📊 Sharpen your trading Strategy
⚙️ 100% Mechanical System - Complete Strategy
🔁 Daily Bias – Continuation
🔄 Daily Bias – Reversal
🧱 Key Level – Order Block
📉 How to Buy Lows and Sell Highs
🎯 Dealing Range – Enter on pullbacks
💧 Liquidity – Basics to understand
🕒 Timeframe Alignments
🚫 Market Narratives – Avoid traps
🐢 Turtle Soup Master – High reward method
🧘 How to stop overcomplicating trading
🕰️ Day Trading Cheat Code – Sessions
🇬🇧 London Session Trading
🔍 SMT Divergence – Secret Smart Money signal
📐 Standard Deviations – Predict future targets
🎣 Stop Hunt Trading
🧠 Level Up your Mindset
🛕 Monk Mode – Transition from 9–5 to full-time trading
⚠️ Trading Enemies – Habits that destroy success
🔄 Trader’s Routine – Build discipline daily
💪 Get Funded - $20 000 Monthly Plan
🛡️ Risk Management
🏦 Risk Management for Prop Trading
📏 Risk in % or Fixed Position Size
🔐 Risk Per Trade – Keep consistency
David Perk aka Dave FX Hunter ⚔️
XAUUSD Range Resistance Holds — Pullback Toward $4,170 in FocusHello, traders! Here’s my technical outlook on GOLD (XAUUSD) based on the current market structure visible on the chart. After a strong rebound from the previous lower demand area, price moved into a steady ascending structure, respecting the rising Support Line and forming higher highs and higher lows. This bullish impulse later transitioned into a corrective consolidation, where Gold entered a well-defined range below the major 4,260 resistance level. The repeated rejection from this resistance confirms strong selling pressure at the top of the range, while buyers continue to defend the 4,170 support level, keeping price compressed between these key boundaries.Currently, XAUUSD is trading inside this consolidation box, while also respecting the descending short-term resistance line from the recent swing highs. The market previously broke out from the bullish channel and is now showing signs of weakness beneath the upper boundary of the range, suggesting that upside momentum is fading. As long as price remains capped below 4,260, the risk of a deeper corrective move remains elevated.My primary scenario is bearish as long as Gold stays below the 4,260 resistance and continues to respect the descending resistance line. I expect price to gradually move lower toward the TP1 target at 4,170, which is the first key support inside the structure. If selling pressure accelerates and this level fails to hold, the next downside objective stands at TP2 around 4,120, where stronger demand could emerge. A clear breakdown below TP1 would confirm bearish continuation. However, if price reclaims 4,260 with strong momentum, this bearish setup would be invalidated and the bullish trend could resume. For now, the structure favors a corrective pullback toward 4,170–4,120. Please share this idea with your friends and click Boost 🚀
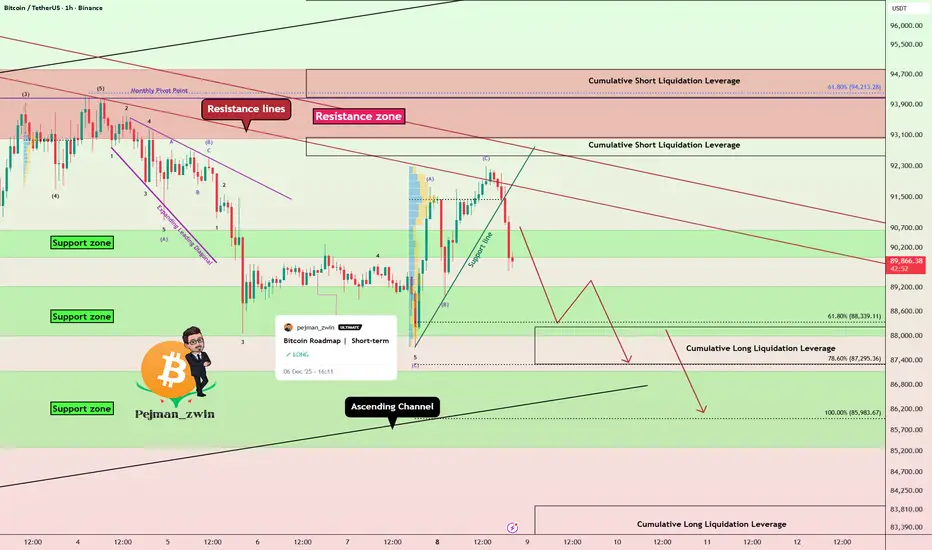
Bitcoin Breakdown After Perfect Bounce — Short Setup LoadingAs I expected , Bitcoin bounced from the support zone and reached its targets.
Right now, Bitcoin has rejected from resistance lines and successfully broke both the support line and the support zone($90,650-$90,000).
From an Elliott Wave perspective, it appears that Bitcoin has completed a ZigZag structure, and we should now anticipate the start of a bearish wave sequence.
The S&P 500 index( SP:SPX ) also shows a bearish outlook, and given Bitcoin’s correlation with SPX, further downside in BTC is not surprising.
At the same time, USDT.D%( CRYPTOCAP:USDT.D ) has turned bullish again—at least in the short term—which can add additional pressure on Bitcoin.
I expect Bitcoin to continue its downward movement, at least toward the next support zone($87,140-$85,290) and the lower line of the ascending channel.
Note: It’s better to wait for a bullish correction before entering, and then take a short position according to your own strategy.
Cumulative Short Liquidation Leverage: $98,260-$96,690
Cumulative Short Liquidation Leverage: $93,040-$92,560
Cumulative Long Liquidation Leverage: $94,840-$94,100
Cumulative Long Liquidation Leverage: $83,900-$82,400
Target: $87,733
Stop Loss(SL): $92,723(Worst)
Points may shift as the market evolves
💡 Please respect each other's opinions and express agreement or disagreement politely.
📌Bitcoin Analysis (BTCUSDT), 1-hour time frame.
🛑 Always set a Stop Loss(SL) for every position you open.
✅ This is just my idea; I’d love to see your thoughts too!
🔥 If you find it helpful, please BOOST this post and share it with your friends.
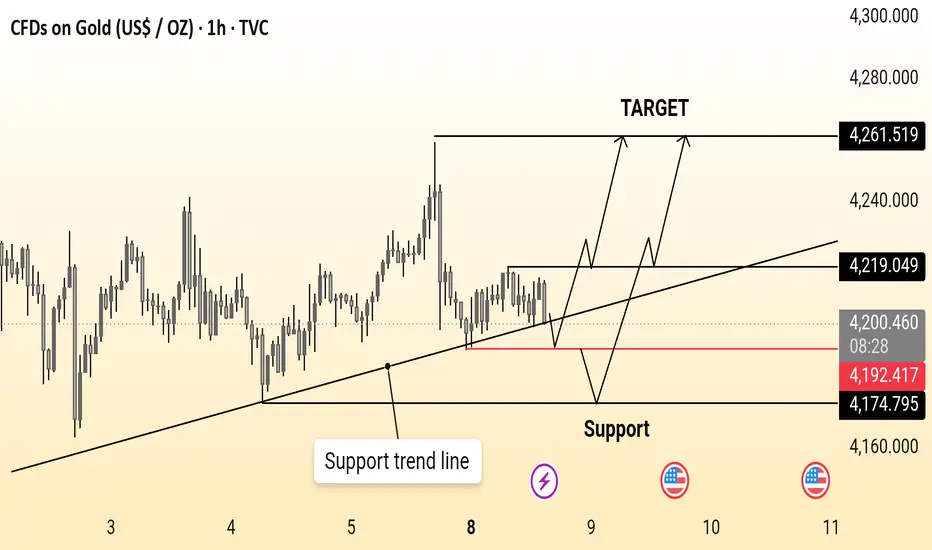
Gold ideaGold (1H) is holding above a rising support trend line, maintaining a bullish structure. As long as price stays above the 4,174–4,192 support zone, a move toward 4,261 remains likely.
Dow Jones is approaching an important support! Hey Traders, in today's trading session we are monitoring US30 for a buying opportunity around 47,350 zone, Dow Jones is trading in an uptrend and currently is in a correction phase in which it is approaching the trend at 43.350 support and resistance area.
Trade safe, Joe.

XAUUSD: The Uptrend Is Gaining Momentum AgainGold traded cautiously yesterday as investors waited for this week’s FOMC meeting. But this very “quiet phase” is building the foundation for a new upward leg, as the fundamental factors still lean strongly toward the Bulls.
1. The Fed Is Nearing a Policy Shift – A Direct Boost for Gold
Lower interest rates are always a key catalyst for gold because the metal does not generate yield. When yields fall, gold immediately becomes more attractive. The market is now almost fully pricing in a potential rate cut from the Fed in early 2025 – a powerful driver for the medium-term uptrend.
2. Central Banks Continue to Buy – A Strong and Steady Support
Despite short-term pullbacks, central bank demand remains consistently strong. These institutions are long-term players, and their continued accumulation helps gold maintain its bullish tone across the entire market.
3. Geopolitical Tensions Stay Elevated – Gold Remains Well Supported
The unified support from the leaders of France, Germany, and the UK for Ukraine in London shows tensions are far from easing. Rising instability → more reasons for gold to stay strong.
4. Technical Outlook
Price is reacting around the strong resistance at 4250, but there is still no significant selling pressure.
Ichimoku shows Kumo providing solid support, with price staying above the cloud – confirming the dominant uptrend.
Current buy setup remains very reasonable:
SL: around 4173
TP: targeting 4253–4260
If price gives a mild retest and bounces, the probability of breaking above 4250 is very high.
Conclusion: The Trend Remains BULLISH
With supportive macro fundamentals + strong technical structure, XAUUSD continues to hold a clear bullish formation. As long as the Fed does not sound too hawkish, gold could easily break above 4250 and head toward higher levels in the coming days.

Gold 1H – Will 4232 Liquidity Trigger Reversal or 4188 Hold Flow🟡 XAUUSD – Intraday Smart Money Plan | by Ryan_TitanTrader (10/12)
📈 Market Context
Gold trades inside a politically-driven liquidity landscape after former U.S. President Donald Trump signaled that rate-cut willingness will be his litmus test for selecting a new Fed Chair.
This comment injects uncertainty into interest-rate expectations, making markets sensitive to any shifts in forward guidance.
Higher-for-longer fears remain intact intraday, keeping gold capped below premium zones while liquidity builds on both edges.
On H1, price is compressing around mid-range with clean liquidity resting at 4232 above and 4188–4190 below—ideal sweep conditions before institutions commit to direction.
🔎 Technical Framework – Smart Money Structure (1H)
Current Phase: Sideways compression after BOS + CHoCH sequence
Key Idea: Expect a sweep above 4230–4232 or below 4190–4188 before true displacement
Liquidity Zones & Triggers:
• 🔴 SELL GOLD 4230 – 4232 | SL 4240
• 🟢 BUY GOLD 4190 – 4188 | SL 4180
Institutional Flow Expectation:
sweep → MSS/CHoCH → BOS → displacement → FVG/OB retest → expansion
🎯 Execution Rules (matching your exact zones)
🔴 SELL GOLD 4230 – 4232 | SL 4240
Rules:
✔ Price sweeps the liquidity cluster above 4230
✔ Bearish MSS/CHoCH on M5–M15
✔ Downside BOS + clean bearish displacement
✔ Entry via FVG refill or refined OB retest
Targets:
1. 4212
2. 4200
3. 4190
🟢 BUY GOLD 4190 – 4188 | SL 4180
Rules:
✔ Liquidity grab under 4190–4188
✔ Bullish MSS/CHoCH confirms demand takeover
✔ Upside BOS + impulsive displacement from discount
✔ Entry via bullish FVG fill or demand OB retest
Targets:
1. 4205
2. 4220
3. 4230–4232
⚠️ Risk Notes
• Trump’s remarks may spark abrupt shifts in expectations → avoid entries without BOS + displacement
• Don’t chase candles inside the compression channel
• SL placement must respect structural invalidation
• Reduce exposure if volatility spikes during Fed-related headlines
📍 Summary
Today’s play revolves around two liquidity-driven scenarios:
• A 4232 sweep triggers bearish structure, delivering into 4200 → 4190
or
• A 4188 liquidity grab forms bullish MSS, expanding toward 4220 → 4232
Let structure confirm—SMC is reaction, not prediction. ⚡️
📌 Follow @Ryan_TitanTrader for more Smart Money breakdowns.

Gold’s Next Big Move: 4,350 Is Within Reach!Hello everyone, it's Helene here!
Gold is looking pretty interesting right now. As mentioned in the previous analysis, the price shot up. But guess what? Right now, it's slightly pulling back, moving in the opposite direction to the previous uptrend, which looks like a familiar bullish flag pattern. In this case, there's a scenario that could play out, and considering the market conditions are still bullish, I'm leaning toward the possibility that the price will break the flag pattern to the upside.
My target is 4,350.
Do you agree? Leave a comment below. Joining the TradingView community is always helpful to improve and develop your trading skills.

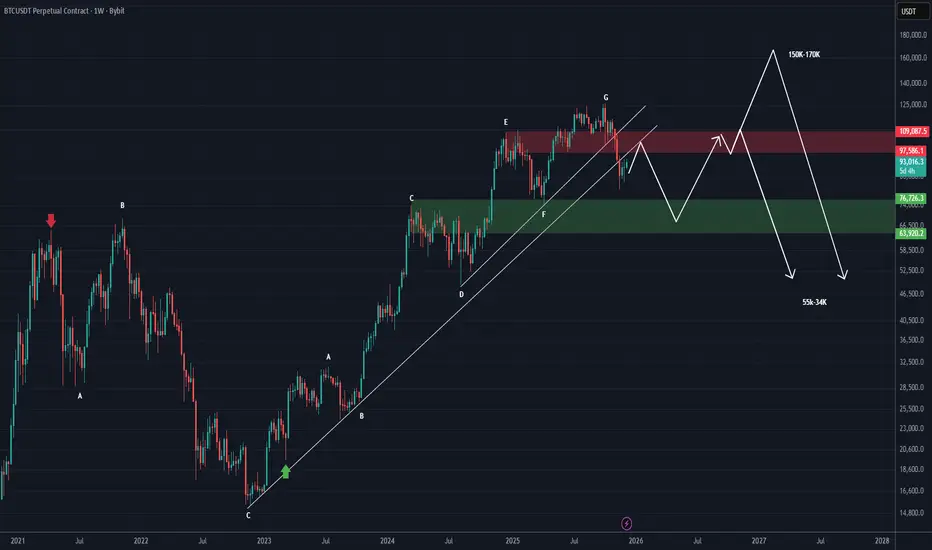
Bitcoin RoadMap (1W) | Important UpdateIt’s better to first have a complete roadmap for Bitcoin for the coming months.
We have cleaned up the chart as much as possible, making the pattern lines and range zones invisible so the chart remains uncluttered.
As you can see, Bitcoin is trading below the upward trendlines and also below the FLIP zone.
It is expected that the price will be rejected from the red zone down toward the 76K to 64K range, and then from that area it may attempt a move toward higher levels.
If the red zone is broken, the price could reach the 150K to 170K area. However, if it fails to hold above the red zone, it may drop to the 55K range and even 27K, potentially starting a bearish cycle.
This is the condition for Bitcoin | it should not be compared with altcoins, and many altcoins may even become bullish while Bitcoin is in a bearish cycle!
For risk management, please don't forget stop loss and capital management
When we reach the first target, save some profit and then change the stop to entry
Comment if you have any questions
Thank You
Price Compressing Below Trendline, Waiting for a Liquidity SweepGold continues to consolidate inside a narrow range as markets wait for fresh USD flows and upcoming Fed expectations. Sellers are losing momentum, but buyers still haven’t secured a clean breakout as price remains capped beneath the short-term descending trendline.
Current structure suggests a classic “liquidity sweep → bullish reversal” setup, with clear liquidity buildup sitting underneath the market.
📊 MMF Technical Outlook (H1)
1️⃣ Price reacting around a previous POC zone (Volume Profile)
Heavy traded area → easy for fake moves
No clean breakout above 4,218 yet
2️⃣ Key Levels – Main Setup Favors “Dip-Buy”
Important zones:
4,218 – 4,220 → Minor supply + descending trendline; breakout needed for bullish continuation
4,190 – 4,181 → Liquidity sweep zone (ideal buy area)
4,242 → Main upside target if breakout confirms
Structure shows price may dip lower first to clear liquidity before reversing upward.
🎯 MMF Daily Plan – BUY After Liquidity Sweep
▶️ Primary Scenario (High-Probability)
Wait for price to sweep liquidity into 4,190 → 4,181.
🔹 BUY Zone: 4,190 – 4,181
🔹 SL: below 4,172
🔹 TP1: 4,218
🔹 TP2: 4,242
Why this works:
Confluence: liquidity pocket + fib retracement + structural demand
MMF Flow suggests a clearing phase before bullish expansion
▶️ Secondary Scenario (Break & Retest)
If price breaks strongly above 4,218, wait for a clean retest to join the trend.
🔹 Entry: 4,218 – 4,220
🔹 TP: 4,242
🧭 MMF Bias Today
Bias: Neutral → Bullish as long as 4,180 holds
Avoid FOMO buys into 4,218 resistance
Only engage after a sweep or a clear BOS + retest

BTC/USD 4H CHART PATTERNThis BTC/USD chart shows a clean breakout above a long-term downward trendline that has been holding the price lower for several weeks. Each previous touch of this trendline resulted in rejection, but Bitcoin has now broken through with bullish momentum, supported by price action moving above the Ichimoku cloud. This shift indicates improving market sentiment and increasing buyer strength. After the breakout, the chart suggests that Bitcoin may continue climbing toward the next major target at 98,850, marked on the right side. If the price holds above the breakout zone and maintains stability above the cloud, the bullish continuation becomes more likely. Overall, the structure favors upside movement toward the highlighted target zone.
If you found this XAUUSD analysis helpful, don’t forget to LIKE 👍 and COMMENT 💬!
