BNB ABCBNB coin can be bullish.
This is an analysis of price pattern reading and may be wrong.
If this coin is bullish, so are other coins.
I have been given various fall analyzes last month in June. and it has brought me the truth but minimally. they have fallen, but not the initial assumption (not yet or

BNB Consolidating Inside a Triangle Patter, Bulls in ControlBNB Consolidating Inside a Triangle Patter, Bulls in Control
Price Analysis:
The price is developing a triangle pattern which is showing the possibility for a bigger bullish movement.
In the 4-hour chart the price faces a strong resistance near 590 but after this bullish accumulation, we should
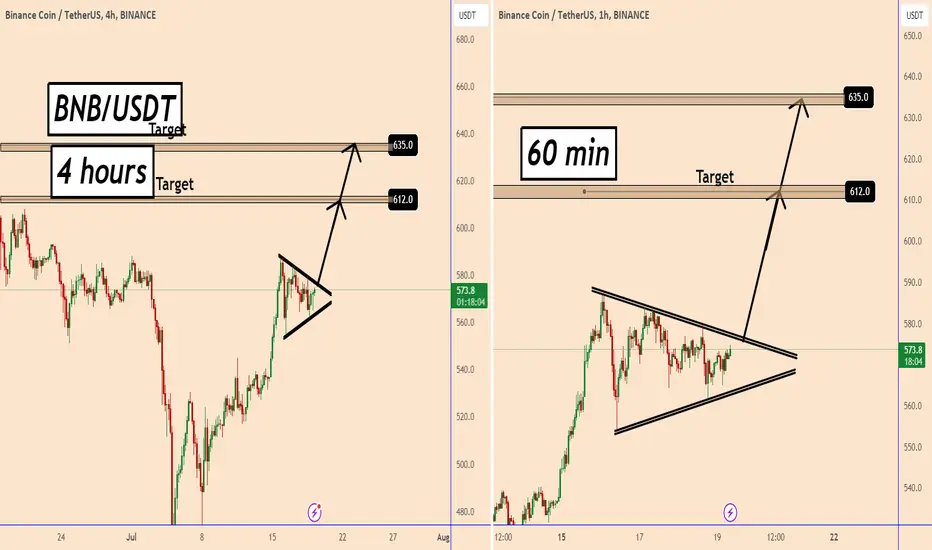
spotIn the crypto market, after each liquidity and receiving it
Spot buying becomes very important. You can buy in two stages of the current price and in the specified prices

Binance Will PumpThe chart says it all if you know were to look, it's truly that simple.
The fundamentals are the same, but the technicals are leading this one.
Use stops, be safe.

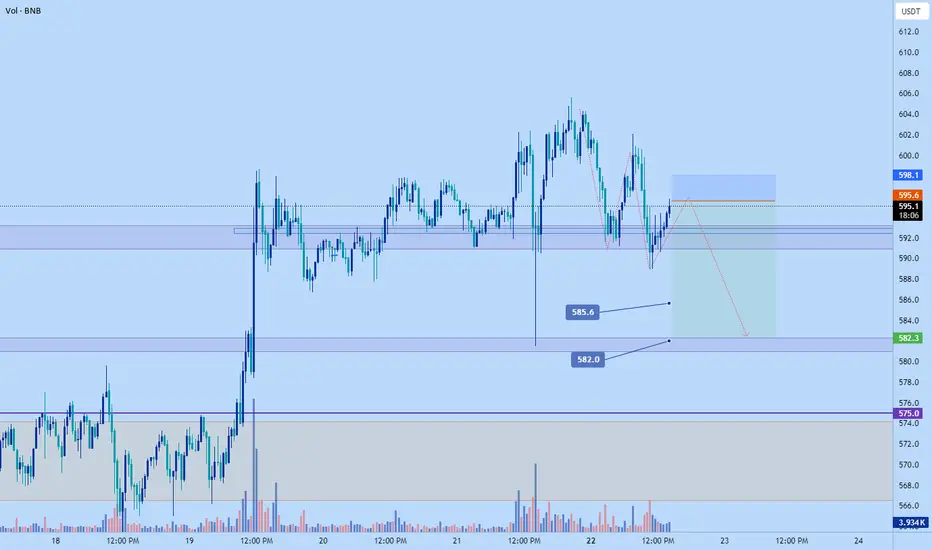
BNB to collapse to $582...today!Targets for #BNB Short
Tp 1 🎯$585.6 -- 50% 💵
Tp 3 🎯$582 -- close 💵
(I'll only take partial at TP 1 if the market is hesitating to drop lower, main target is $582. Also I keep my targets open unless am going to bed or if I will be away because sometimes the market can flush drop or pump aggressivel
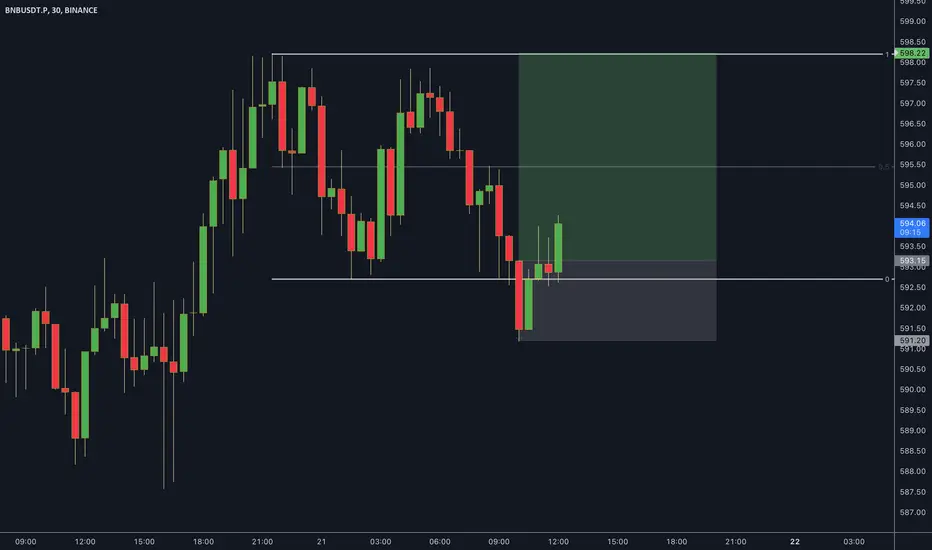
BNB super pump to $605...todayjust entered bnb long.
Target $603.7 and higher.
#bnbusdt #bnbusd
I anticipate a big rally pump today to try and make a higher high on the daily tf and I think this is the new potential hl low that just formed given the volume and bullish price action in this area.
Roughly 6 RR trade

BNB local longPotential accumulation range with a spring, so there is a probability to see price higher at the range high
BNBUSDT Buy SetupBinance coin Buy setup. We see triangle pattern on this chart, Bullish breakout is still active. 608 level is the target of this pattern. Risk reward 1:1.6


BNBUSDT BINANCE 1W-TIMEFRAME ANALYSIS💥BNBUSDT BINANCE 1W-TIMEFRAME ANALYSIS
💗Hello ladies and gentlemen
This is my new idea for 💥BNB BINANCE
I hope my idea is clear
Support me by like and share thank you
Stay Safe💯💲💲💲
Good luck💰😍

See all ideas
Curated watchlists where BNBUSDT.P is featured.

Interest-earning crypto wallets: Put your digital money to work
12 No. of Symbols

Proof of Stake: Seeking validation?
26 No. of Symbols
See all sparks