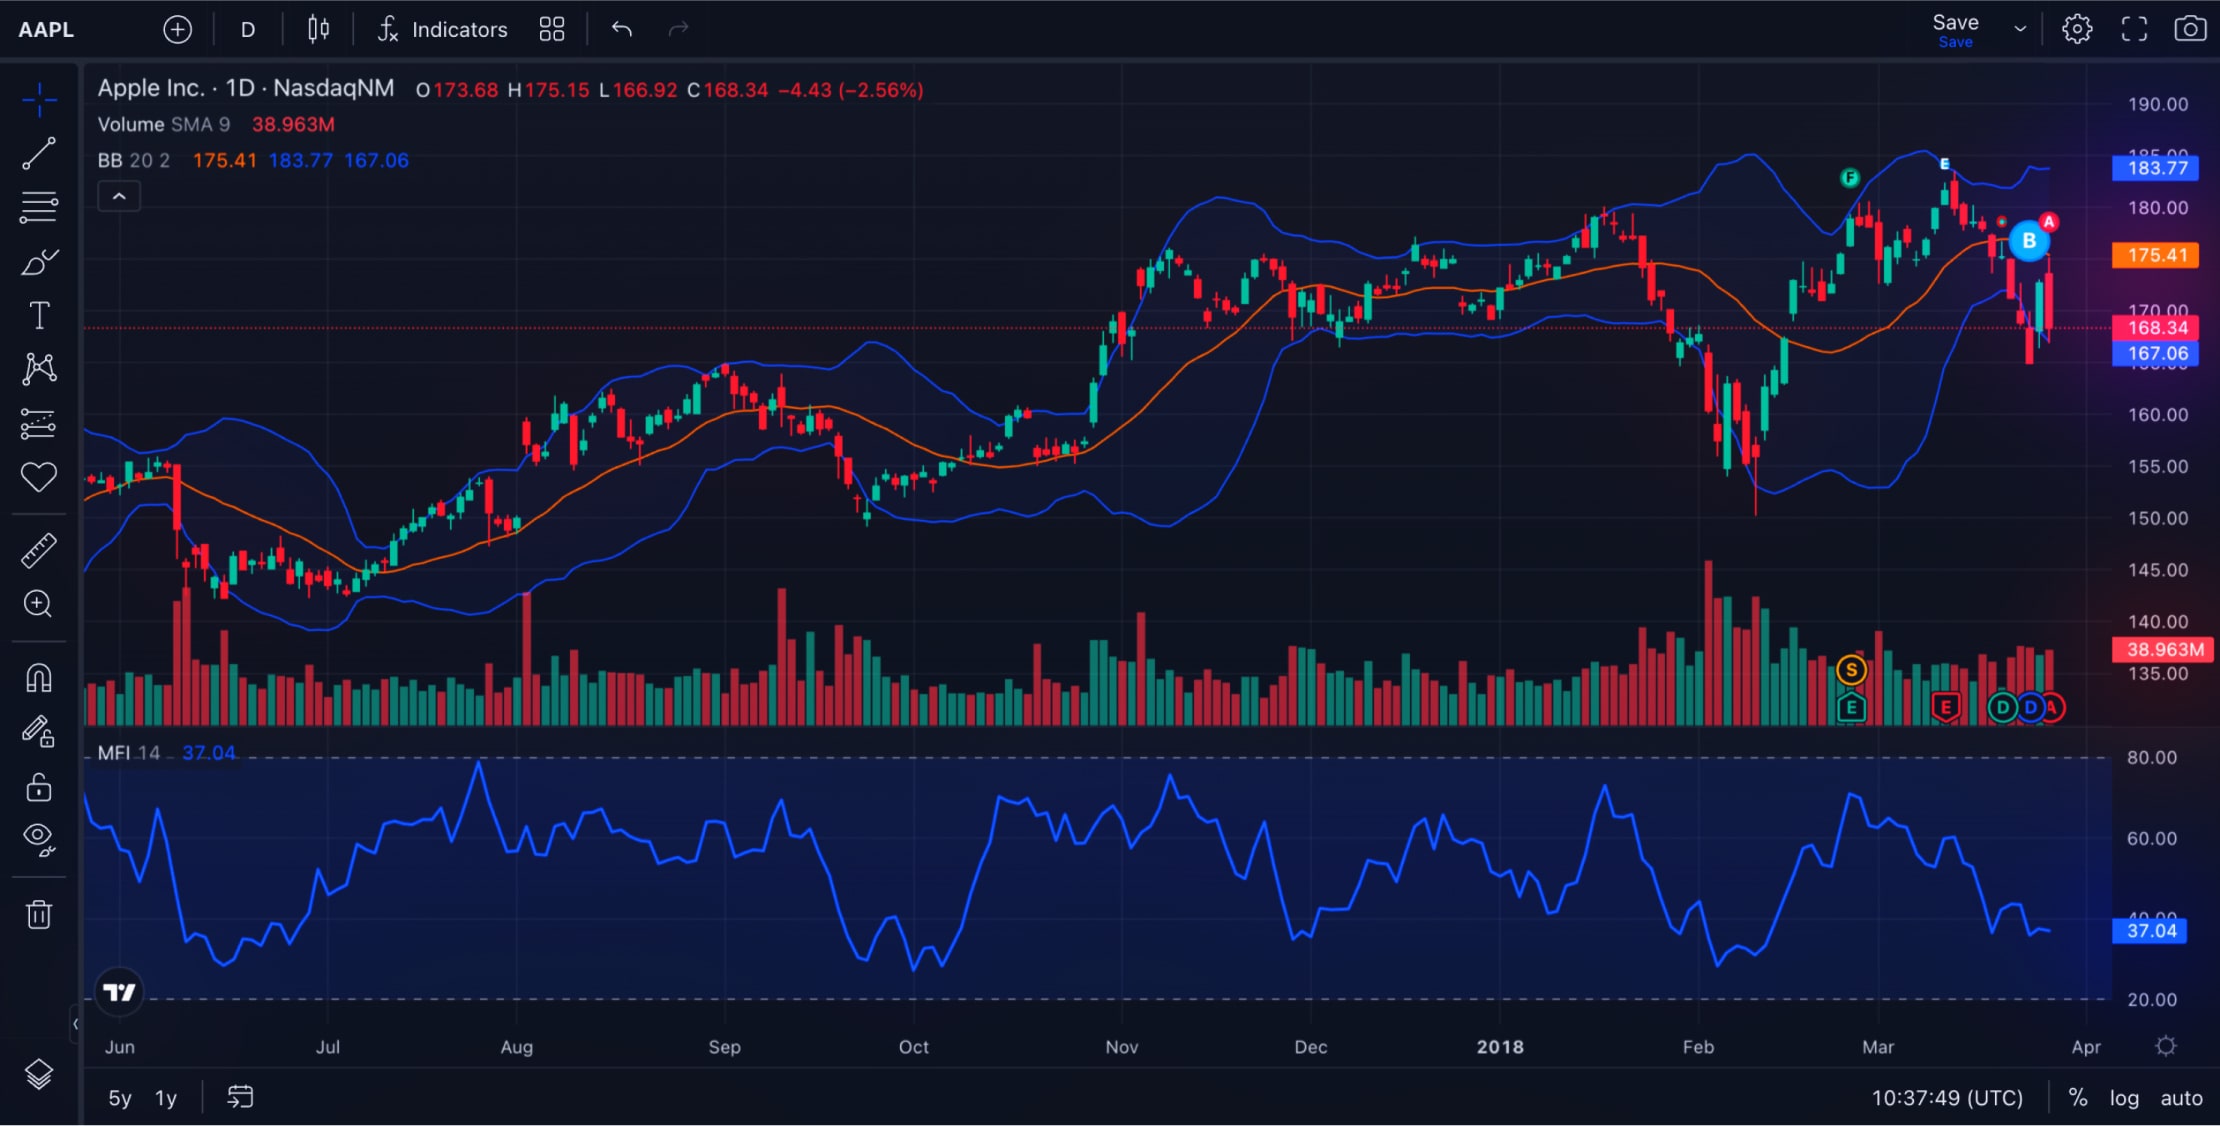
Heart of the
financial web
Power up your apps and websites using our charting libraries.


Compare libraries
Our libraries are trusted and used by over 40,000 companies and 90,000,000 traders around the world — so you can be sure we've included all the important stuff.
Lightweight Charts™
Advanced Charts
Trading Platform
Top performance that fits on a floppy disk.
All the best features for technical analysis sensei.
We've spent years building this for expert traders.
General
Mobile friendliness
Interactivity
Chart types
Finance at the heart
of it all
Interactive, responsive and mobile-optimized
The highest of high-performance
Developer-friendly
Multiple languages supported
Always updating
Accessibility in mind
We're striving to make more of our product compliant with leading accessibility standards, so that more users have more access to markets – regardless of their specific needs.
Learn moreCustomer stories
Stories from the world's leading teams.
“ TradingView was immensely supportive throughout the integration in implementing API and adding new features.
Integration details
Advanced Charts integrated into the Refinitiv terminal.
The tailor-made UI matches the original Refinitiv design.
Unique indicators were added for advanced analytics.
Brand new custom features met power users' needs.
Data feed capabilities allowed the addition of event markers.


“ With a wide range of easy-to-use charts and insightful data, TradingView brings our educational articles to life.
Integration details
Lightweight Charts™ underpin the in-built Stock Simulator.
Fast and responsive charts simplify market research.
UI perfectly aligned with the website's native design.
The suite includes essential financial analysis tools.
Various TradingView widgets enhanced the overall setup.


“ The integration enhanced our offering even further, providing more tools for succeeding in the financial markets.
Integration details
Trading Platform is the foundation for the IBKR platforms.
Bespoke dark and light platform mode across all apps.
Seamless experience on multi-device setups.
Settings allow order placement with default presets.
Unique settings allow order placement with default presets.


All-around powerful charting for all needs
Get easy-to-integrate charts, bountiful in features, and take your platform to the next level.
Lightweight
Charts™
Jaw-dropping usability in a 45 KB package.
Advanced
Charts
Masterfully-crafted with expert traders in mind.
Trading
Platform
Fully-packed with features for technical analysis pros.
- Open source
- Size as a standard GIF
- Wrappers for iOS and Android
- Streaming updates for custom data
- Flexible styling
- 100+ pre-built most popular indicators
- 80+ smart drawing tools at your disposal
- Highly customizable
- Free with TradingView logo
- Additional chart types
- Trade right from the Chart
- 17 chart types
- Multiple chart layouts
- Ability to disable branding
- Watchlist
Frequently Asked Questions
Widgets are embeddable iframe objects that TradingView hosts. They contain data from TradingView and can be included in your site/app by copypasting a simple script. Libraries are components that you host on your servers, and connect them to your data through the API.
Our Advanced Chart library is a free, standalone solution that you can host on your own servers, even plug your own data into, plus integrate with your website + app. Meanwhile the Trading Platform library contains all of the above, but also has direct trading functionality, if it's needed.
At this time, we do not provide the Advanced Charts and the Trading Platform libraries for personal use, hobbies, studies, or testing. The licenses can be provided only to companies and/or individuals for use in public web projects and/or applications. However, you may utilize the Lightweight Charts™ for personal projects since it comes with an open-source Apache 2.0 license.
The library should be connected to the broker's back-end: both the data stream and order management (routing) system. You can trade right from the chart, and all you have to do to make this work is to implement your Broker API and plug it into the chart widget.
Advanced Charts should be used by technical specialists. This library requires advanced skills in JavaScript and deep knowledge of WEB protocols.
Lightweight Charts™ are open-source under the Apache 2.0 license. For other charting solutions we do not provide source code.
Documentation, bug tracker & examples for the charting libraries are on Github, accessible after you've been given access to the particular library repo itself. If you need more help, reach out to platforms@tradingview.com


