Bitcoin - Sell this upcoming pump! New Bear Flag - Target 74k!I am currently bullish on Bitcoin in the short term, and I believe Bitcoin will hit 96k, probably this week. The current price is around 91k, so this is definitely a good opportunity to sell or open a short position at 96k on futures because later this month/in January Bitcoin will most likely continue in a downtrend and hit 74k!
74k (74,508) is a significant swing low from April 2024. There is no doubt that a lot of retail traders have their stop losses placed exactly below this swing low. This acts like a strong magnet for huge institutions, hedge funds, and big banks (market makers). It's no longer a secret that Bitcoin's development and Bitcoin's price are completely controlled by these lizards. But let's take a look at the short-term prediction.
What we can see on the daily chart or on the 12h chart is a bear flag formation. This bear flag is so nice and almost textbook perfect! Inside the bear flag we have a WXY corrective pattern (3x ABC or 3x WXY). I think that this is a strong indication that the downtrend we see from the all-time high (126k) will likely continue in the next weeks.
Write a comment with your altcoin + hit the like button, and I will make an analysis for you in response. Trading is not hard if you have a good coach! This is not a trade setup, as there is no stop-loss or profit target. I share my trades privately. Thank you, and I wish you successful trades!
Community ideas

EURUSD I Daily CLS I Model 2- CountertrendHi friends, new range created. As always we are looking for the manipulation in to the key level around the range. Don't forget confirmation switch from manipulation phase to the distribution phase to make the setup valid. Stay patient and enter only after change in order flow. If price reaches Its model 2 we are targeting full range.
🧩 Complete process and Strategy explained 👇 Click Below
I promised myself I’d become the person I once needed the most as a beginner. Below are links to a powerful lessons I shared on Tradingview. Hope it can help you avoid years of trial and error I went thru.
📊 Sharpen your trading Strategy
⚙️ 100% Mechanical System - Complete Strategy
🔁 Daily Bias – Continuation
🔄 Daily Bias – Reversal
🧱 Key Level – Order Block
📉 How to Buy Lows and Sell Highs
🎯 Dealing Range – Enter on pullbacks
💧 Liquidity – Basics to understand
🕒 Timeframe Alignments
🚫 Market Narratives – Avoid traps
🐢 Turtle Soup Master – High reward method
🧘 How to stop overcomplicating trading
🕰️ Day Trading Cheat Code – Sessions
🇬🇧 London Session Trading
🔍 SMT Divergence – Secret Smart Money signal
📐 Standard Deviations – Predict future targets
🎣 Stop Hunt Trading
🧠 Level Up your Mindset
🛕 Monk Mode – Transition from 9–5 to full-time trading
⚠️ Trading Enemies – Habits that destroy success
🔄 Trader’s Routine – Build discipline daily
💪 Get Funded - $20 000 Monthly Plan
🛡️ Risk Management
🏦 Risk Management for Prop Trading
📏 Risk in % or Fixed Position Size
🔐 Risk Per Trade – Keep consistency
Adapt useful, reject useless add something specifically yours...
David Perk

USD/JPY - Interest Rate Ahead! (08.12.2025) 📝 Description FX:USDJPY
USD/JPY continues to respect the Bearish Channel Pattern, with price rejecting the upper boundary and failing to break the resistance zone. Combined with strong fundamentals—expected Fed rate cut and potential BoJ tightening—the setup favors downside movement.
A break and retest of intraday support confirms continuation toward lower channel targets.
📌 Trading Plan📉 Bearish Continuation
Entry Idea: Look for sells below 155.00 after confirmation
Target 1: 154.28 (1st Support)
Target 2: 153.94 (2nd Support / Channel Bottom)
Bearish Confirmation: Clean rejection from resistance zone + break below small retracement support
⚠️ Fundamental Updates (Today)
1️⃣ Federal Reserve Meeting
→ Markets widely expect a rate cut, weakening the USD.
2️⃣ Bank of Japan Rate Outlook
→ BoJ may increase interest rates, a JPY-strengthening factor.
Combined effect:
🔻 USD weak + 🔺 JPY strong → Bearish USD/JPY bias
⚠️ Disclaimer
This idea is for educational analysis only.
Not financial advice. Always trade with proper risk management.
👍 Support the Analysis❤️ LIKE the post💬 COMMENT your view🔁 SHARE to help others
Your support motivates more high-quality analysis! 🙌
#USDJPY #ForexTrading #BearishSetup #ChannelPattern #TechnicalAnalysis #FundamentalAnalysis #JPY #USD #FXMarket #TradingView #PriceAction #Kabhi_TA_Trading

Bitcoin: Critical Levels Ahead, $106k or $65kHi guys!
The current BTC structure displays a textbook Three Drives Pattern, followed by visible momentum weakness. After the first, second, and third drives completed, price failed to create higher highs, confirming exhaustion. This aligns with the RSI divergence, which began forming during the second and third drives.
Price has now pulled back into a key decision zone. Two scenarios stand out:
Bullish Scenario
If BTC breaks and sustains above 94,393 USD, it would signal renewed strength. This could trigger a continuation toward the upper supply zone around 105,000–110,000 USD, where previous rejection occurred.
Bearish Scenario
Failure to break higher and instead falling below 82,000–83,000 USD opens the path toward deeper retracement. A breakdown confirms the distribution phase after the three drives, exposing the broader support area near 74,500 USD and potentially down to 65,445 USD, which aligns with historical demand.
Disclaimer: As part of ThinkMarkets’ Influencer Program, I am sponsored to share and publish their charts in my analysis.

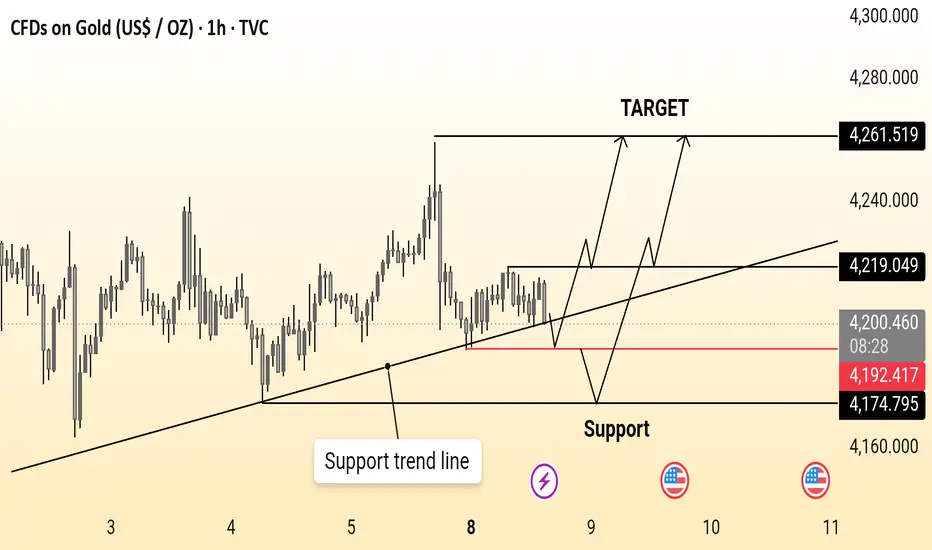
Gold ideaGold (1H) is holding above a rising support trend line, maintaining a bullish structure. As long as price stays above the 4,174–4,192 support zone, a move toward 4,261 remains likely.
GOLD 1H CHART ROUTE MAP UPDATE & TRADING PLAN FOR THE WEEKHey Everyone,
Please see our 1h chart levels and targets for the coming week, which is still active and in play.
We are seeing price play between two weighted levels with a gap above at 4221 and a gap below at 4169, as support. We will need to see ema5 cross and lock on either weighted level to determine the next range.
We will see levels tested side by side until one of the weighted levels break and lock to confirm direction for the next range.
We will keep the above in mind when taking buys from dips. Our updated levels and weighted levels will allow us to track the movement down and then catch bounces up.
We will continue to buy dips using our support levels taking 20 to 40 pips. As stated before each of our level structures give 20 to 40 pip bounces, which is enough for a nice entry and exit. If you back test the levels we shared every week for the past 24 months, you can see how effectively they were used to trade with or against short/mid term swings and trends.
The swing range give bigger bounces then our weighted levels that's the difference between weighted levels and swing ranges.
BULLISH TARGET
4221
EMA5 CROSS AND LOCK ABOVE 4221 WILL OPEN THE FOLLOWING BULLISH TARGETS
4250
EMA5 CROSS AND LOCK ABOVE 4250 WILL OPEN THE FOLLOWING BULLISH TARGETS
4284
EMA5 CROSS AND LOCK ABOVE 4284 WILL OPEN THE FOLLOWING BULLISH TARGETS
4320
EMA5 CROSS AND LOCK ABOVE 4320 WILL OPEN THE FOLLOWING BULLISH TARGETS
4361
BEARISH TARGETS
4169
EMA5 CROSS AND LOCK BELOW 4169 WILL OPEN THE SWING RANGE
4130
4093
EMA5 CROSS AND LOCK BELOW 4093 WILL OPEN THE SECONDARY SWING RANGE
4049
4015
As always, we will keep you all updated with regular updates throughout the week and how we manage the active ideas and setups. Thank you all for your likes, comments and follows, we really appreciate it!
Mr Gold
GoldViewFX

BTCUSDT Long: Demand Line Holds — Path Toward 96,500 Opens UpHello, traders! BTCUSDT is respecting the Triangle Demand Line after completing a full bearish cycle inside the descending channel earlier. Sellers maintained control for an extended period, pushing price steadily lower until it reached the pivot point near 88,800, where buyers finally stepped in and broke the bearish structure. This pivot zone became the foundation for a new bullish sequence, with price forming higher lows along the Triangle Demand Line. After the breakout from the descending channel, BTCUSDT entered a consolidation Range, where multiple fake breakouts occurred on both sides. This range acted as a transition phase before buyers regained momentum. Following the range, price made another bullish attempt, but faced resistance near the 96,500 Supply Zone — an area where sellers have shown strong activity in the past.
Currently, BTCUSDT is moving toward the Triangle Demand Line once again, retesting it as support. As long as buyers defend this trendline and price remains above the Demand Zone at 88,800, the bullish structure stays intact.
My scenario: if the trendline holds, BTCUSDT may bounce and continue moving toward the 96,500 resistance, which remains the main upside target for the current bullish leg. A clean breakout above 96,500 would open the path for stronger continuation. However, if price fails to hold the demand line, a corrective pullback toward the lower demand region becomes possible. For now, the market structure remains bullish while price respects the Triangle Demand Line. Manage your risk!

XAUUSD: Buying Pressure Aims for the $4,260 ResistanceHello everyone, here is my breakdown of the current Gold (XAUUSD) setup.
Market Analysis
Gold continues to trade within a broader bullish structure, with price action developing inside a well-defined ascending channel. After the previous impulse move higher, the market entered a consolidation phase below the $4,260 Resistance Zone, where sellers repeatedly defended the level. Earlier, XAUUSD produced a breakout from the upward channel structure and formed a temporary base above the mid-support area near $4,200, confirming that buyers still control the broader trend.
Currently, price is holding above the Triangle Support Line, showing that demand remains active on dips. The recent pullback into the $4,200–$4,190 support area looks corrective rather than impulsive, suggesting that bearish pressure remains limited for now. As long as price stays above this triangle support, the bullish market structure remains valid.
My Scenario & Strategy
My scenario is bullish while XAUUSD holds above the $4,200 Support Zone and respects the Triangle Support Line. I expect price to stabilize in this area and attempt a renewed push toward the $4,260 Resistance Zone, which is the key barrier for continuation.
Therefore, a clean breakout above $4,260 would confirm bullish continuation and open the door for further upside expansion toward higher historical levels. However, if price fails to hold the triangle support and breaks below $4,190–$4,180, this would weaken the bullish structure and could trigger a deeper corrective pullback toward the lower channel boundary. For now, the market maintains a long bias, with the main objective being a renewed test and potential breakout of the $4,260 resistance zone.
That’s the setup I’m tracking. Thank you for your attention, and always manage your risk.

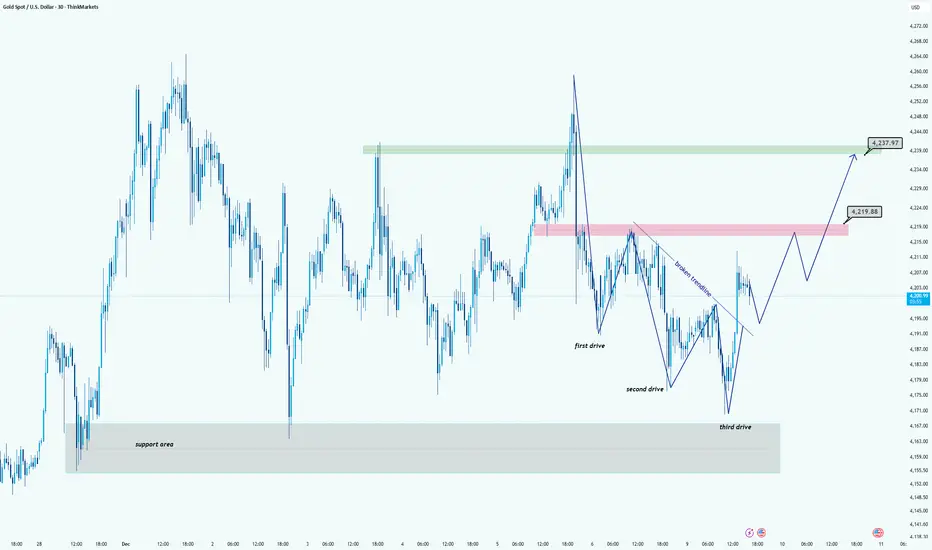
XAUUSD (GOLD) Trend Shift Confirmed After Third Drive ReactionHi!
Gold has completed a clear Three-Drive Reversal pattern, with the third drive tapping into the major support zone around 4165–4175. This area has repeatedly acted as a strong demand pocket, and the sharp reaction confirms buyers are still active. Following the third drive, price broke the minor descending trendline, signaling the first shift in short-term momentum.
Current Structure
After breaking the trendline, price is now forming a healthy sequence of higher lows. The next key area is the mid-range supply zone at 4215–4220 (highlighted in red). A controlled pullback into higher-low structure would maintain bullish pressure and build the base for continuation.
Upside Targets
If buyers successfully reclaim the 4215–4220 zone, the next major target sits at the 4237–4240 resistance (green zone). This aligns with the next liquidity cluster and previous strong reaction points.
⚠️ Validation
The bullish scenario remains valid as long as price holds above the structure created after the third drive. A heavy rejection back below the support zone would invalidate the setup.
Disclaimer: As part of ThinkMarkets’ Influencer Program, I am sponsored to share and publish their charts in my analysis.
The Market Awaits the Fed to Set the TrendHi everyone, Domic here again.
On the chart, ETH is still holding its short-term uptrend as the 34 EMA (red) remains above the 89 EMA (blue), but the bullish momentum has clearly slowed down. Price is hovering just above both EMAs without forming any widening angle, while the EMAs themselves are being squeezed — a classic signal that the market is losing momentum, moving sideways, and waiting for new catalysts. The declining volume further confirms that buying pressure is no longer strong enough to push ETH decisively toward the 3,150–3,200 zone. This explains why, despite the uptrend remaining intact, ETH is “waiting” rather than accelerating.
On the news side, ETH is directly influenced by upcoming macro events:
The Fed meeting on December 9–10 is the key driver, and crypto markets typically go quiet ahead of such events to await direction.
Meanwhile, the DXY is weak and moving below the 100 level, but volatility is low — not enough to trigger a strong risk-on wave across crypto.
At the same time, speculation around a potential Ethereum spot ETF continues, but without any confirmation from the SEC, expectations exist — yet large capital remains cautious.
Based on these factors, I expect ETH to continue consolidating or potentially pull back to retest the 3,060–3,080 zone before showing a clearer reaction after the Fed meeting.

THE KOG REPORTTHE KOG REPORT:
In last week’s KOG Report we said we would look for the price to tap into the lower level where we wanted a bounce to then target the red box above. We managed to get that long into the defence level for it to give us a nice tap and bounce again giving the short and following the path into the lower defence box. It’s here that we faced the range but as you can see we failed to breach the box, hence giving us that opportunity to target that long into the active defence above again.
We then mentioned we would protect and manage and see if there is another reaction or breach at that box, leading to price rejecting again following the range and completing all our targets as well as the hot spots for the week.
A successful week in Camelot not only on Gold but also the other pairs we trade and analyse.
So, what can we expect in the week ahead?
For the start of the trading week we have two key levels to keep an eye on, 4175 support and 4210 resistance. These are the levels that need to be broken either side in order to make the next move, and could be the range we play for Monday as there is no economical catalyst to bring the extra volume into the market.
For that reason, we’ll stick with the plan from last week, apart from looking for price to create that higher high before attempting the lower defence level.
There is strong support here on the close so if we can get an undercut low here we can bounce into that 4210 level and above that 4220 which is the level that will need to hold! As long as we can stay below, we should see price attempt the lower levels initially starting with our target level 4180 and below that 4155.
As you can see on our chart, our ideal long opportunity comes from the lower level which is also our potential target and a region we would like to see a RIP!
The levels are on the chart as our the red boxes which have proven to be effective for swing and intra-day trading.
RED BOXES:
Break above 4210 for 4220, 4230, 4235 and 4240 in extension of the move
Break below 4190 for 4180, 4173, 4165, 4155 and 4147 in extension of the move
Please do support us by hitting the like button, leaving a comment, and giving us a follow. We’ve been doing this for a long time now providing traders with in-depth free analysis on Gold, so your likes and comments are very much appreciated.
As always, trade safe.
KOG

XAUUSD (Gold) Next Buying Move Analysis Quick Analysis (XAUUSD / Gold)
Price recently pulled back into a marked support zone (the blue highlighted area).
The chart suggests bullish continuation, with two possible upward paths drawn.
As long as price stays above the support zone, the idea points toward a move up toward the marked target area.
Support Zone
Price is expected to bounce from this level. If it breaks below, the bullish setup weakens.
Target Zone
The purple box shows the projected upside 4350 Target.
Summary
Idea: Buy-from-support continuation.
Wait for a confirmed bounce from support → aim for the target zone → watch for any break below support.
❤️ please support with Boost and Comment I will be Glad ❤️

Gold Bear Flag Ready for a Bullish BreakoutHello everyone, Helene here! XAUUSD is currently showing a more positive outlook as price structure starts shifting into a bullish direction.
The latest market interaction is particularly interesting. We’re seeing an early recovery phase, weakening bearish momentum, and low-volume candles suggesting seller exhaustion. This often acts as an early signal for a potential bullish move developing.
Based on the current pattern, my target is around 4,330 – a reasonable level aligned with the market structure. Should price continue in this direction, the next move could become a beautiful extension of the bullish story in Gold we’ve been following.
This setup looks very appealing. It’s a developing scenario, although it still requires patience and proper confirmation before fully validating the upside.
Even though a bearish scenario is still possible due to the clear support zone below, I personally lean toward additional bullish continuation as the pattern forming here supports that outlook.
Wishing you a successful trading session and the best of luck.

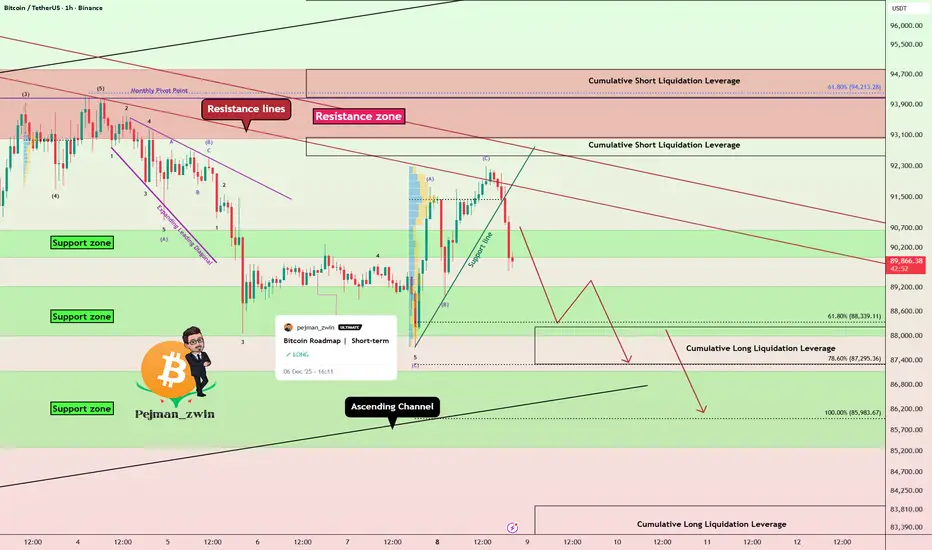
Bitcoin Breakdown After Perfect Bounce — Short Setup LoadingAs I expected , Bitcoin bounced from the support zone and reached its targets.
Right now, Bitcoin has rejected from resistance lines and successfully broke both the support line and the support zone($90,650-$90,000).
From an Elliott Wave perspective, it appears that Bitcoin has completed a ZigZag structure, and we should now anticipate the start of a bearish wave sequence.
The S&P 500 index( SP:SPX ) also shows a bearish outlook, and given Bitcoin’s correlation with SPX, further downside in BTC is not surprising.
At the same time, USDT.D%( CRYPTOCAP:USDT.D ) has turned bullish again—at least in the short term—which can add additional pressure on Bitcoin.
I expect Bitcoin to continue its downward movement, at least toward the next support zone($87,140-$85,290) and the lower line of the ascending channel.
Note: It’s better to wait for a bullish correction before entering, and then take a short position according to your own strategy.
Cumulative Short Liquidation Leverage: $98,260-$96,690
Cumulative Short Liquidation Leverage: $93,040-$92,560
Cumulative Long Liquidation Leverage: $94,840-$94,100
Cumulative Long Liquidation Leverage: $83,900-$82,400
Target: $87,733
Stop Loss(SL): $92,723(Worst)
Points may shift as the market evolves
💡 Please respect each other's opinions and express agreement or disagreement politely.
📌Bitcoin Analysis (BTCUSDT), 1-hour time frame.
🛑 Always set a Stop Loss(SL) for every position you open.
✅ This is just my idea; I’d love to see your thoughts too!
🔥 If you find it helpful, please BOOST this post and share it with your friends.
EURUSD Rising Channel Intact as Price Targets 1.16800 ResistanceHello traders! Here’s my technical outlook on EUR/USD based on the current market structure. After an earlier breakout from the lower consolidation area, the price entered a steady ascending channel, forming a sequence of higher highs and higher lows while respecting the rising Support Line. The previous bullish impulse was followed by a corrective phase, where EURUSD consolidated inside the marked range, allowing the market to release pressure before continuing higher. After the range breakout, the pair resumed its upward movement and is now trading inside a new rising price channel. At the moment, price is holding above the 1.16400 support level, which is acting as a key demand area and the lower boundary of the current ascending structure. Buyers continue to defend this zone, keeping the short-term bullish bias intact. The market is now pressing toward the major 1.16800 resistance level, which aligns with the upper channel boundary and serves as the next critical obstacle for the bulls. As long as EURUSD remains above the 1.16400 support, the bullish scenario stays valid. I expect a continuation toward the TP1 target at 1.16800, where strong seller reaction is likely. A clean breakout above this resistance could open the door for further upside continuation. However, a failure to hold the current support may lead to a deeper pullback toward the lower channel area. For now, the structure favors buyers, with resistance at 1.16800–1.17000 as the main upside objective. Please share this idea with your friends and click Boost 🚀

09.12.25 Daily ForecastPairs on Watch -
FX:GBPCAD
FX:AUDCAD
FX:EURGBP
A short overview of the instruments I am looking at for today, multi-timeframe analysis down to what I will be looking at for an entry. Enjoy!

Alphabet - The exceptional short setup!🔒Alphabet ( NASDAQ:GOOG ) is reversing right now:
🔎Analysis summary:
Alphabet is clearly indicating a major bearish move. With the current retest of major resistance, Alphabet is slowly reversing. Since Alphabet is also massively overextended, really everything is pointing towards a move lower. Just give it a couple of days to reverse.
📝Levels to watch:
$300
SwingTraderPhil
SwingTrading.Simplified. | Investing.Simplified. | #LONGTERMVISION

BTCUSD Buyers Defend Support — Market Targets $91,5K — $93K ZoneHello traders! Here’s my technical outlook on BTC/USD based on the current market structure. After a strong bullish recovery from the lower demand area near $83,500–$85,000, the price formed a steady impulsive move upward and entered a consolidation phase inside the marked range below the key $93,000 resistance level. Multiple breakout attempts from the range were followed by corrective pullbacks, showing active participation from both buyers and sellers. Once BTC broke above the range, the price initiated another bullish leg but quickly transitioned into a symmetrical triangle structure, defined by the descending Triangle Resistance Line and the rising Triangle Support Line. Currently, BTC is compressing inside this triangle while holding above the critical $89,500 Support Level, which is acting as the main short-term demand zone. Buyers continue to defend this area, keeping the bullish bias technically valid. The price is now approaching the upper triangle resistance again, hinting at a possible volatility expansion. As long as BTC remains above $89,500, the bullish scenario stays in play. I expect a breakout from the triangle toward TP1 at $91,500, followed by a potential continuation toward TP2 at $93,000, which is the major resistance zone. However, a breakdown below the triangle support would invalidate the setup and may trigger a deeper corrective move. For now, the market remains in a compression phase, preparing for its next directional impulse. Please share this idea with your friends and click Boost 🚀

XAUUSD Reversal Zone Targets 4250📊 Gold (XAUUSD) Analysis
Gold has bounced strongly from the lower support zone and is now reclaiming structure after breaking out of the previous consolidation block. Price is currently stabilizing around 4195–4200, showing exhaustion from the earlier sell-off.
The key level to watch is 4220, which acts as the bullish flip zone:
✔ Above 4220 → Buyers gain control
✔ Clean path toward 4250
✔ Breakout retest structure matches your projection
Once 4220 is secured as support, momentum is likely to push toward the 4250 resistance, which aligns with the chart’s mapped target zone.
---
🎯 Bullish Outlook
First confirmation: Break & close above 4220
Main target: 4250

Big Week for USD: USDJPY Approaches Major Sell Zone!Hey Traders,
In today's trading session we are monitoring USDJPY for a selling opportunity around the 155.750 zone. USDJPY is trading in a downtrend and is currently in a correction phase, approaching the trend area at 155.750, which acts as a key support-turned-resistance level.
On the fundamental side, recent U.S. data continues to support a weaker Dollar as markets increasingly price in a 25bps cut heading into the FOMC. With traders front-running the event, USD momentum remains fragile. If the market over-prices the move ahead of Wednesday, be cautious of the classic "buy the rumor, sell the fact" dynamic.
This broader Dollar softening environment supports further downside in USDJPY as long as the pair remains below the trend structure.
Trade safe,
Joe.

Emotional Patterns: What Your Trades Reveal About YouTrading feels technical on the surface, yet the deeper layer is psychological. Charts highlight opportunities, but the way you behave inside those opportunities shapes the outcome. Each trade reflects how you respond to pressure, uncertainty, and risk. Over time, these reactions create emotional patterns that influence results more than strategy.
One early pattern appears after a loss. A losing trade often triggers frustration, and that frustration pushes traders into fast entries aimed at regaining control. The decision becomes driven by emotion rather than process, and this behaviour can quickly lead to a cycle of overtrading.
Winning streaks create a different pattern. Confidence expands, and many traders begin increasing size, loosening rules, or entering before confirmation because recent success feels reassuring. This overextension usually leads to sharp setbacks when the market shifts.
Another frequent pattern is hesitation. Traders with inconsistent execution tend to freeze at key moments. They wait for additional confirmation, delay entries, or watch clean setups move without them. The pause often comes from the memory of previous mistakes rather than a lack of technical understanding.
Entries reflect trust in the system. Exits reflect trust in personal decision-making. Closing a trade too early often shows discomfort with open profit. Holding a losing trade too long often comes from discomfort with accepting a loss. These behaviours reveal the trader’s relationship with risk far more clearly than any written reflection. The chart becomes a mirror.
Recognising emotional patterns provides clarity. When recurring behaviours appear—chasing, hesitating, forcing trades, avoiding losses—they become easier to interrupt. Once a pattern is visible, it starts losing influence.
Structure then supports the change: rules, checklists, routines, and clear confirmation criteria. These elements stabilise execution and reduce the impact of emotional impulses.
A strategy defines potential entries, but emotional patterns determine whether the trader can execute consistently enough to benefit from it. Awareness strengthens decision-making. When you understand what your trades reveal about your behaviour, you can adjust it and bring execution closer to intention.
This is where consistency begins.

Gold 1H – Will 4210 Reject Again or 4166 Ignite the Rally?🟡 XAUUSD – Intraday Smart Money Plan | by Ryan_TitanTrader (09/12)
📈 Market Context
Gold continues to soften under $4,200 as rising US Treasury yields pressure bullion, with markets positioning ahead of the upcoming Federal Reserve rate decision.
According to FXStreet, yields climbing intraday are capping gold’s upside, and sellers remain active below 4200 while participants wait for clarity on the Fed’s forward guidance.
This environment builds a liquidity-sensitive landscape, where institutions may engineer sweeps on both sides before committing to direction.
On H1, price oscillates cleanly between premium supply (4208–4210) and discount demand (4168–4166).
A valid push requires MSS → BOS → displacement from either extreme.
🔎 Technical Framework – Smart Money Structure (1H)
Current Phase: Sideways compression after consecutive CHoCH shifts
Key Idea: Expect liquidity grabs above 4210 or under 4166 before real movement
Liquidity Zones & Triggers
• 🔴 SELL GOLD 4208 – 4210 | SL 4218
• 🟢 BUY GOLD 4168 – 4166 | SL 4158
Institutional Flow Expectation:
sweep → MSS/CHoCH → BOS → displacement → FVG/OB retest → expansion
🎯 Execution Rules (matching your exact zones)
🔴 SELL GOLD 4208 – 4210 | SL 4218
Rules:
✔ Price taps premium zone (4208–4210)
✔ Bearish MSS/CHoCH confirmed on M5–M15
✔ Strong downside BOS + displacement
✔ Enter on FVG fill or refined supply OB retest
Targets:
1. 4185
2. 4175
3. 4168 – 4166
🟢 BUY GOLD 4168 – 4166 | SL 4158
Rules:
✔ Sweep under 4167 to collect sell-side liquidity
✔ Bullish MSS/CHoCH forms from discount
✔ Clean BOS + impulsive displacement upward
✔ Entry via bullish FVG fill or demand OB retest
Targets:
1. 4184
2. 4200
3. 4210
⚠️ Risk Notes
• Rising yields may generate deceptive spikes—avoid entries without BOS + displacement
• Do not chase price inside the compression range
• Keep SLs at structural invalidation, not arbitrary points
• Reduce exposure ahead of Fed-related volatility this week
📍 Summary
Today’s setup revolves around two institutional scenarios:
• A 4210 liquidity sweep triggers bearish structure → downside delivery toward 4166
or
• A 4166 liquidity grab forms bullish MSS → upside expansion back toward 4210
Let structure confirm.
Patience pays the trader—SMC reacts, never predicts. ⚡️
📌 Follow @Ryan_TitanTrader for daily Smart Money breakdowns.

GOLD → Price within range ahead of Fed meeting FX:XAUUSD is consolidating within a wide range amid expectations of the Fed's interest rate meeting. The fact that interest rates will be lowered has most likely already been factored in by the market. There is a possibility of a long squeeze...
New threats of tariffs by Trump (on fertilizers from Canada and against Mexico) are weakening the dollar and supporting gold.
As for interest rates, the Fed is expected to cut rates by 25 basis points, but the market has most likely already priced in the cut. Accordingly, there may be countertrend movements (MM traps) to accumulate liquidity before further advances.
Today's JOLTS data on job vacancies may cause increased volatility. According to statistics, before and after interest rate cuts, gold forms a swing correction, within which it may test the support of the range against the backdrop of a bullish trend...
Resistance levels: 4219.5, 4256
Support levels: 4200, 4180, 4163
Ahead is a strong liquidity zone at 4220, and the retest may end in a decline. MM may continue to accumulate liquidity before further advancement. I expect a retest of the range support with the aim of retesting the liquidity pool at 4175-4165 before a possible rise.
Best regards, R. Linda!
