Silver just hit a record high but a double‑top signals pullback!After a strong rally to new records spurred by safe-haven demand and new entrants, silver is now testing critical support levels near $47‑$48 amid the recent Gaza ceasefire news, forming a classic double‑top pattern that may turn into a long-term Cup & Handle that could place price action in a handle pattern for the years to come.
🔑 Key Drivers (Silver‑focused)
Technical breakout : Price breached $51, approaching the 161.8 % Fibonacci level at $47.50.
Double‑top formation : A clean double‑top suggests a near‑term correction could be on the way.
Support zone : The $47‑$48 area acts as the next major support; a break below could open the door to $45‑$46 levels.
Fibonacci retracement : The 61.8% retracement sits around $49.30, providing a potential bounce point before any deeper pullback.
Want the latest silver analyses, alerts on breakouts, and detailed chart breakdowns?
Subscribe, like, and hit the notification bell – then share in the comments your silver trade setup or questions!
This content is not directed to residents of the EU or UK. Any opinions, news, research, analyses, prices or other information contained on this website is provided as general market commentary and does not constitute investment advice. ThinkMarkets will not accept liability for any loss or damage including, without limitation, to any loss of profit which may arise directly or indirectly from use of or reliance on such information.
Community ideas

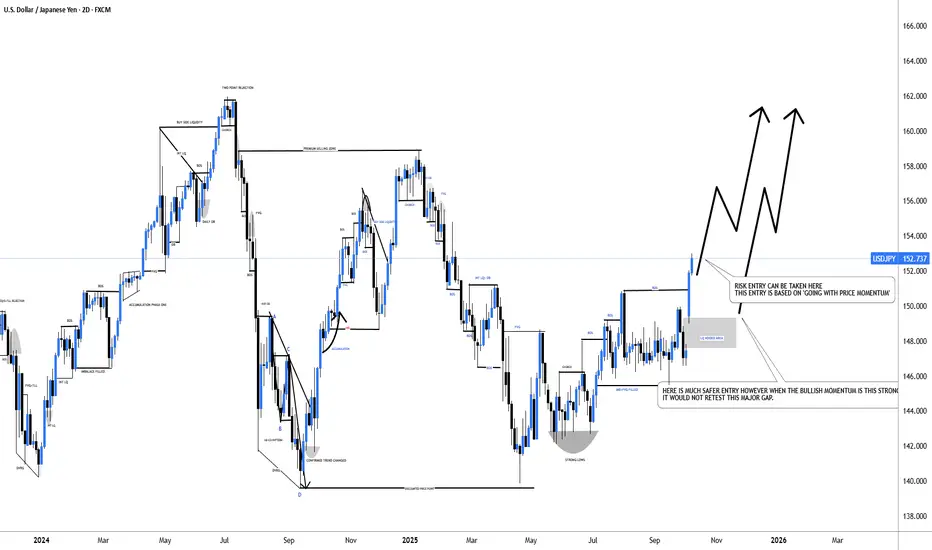
#USDJPY: From +1100 Pips To +1350 Pips A Possible Swing BuyDear Traders,
I hope you’re all having a great trading week!
The USDJPY is currently trading in a 152 price range and is experiencing extreme bullish momentum. The price is rallying without making any corrections, primarily due to the collapse of the Yen. We may see it fall further below. Given this market condition, it’s much riskier to trade with USDJPY.
Here are two approaches you may consider:
1. Take the entry at the current trading price with an accurate stop loss while using a smaller timeframe.
2. Wait for the price to return to the liquidity gap area, where it’s expected to fill.
Good luck, and thank you for your support throughout.
We appreciate your support.
Team Setupsfx_
NZD/USD Rate Drops Sharply After Central Bank DecisionNZD/USD Rate Drops Sharply After Central Bank Decision
This morning, the Reserve Bank of New Zealand (RBNZ) cut its key interest rate. According to Forex Factory, the Official Cash Rate was reduced by 50 basis points from 3.0% to 2.5%, while most analysts had expected a smaller cut to 2.75%.
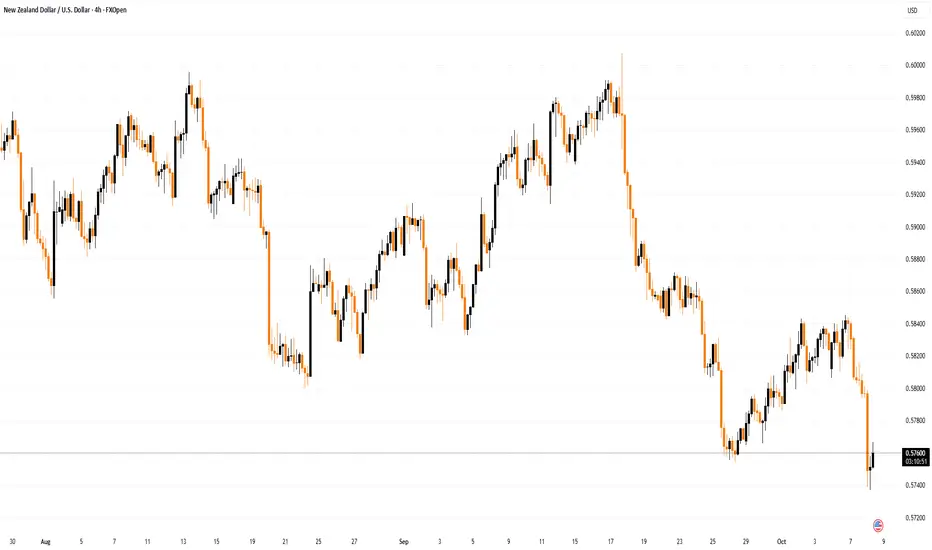
Moreover, the RBNZ signalled the prospect of further easing following a recent deterioration in economic data. The decisive move caught traders off guard and led to heightened volatility. As shown on the NZD/USD chart, the New Zealand dollar has fallen to its lowest level against the US dollar since mid-April.
The downward momentum has been reinforced by the strengthening of the US dollar — possibly as investors grow more cautious over a potential government shutdown, prompting them to move into cash.
Technical analysis of the NZD/USD chart
Movements in the kiwi’s exchange rate during the second half of 2025 have formed a descending channel on the chart. Notably, peak F:
→ only slightly exceeds the previous high D;
→ lies above the psychological 0.6000 level;
→ developed with a long upper wick, consistent with the Upthrust (UTAD) pattern described in Wyckoff methodology.
This appears to be a strategic false breakout above the lower-high structure, paving the way for a decline towards the autumn lows and a breakout below the corrective pattern (shown in blue).
From a bearish perspective:
→ the channel’s median line acts as resistance (as shown by the arrows);
→ today’s drop signals an imbalance favouring sellers, forming the basis for a Fair Value Gap resistance zone.
Meanwhile, bulls may hope the lower boundary of the channel once again acts as support in 2025, providing momentum for a rebound within the channel. For this scenario to play out, however, the news backdrop would need to shift. For now, the NZD/USD chart points to bearish dominance — with a potential move down towards the 0.5700 level.
This article represents the opinion of the Companies operating under the FXOpen brand only. It is not to be construed as an offer, solicitation, or recommendation with respect to products and services provided by the Companies operating under the FXOpen brand, nor is it to be considered financial advice.
Netflix Is -11% Since June's All-Time High. What Its Chart SaysNetflix NASDAQ:NFLX has fallen more than 10% since hitting an all-time high in June, but the streaming giant is still beating the S&P 500 SP:SPX in the year-to-date, one-year and five-year periods. What does technical and fundamental analysis say is going on?
Let's take a look:
Netflix's Fundamental Analysis
NFLX has shed some 11% as of Tuesday afternoon since peaking at $1,341.15 intraday on June 30, easing especially over the four weeks despite little news.
The only recent negative catalyst came last week, when Citigroup analyst Jason Bazinet (rated at five stars out of a possible five by TipRanks) cut the stock's price target to $1,280 from a previous $1,295. Bazinet also reiterated Netflix's "Neutral" rating, which is considered a "hold-equivalent."
Still, the Citi analyst's $1,280 price target represents about a 7.5% move to the upside from where NFLX was trading at Tuesday afternoon.
Meanwhile, Wall Street expects Netflix to report Q3 results in some two weeks (on or about Oct. 21). The Street is looking for the firm to report $6.95 in adjusted earnings per share on about $11.5 billion of revenue.
If those numbers end up being accurate, that would compare favorably with the year-ago period, with a 28.7% gain from the $5.40 in adjusted EPS that NFLX reported in Q3 2024. Revenues would also have risen 17.3% from the $9.8 billion that Netflix saw a year earlier.
In fact, of the 33 sell-side analysts that I know of that cover Netflix, 27 have increased their earnings estimates since the current quarter began. Just five have cut their forecasts, while one estimate remains unchanged.
Netflix's Technical Analysis
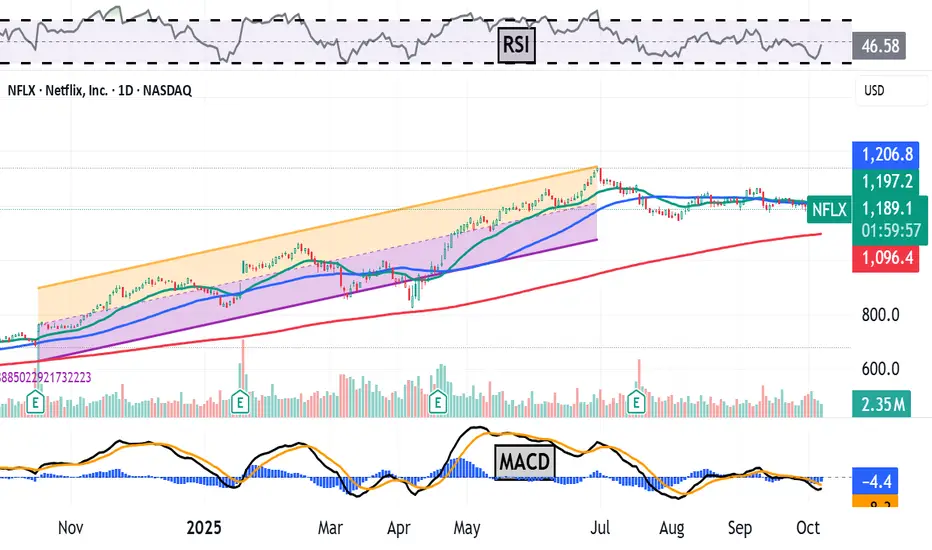
NFLX's one-year chart through Thursday afternoon was telling an interesting story:
Readers will see that the stock benefited from an upward sloping trend that stretched from Autumn 2024 into Summer 2025, as marked with orange and purple fields in the chart above.
This trend ended with NFLX peaking on June 30, with a new trend born the next day. The stock has generally pulled back since July 1 while creating a "falling-wedge" pattern, which is historically a sign of bullish reversal.
Netflix's upsides in the above pattern are the stock's 21-day Exponential Moving Average (or "EMA," marked with a green line) and its 50-day Simple Moving Average (or "SMA," denoted by a blue line). These two lines are running together, so I'll view them as a single pivot.
Now let's zoom in and look at Netflix's chart over just the past eight months:
I've added a "double-bottom" pattern to the above chart above using dotted lines. That's a second pattern of bullish reversal, and it exists inside of Netflix's falling wedge.
Granted, the stock's recent sell-off still has to find support around here. But if it does, NFLX will have just developed two simultaneous bullish patterns.
The double bottom would have a $1,268 pivot, which would be about $60 above the moving averages that we just mentioned. This pivot could produce considerably higher price targets for the stock.
That said, Netflix's other technical indicators above don't agree with such bullishness, or at least don't agree with it just yet.
For example, the stock's Relative Strength Index (the gray line at the chart's top) is relatively weak.
Similarly, Netflix's daily Moving Average Convergence Divergence indicator (or "MACD," marked with gold and black lines and blue bars at the chart's bottom) is close to neutral, as well as closer to bearish than bullish.
The 9-day EMA (the blue bars) is in negative territory, although not far from zero bound. Both the 12-day EMA (the black line) and 26-day EMA (the gold line) are also below zero, with the black line below the gold line. All three of these conditions are typically short- to medium-term bearish signals.
An Options Option
Options traders who want to get NFLX at a "discount" (and get paid to wait for it to potentially go higher) might consider a bull-put spread. This strategy is set up by selling a put while also buying a second put with a lower strike price.
Here's an example:
-- Sell (write) one Oct. 24 NFLX $1,140 put for about $45. This option could expire after Netflix reports earnings.
-- Buy one Oct. 24 NFLX $1,110 put for about $32.
Net Credit: $13
Traders in the above example would pay $1,140 a share for NFLX if forced to buy the stock due to assignment of the short put. However, their net basis would be $1,127 after deducting the net premium collected.
These traders also purchased some downside protection at $1,110 with the second put.
All in, that represents a maximum $30-per-share loss -- the $1,140 strike price on the first put minus the $1,110 strike price on the second.
However, the $13 net premium traders would collect on the entire bull-put spread would reduce the above strategy's maximum theoretical loss to $17 a share at expiration.
(Moomoo Technologies Inc. Markets Commentator Stephen "Sarge" Guilfoyle had no position in NFLX at the time of writing this column.)
This article discusses technical analysis, other approaches, including fundamental analysis, may offer very different views. The examples provided are for illustrative purposes only and are not intended to be reflective of the results you can expect to achieve. Specific security charts used are for illustrative purposes only and are not a recommendation, offer to sell, or a solicitation of an offer to buy any security. Past investment performance does not indicate or guarantee future success. Returns will vary, and all investments carry risks, including loss of principal. This content is also not a research report and is not intended to serve as the basis for any investment decision. The information contained in this article does not purport to be a complete description of the securities, markets, or developments referred to in this material. Moomoo and its affiliates make no representation or warranty as to the article's adequacy, completeness, accuracy or timeliness for any particular purpose of the above content. Furthermore, there is no guarantee that any statements, estimates, price targets, opinions or forecasts provided herein will prove to be correct.
The Analyst Ratings feature comes from TipRanks, an independent third party. The accuracy, completeness, or reliability cannot be guaranteed and should not be relied upon as a primary basis for any investment decision. The target prices are intended for informational purposes only, not recommendations, and are also not guarantees of future results.
Options trading is risky and not appropriate for everyone. Read the Options Disclosure Document ( j.moomoo.com ) before trading. Options are complex and you may quickly lose the entire investment. Supporting docs for any claims will be furnished upon request.
Options trading subject to eligibility requirements. Strategies available will depend on options level approved.
Maximum potential loss and profit for options are calculated based on the single leg or an entire multi-leg trade remaining intact until expiration with no option contracts being exercised or assigned. These figures do not account for a portion of a multi-leg strategy being changed or removed or the trader assuming a short or long position in the underlying stock at or before expiration. Therefore, it is possible to lose more than the theoretical max loss of a strategy.
Moomoo is a financial information and trading app offered by Moomoo Technologies Inc. In the U.S., investment products and services on Moomoo are offered by Moomoo Financial Inc., Member FINRA/SIPC.
TradingView is an independent third party not affiliated with Moomoo Financial Inc., Moomoo Technologies Inc., or its affiliates. Moomoo Financial Inc. and its affiliates do not endorse, represent or warrant the completeness and accuracy of the data and information available on the TradingView platform and are not responsible for any services provided by the third-party platform.
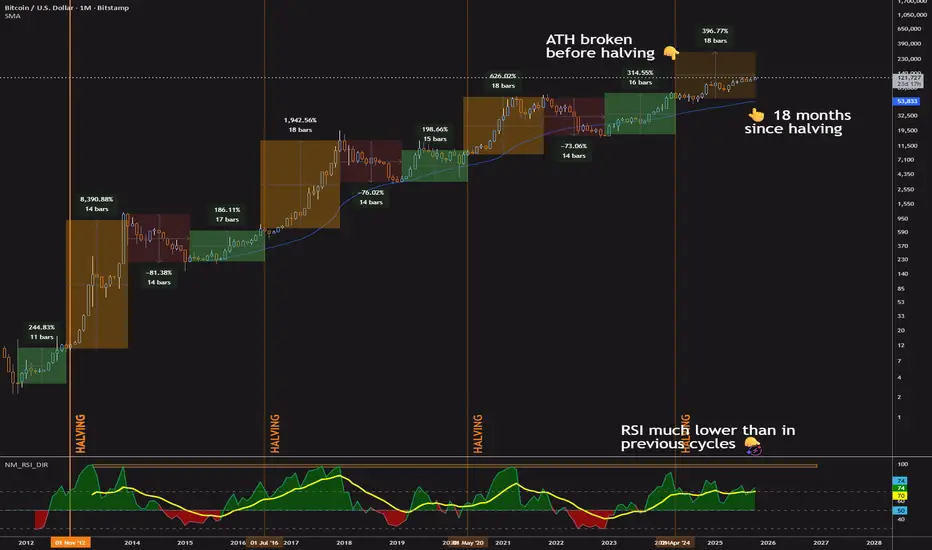
Is Bitcoin's 4-Year Cycle Over? Bitcoin’s 4-year cycle has been a go-to for traders, driven by halving events that spark price surges, sharp corrections, and recovery periods. But something’s off this time.
We’re 18 months into the post-2024 halving rally—hitting the historical peak for bull runs—yet there’s no sign of a crash, and the monthly RSI isn’t screaming overbought like in past cycles.
Instead, we’re seeing a slower, steadier climb that could keep going. The traditional cycle may be fading, and the shift from retail traders to institutional investors is the biggest driver.
❓ What Is Bitcoin’s 4-Year Cycle?
Bitcoin’s halving happens roughly every four years (or 210,000 blocks), cutting the reward miners get for adding new blocks in half. This reduces new bitcoin supply, often driving prices up if demand holds. The cycle typically has four stages:
Pre-Halving Rally: Prices rise in the months before the halving as anticipation builds.
Post-Halving Bull Run: After the halving, prices surge, often hitting new highs.
Bear Market: The rally fades, leading to a sharp correction.
Accumulation Phase: Prices stabilize at lower levels, setting up for the next cycle.
Here’s how these stages have unfolded in the past, also including the current cycle for comparison, with durations and price ranges (they are indicated on the chart):
📈 2012 Halving (November 2012):
Pre-Halving Rally: ~12 months (Nov 2011–Nov 2012, $2 to $12)
Post-Halving Bull Run: ~12 months (Nov 2012–Nov 2013, $12 to ~$1,150)
Bear Market: ~13 months (Dec 2013–Jan 2015, $1,150 to ~$170)
Accumulation Phase: ~15 months (Jan 2015–Apr 2016, ~$170–$450)
📈 2016 Halving (July 2016):
Pre-Halving Rally: ~10 months (Sep 2015–Jul 2016, $230 to $650)
Post-Halving Bull Run: ~17 months (Jul 2016–Dec 2017, $650 to ~$20,000)
Bear Market: ~12 months (Dec 2017–Dec 2018, $20,000 to ~$3,200)
Accumulation Phase: ~16 months (Dec 2018–Apr 2020, ~$3,200–$8,500)
📈 2020 Halving (May 2020):
Pre-Halving Rally: ~10 months (Jul 2019–May 2020, $4,000 to $8,700)
Post-Halving Bull Run: ~18 months (May 2020–Nov 2021, $8,700 to ~$69,000)
Bear Market: ~14 months (Nov 2021–Jan 2023, $69,000 to ~$16,500)
Accumulation Phase: ~15 months (Jan 2023–Apr 2024, ~$16,500–$60,000)
📈 2024 Halving (April 2024): Current cycle
Pre-Halving Rally: ~12 months (Apr 2023–Apr 2024, ~$26,000 to ~$73,000)
Post-Halving Bull Run: ~18 months (Apr 2024–Oct 2025, ~$73,000 to ~$90,000, ongoing)
Bear Market: nowhere to be seen
In the past, retail traders drove these cycles, fueled by hype on platforms like YouTube, X or Reddit. Now, institutions are reshaping the game.
ℹ️ Why the 4-Year Cycle May Be Over
We’re 18 months past the 2024 halving (April 2024–October 2025), matching the typical length of past bull runs. Yet, there’s no sign of a reversal. The monthly RSI, which hit 90+ at the peaks of previous cycles (2013, 2017, 2021), is only in the 60s–70s now, signaling controlled, gradual growth rather than a parabolic spike. This steady climb could continue, and here’s why the traditional cycle might be breaking down, with institutions leading the charge.
1️⃣ Institutions Are Driving the Market
Bitcoin used to be retail territory—everyday traders chasing hype on social media, buying into rallies, and selling in panic. Now, institutional investors like BlackRock, Fidelity, and MicroStrategy are pouring in billions. The U.S. spot Bitcoin ETFs launched in 2024 have amassed over $10 billion in assets by October 2025. Unlike retail traders, institutions don’t ride emotional waves. They treat Bitcoin as a long-term hedge or portfolio asset, creating steady demand.
This shift is a game-changer. A key difference this cycle? Bitcoin broke its previous all-time high (~$69,000 from 2021) before the 2024 halving, hitting ~$73,000 in March 2024—something that never happened in prior cycles, where new highs came post-halving. This early breakout, along with the 18-month rally without a crash and a moderate RSI, shows institutions are driving consistent buying, smoothing out the wild swings of past cycles. It’s like the market’s gone from a rollercoaster to a steady climb, and big money is the driving factor.
2️⃣ Halvings Have Less Impact
Early halvings slashed Bitcoin’s supply growth significantly—25% to 12% in 2012. The 2024 halving only dropped inflation from ~1.7% to ~0.85%. With ~19.7 million of 21 million coins already mined, the supply shock is weaker. Markets now price in halvings early, reducing the explosive surges of past cycles and miners have less BTC to sell, reducing impact on the market.
3️⃣ Macro Factors Are Taking Over
Bitcoin is increasingly tied to global markets. It fell in 2022 with stocks when the Fed raised rates and rallied in 2023–2024 as rate cuts seemed likely. Macro trends—interest rates, inflation, the dollar—now outweigh the halving’s influence. Institutions, focused on these factors, align Bitcoin’s price with broader financial markets, not its internal cycle. The Fed's announcement of further cuts, making money cheaper, point towards a further increase of BTC price.
4️⃣ Market Sentiment Has Matured
Retail FOMO used to cause massive pre-halving rallies, but traders are more disciplined now. The 2024 pre-halving rally was modest compared to past cycles, despite breaking the all-time high. Competition from altcoins and DeFi splits market focus. Institutions, with their data-driven approach, don’t chase hype, contributing to the steady growth we’re seeing.
5️⃣ On-Chain Data Shows a Shift
Models like Stock-to-Flow, once reliable, failed to predict 2024’s price action. Long-term holders are selling less, partly due to institutional custody, reducing sell pressure and muting bull run spikes. The moderate RSI and lack of a crash at the 18-month mark reflect a market driven by steady accumulation, not retail mania.
‼️ Traders: Bias can be dangerous
With the 4-year cycle potentially fading, caution is advised. Here’s how to adapt:
Track Macro Trends : Monitor Fed policy, inflation, and stock market moves. Use TradingView’s correlation tools to see how Bitcoin tracks with assets like the Nasdaq.
Use On-Chain Metrics : Check MVRV or Puell Multiple on TradingView to gauge market sentiment, independent of halving timelines.
Stay Flexible : Focus on shorter-term charts (daily, weekly) to catch trends, rather than waiting for cycle milestones.
Manage Risk : With less predictability, use tight stop-losses and smaller position sizes.
📃 So what's the conclusion?
Bitcoin’s 4-year cycle was a trader’s roadmap, but it’s losing its edge. We’re 18 months into the post-2024 halving rally, with no crash in sight and a monthly RSI signaling controlled growth that could persist.
Breaking the previous all-time high before the halving sets this cycle apart, driven by institutional demand. With weaker halvings, macro influences, and a more mature market, the old cycle may be history. In October 2025, Bitcoin is still going strong, but it’s moving to a new rhythm—driven by big money, not hype.
📢 What do you think?
Will Bitcoin’s cycles keep fading, or is the old pattern coming back? Share your thoughts in the comments!
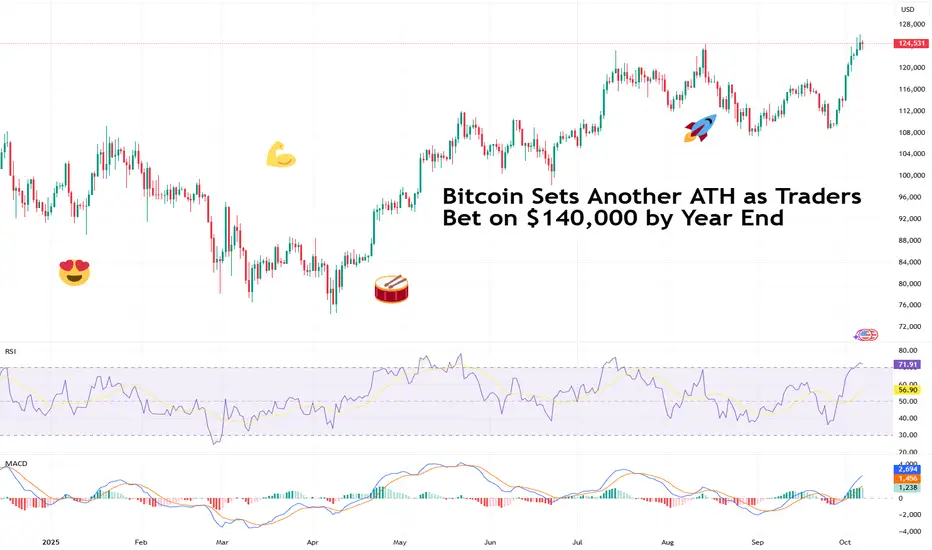
Bitcoin Sets Another ATH as Traders Bet on $140,000 by Year EndBlink and you’ll miss it. Bitcoin’s recent leg up caught lots of traders unprepared. After sinking below $110,000 few weeks back, the OG coin slingshotted to a fresh record high above $126,000 this week. Not a bad way to start October Uptober .
Now, traders are adding to bets that the price will crack $140,000 by year end. How realistic is that?
🌕 “Uptober” Strikes Again
October has a reputation in crypto lore and it’s living up to it.
Over the last 13 Octobers, Bitcoin BITSTAMP:BTCUSD has ended in the green 10 times. The pattern is set to continue as the coin rides a broader wave of optimism fueled by the Fed’s rate cuts, a messy US government shutdown, and the return of that dangerous four-letter abbreviation: FOMO.
But the real kicker? Spot Bitcoin ETFs are on fire.
US-listed Bitcoin ETFs kicked off the month with their second-best week ever, attracting $3.24 billion in net inflows — nearly matching their record of $3.38 billion set in November 2024. Are we… so back ?
💥 Options Traders Go Big: $140K or Bust
In the options market, optimism is loud and clear. Data from Deribit shows open interest piling up around the $140,000 strike for contracts expiring in December — meaning plenty of traders are betting we’ll see new highs just in time for the holiday season. (Not that easy to gift a BTC now, is it?)
At the same time, a few cautious traders are hedging with puts, just in case this turns into another one of those “too-fast, too-furious” rallies.
📈 You Get a Record and You Get a Record
It’s not just Bitcoin exploring new horizons. The S&P 500 SP:SPX and the Nasdaq Composite NASDAQ:IXIC both logged their 30-something record closes of 2025, powered by relentless AI strength ( some huge OpenAI deal ) and investors betting that rate cuts will stretch the bull run.
But also, gold bugs are turning into the Scrooge McDucks of the market, backstroking through piles of gold in impenetrable fortresses.
The shiny stuff OANDA:XAUUSD is up 55% year to date and hovering just under $4,000 per ounce, a milestone that would make even die-hard crypto bulls nod in respect.
Apparently, the market’s hot across the board.
🧠 Why Bitcoin’s Rally Makes Sense (Kind Of)
Underneath the euphoria, there’s some logic to this madness:
• Lower rates = cheaper money. When the Fed cuts, non-yielding assets like Bitcoin suddenly look more attractive.
• Inflation’s still sticky. Investors want something that can’t be printed at will. The US government shutdown only strengthened that flow of cash.
• Institutional influx is real. ETFs, family offices, and even corporate treasuries are allocating to Bitcoin BITSTAMP:BTCUSD , Ethereum BITSTAMP:ETHUSD , and Solana PURPLETRADING:SOLUSD.
At its current market cap of $2.5 trillion, Bitcoin is now bigger than Amazon NASDAQ:AMZN ($2.4 trillion), the world’s fifth-largest company .
🧭 The “Uptober” Mindset
Here’s where psychology comes in. After weeks of choppy sideways trading, boredom gave way to disbelief — then disbelief turned to excitement. Now? We’re entering the danger zone where conviction and euphoria start to blur.
Some veterans call this the “emotional compression” phase — when every dip feels like an entry and every green candle feels eternal. But cycles never die; they just rotate. Those who chase late often learn that momentum cuts both ways.
Still, momentum traders have history on their side. Every October since 2012 (barring 2018, 2014, and 2012), Bitcoin has delivered solid gains. It’s hard to argue with a pattern that reliable — until it breaks.
🤔 What Could Trip Up the Bulls
Even the most euphoric chart has risk baked in:
• Profit-taking. After a 100% gain over the past twelve months, short-term traders can decide to lock in profits fast.
• Macro shocks. One bad inflation print ECONOMICS:USCPI or a hawkish Fed comment could cool the mood.
• Overheated sentiment. When everyone in your barbershop agrees it’s going up, it usually doesn’t — at least not immediately.
The chart’s near-term support sits between $120,000–$122,000. Lose that, and a retest of $110,000 is possible. Hold it, and $140,000 becomes more than just a meme.
📢 $140K by Year-End: Dream or Data?
Statistically speaking, Bitcoin would need roughly a 4% monthly gain from here to hit $140,000 by December. Considering it’s already up over 100% year-to-date, that’s not outrageous.
To get there, the stars must stay aligned:
• ETF inflows keep building momentum.
• The Fed sticks to its dovish script.
• Stocks stay buoyant, giving traders room to take risk.
• No black swans, no rug pulls, no sudden panic tweets.
If all that holds, a single Bitcoin closing the year north of $140,000 isn’t fantasy. It’s just crypto doing what crypto does — defying logic, gravity, and your risk management plan.
👉 Off to you : Where do you see Bitcoin by end of year? Cast your predictions in the comment section!
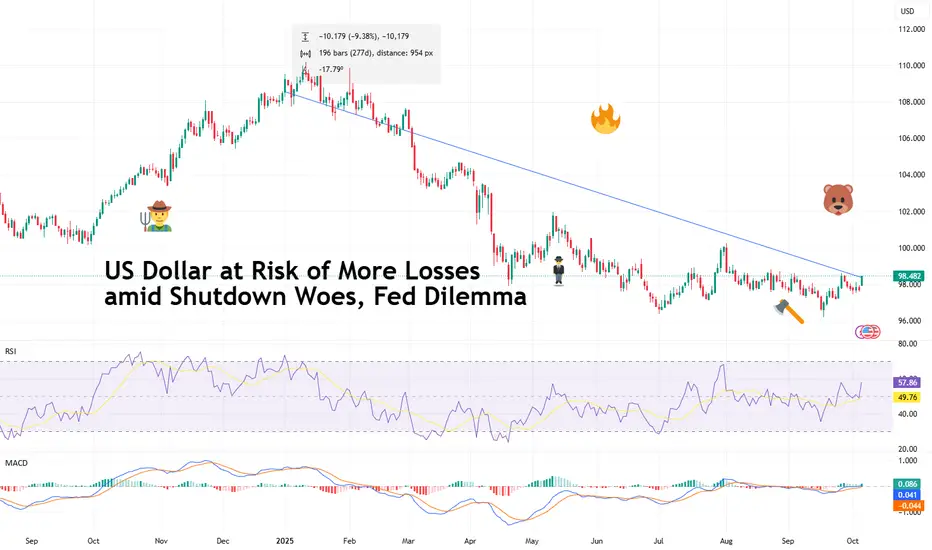
US Dollar at Risk of More Losses amid Shutdown Woes, Fed DilemmaThe US dollar TVC:DXY has been knocked by last week’s US government shutdown and the subsequent economic blackout. At the same time, the Federal Reserve can’t figure out what’s worse – inflation or job crunch.
After Congress failed to pass a funding bill, the government officially went dark at 12:01 a.m. Wednesday.
Traders, however, didn’t panic. Stocks climbed to fresh record highs , gold OANDA:XAUUSD popped, yields dipped — and the dollar slipped further into the red .
The greenback, usually the go-to safe haven during global turmoil, is acting like it forgot about that job description. With the Federal Reserve cornered between a slowing economy and stubborn inflation, plus fresh political uncertainty in D.C., the dollar’s shine is fading fast.
⚖️ When Politics and Policy Collide
Let’s start with the elephant in the room: the government shutdown. Historically, these dark D.C. moments shave about a tenth of a percentage point off GDP per week. In other words, the economy loses a few hairs — not a limb. But this one hits differently.
That’s because the Fed is already walking a tightrope. With unemployment creeping up ( 4.3% in August and lost jobs in June ) and inflation still running at 2.9% , the central bank has little margin for error.
The longer the shutdown drags on, the harder it becomes for policymakers to parse what’s real economic weakness and what’s just delayed government paychecks.
Investors, meanwhile, are pricing in a full quarter-point rate cut at the Fed’s next meeting and another one in December. The market is betting that Powell & Co. will prioritize saving jobs over fighting inflation. And that typically means one thing: a softer dollar.
📉 The Dollar’s Safe-Haven Cred Takes a Hit
Remember when the dollar used to rally whenever things got messy? Not this year. Despite trade tensions, geopolitical flare-ups, and now a full-blown government shutdown, the dollar has lost roughly 10% since January.
Part of that weakness stems from shifting interest-rate expectations. When the Fed signals it’s going to cut, yields on US assets drop — and so does the appeal of holding dollars.
Lower rates make borrowing cheaper, but they also mean less income for investors parking money in dollar-denominated bonds.
The euro took advantage, climbing above $1.17 as traders rotated out of the greenback.
Gold also basked in the dollar’s weakness, closing Friday at $3,886 an ounce — a fresh all-time closing high.
And just to rub salt in the wound, even cryptocurrencies have outperformed. Bitcoin BITSTAMP:BTCUSD , the digital rebel of finance, has gained about 35% this year and on Sunday hit a record high above $125,000 per coin.
🧩 Fed Dilemma: Jobs vs. Inflation
The Federal Reserve’s dual mandate is simple on paper: keep prices stable and employment high. But right now, the two goals are in open conflict.
On the one hand, the labor market is clearly slowing. August brought just 22,000 new jobs — the weakest print since early 2020. Revised data for June showed the economy actually lost 13,000 staffers net. Those aren’t the kinds of numbers that inspire confidence.
On the other side, inflation is still running above target. Core PCE, the Fed’s favorite measure, clocked in at 2.9% in August — unchanged from July but still nearly a full percentage point above the goal.
So what’s the play? Cut rates to support jobs and risk stoking inflation? Or hold firm, keep inflation contained, and risk a deeper slowdown? That’s the central banker’s version of “Would you rather.”
👀 The Fed’s Independence (and the Trump Factor)
There’s another layer of intrigue: politics. The Supreme Court just deferred a hearing on President Trump’s attempt to remove Fed Governor Lisa Cook — a Biden appointee — until January.
Cook can remain at the Fed in the meantime, but the episode has traders questioning just how independent the central bank really is under the new administration.
Fed Chair Jerome Powell, nearing the end of his term, has been caught between maintaining credibility and avoiding direct political confrontation. His latest move — a quarter-point rate cut in September — was meant to show responsiveness to data, not pressure. But optics matter, and the market is watching for signs of interference.
If investors start believing the Fed is bending to political will, confidence in US monetary policy could erode further — another potential strike against the dollar.
💡 What It Means for Traders
Here’s the breakdown:
• For FX traders: The dollar remains vulnerable, especially if the Fed confirms more cuts are on the way. Pairs like FX:EURUSD and FX:GBPUSD could see more upside. Meanwhile, FX:USDJPY might stay volatile as yen buyers return to their comfort zone.
• For gold bulls: Lower yields and a weaker dollar create the perfect storm. Gold looks strong despite charting new horizons, though traders should watch for a potential pullback if the Fed’s tone shifts.
• For equity investors: Rate cuts are generally bullish. Cheaper money means higher valuations — at least until inflation becomes a problem again.
• For crypto enthusiasts: A dovish Fed tends to favor risk assets, and Bitcoin could benefit as a hedge against both inflation and institutional confusion.
🧮 The Shutdown Math: Small Impact, Big Symbolism
Economists will tell you that a shutdown doesn’t tank the economy — but it does rattle sentiment. Each week of a federal closure trims GDP growth by about 0.1 percentage point. If this one matches the 35-day record from 2018–19 (during Trump’s first term), we’re looking at a 0.5% haircut. Manageable, but not ideal when the economy’s already wobbling.
More concerning is what a prolonged shutdown means for data flow. If key reports like nonfarm payrolls ECONOMICS:USNFP or CPI ECONOMICS:USCPI get delayed, the Fed will be in the dark heading into its next meeting — and that’s when mistakes happen.
Markets hate uncertainty, and uncertainty is the shutdown’s main export.
🧭 The Road Ahead
The dollar’s trajectory from here depends on whether the Fed can strike the right balance. If Powell emphasizes employment and doubles down on cuts, you may expect the greenback to weaken further. But if inflation surprises to the upside, markets could quickly reverse their dovish bets.
Make sure to keep an eye on the Economic calendar . September’s inflation hits October 15 and the Fed’s meeting is on deck for October 28-29.
Off to you : Where do you see the dollar by year end? Share your thoughts in the comment section!
Retro Editors' picks 2024Closing our retro EP selection , we present to you the last collection of additional scripts that have earned a spot in our Editors' picks, in this case from 2024.
These retrospective selections reflect our continued commitment to honoring outstanding contributions in our community, regardless of when they were published. To the authors of these highlighted scripts: our sincere thanks, on behalf of all TradingViewers. Congrats!
Statistics • Chi Square • P-value • Significance - fikira
Adaptive Trend Classification: Moving Averages - InvestorUnknown
analytics_tables (library) - jason5480
Tick CVD - KioseffTrading
Simple Decesion Matrix Classification Algorithm - Steversteves
RiskMetrics (library) - TradingView
Over the last four months, we shared retro Editors' picks for subsequent years:
May: retro EPs for 2020
June: retro EPs for 2021
July: retro EPs for 2022
August: retro EPs for 2023
They are visible in the Editors' picks feed .
█ What are Editors' picks ?
The Editors' picks showcase the best open-source script publications selected by our PineCoders team. Many of these scripts are original and only available on TradingView. These picks are not recommendations to buy or sell anything or use a specific indicator. We aim to highlight the most interesting publications to encourage learning and sharing in our community.
Any open-source script publication in the Community Scripts can be picked if it is original, provides good potential value to traders, includes a helpful description, and complies with the House Rules.
— The PineCoders team

SILVER (XAG/USD): One More Bullish Wave is Coming?!⚠️ SILVER appears to be confined within a horizontal range, as observed on the 4-hour chart. The price is currently nearing the upper limit of this range.
Given the prevailing strong bullish trend, there is a considerable likelihood of a continued upward movement.
A breakout and a 4-hour candle closing above the indicated resistance level would serve as a dependable confirmation.
The subsequent objective for buyers is anticipated to be 49.00.
Conversely, the market might persist in its consolidation phase, trading within the established range.

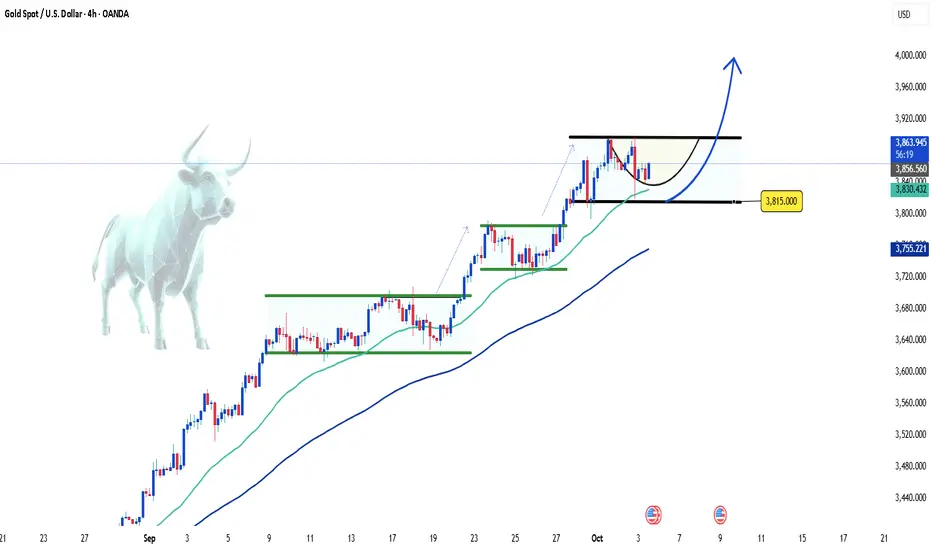
Gold Continues to Challenge Record Resistance Levels👋Hello everyone, what are your thoughts on OANDA:XAUUSD ?
As of this writing, gold continues its upward momentum, having reached new highs as investors increase their bets on the Federal Reserve cutting interest rates in the near future. The concerns over the U.S. government shutdown and global economic instability have further strengthened gold’s position as a safe haven asset.
At the same time, the U.S. Dollar is under pressure due to expectations of monetary easing, which is paving the way for further gains in gold.
Technically, gold is currently consolidating in a range, repeating patterns seen in the past. The current support level is around $3,815, while the immediate resistance is near the $3,900 mark. If the price breaks this resistance, the next target could be higher record levels.
Overall, the short to medium-term outlook still favors the bulls. Do you agree? Feel free to share your thoughts in the comments!
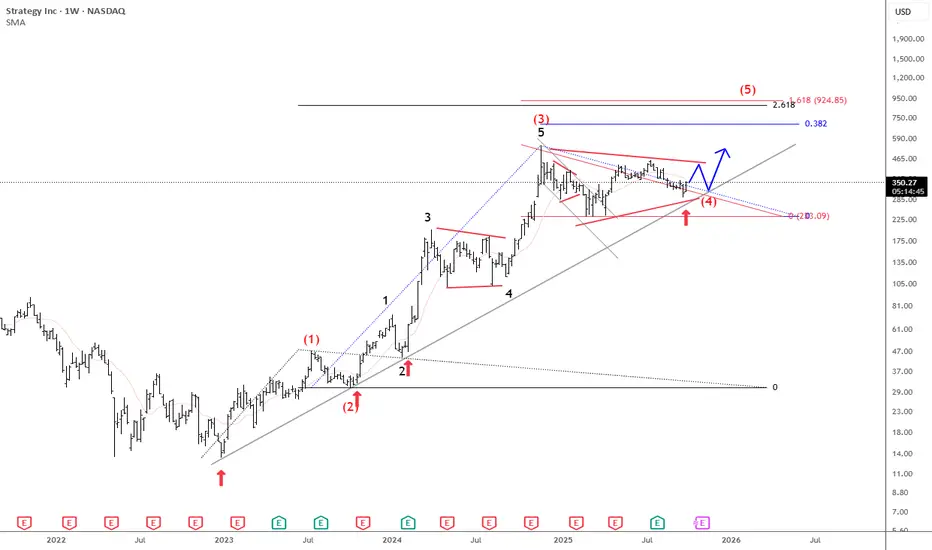
Microstrategy Is Still Pointing Higher For The Final 5th WaveMicrostrategy is a US business intelligence and software company, but it has become best known for its aggressive Bitcoin strategy. Under co-founder Michael Saylor, the company shifted from focusing mainly on software to also using Bitcoin as its primary treasury reserve asset.
Since 2020, MicroStrategy has been steadily buying Bitcoin, often using debt or equity raises to finance purchases. Their strategy is based on the belief that Bitcoin is superior to holding cash, as it can act as a long-term store of value against inflation and currency debasement.
From an Elliott wave perspective, we see Microstrategy nicely holding above trendline connected from the 2022 lows, so it's still unfolding a five-wave bullish impulse. Currently, it's consolidating within a bullish triangle pattern in wave (4), and once it's fully finished, we can expect another and maybe final push to the upside for wave (5) this year before a higher degree correction and bear market shows up next year.
We also want to mention that even Bitcoin can be finishing a 3-year bullish cycle, which can end this year, but there's still some space for more gains along with the Microstrategy to complete the 5th wave of an impulse.
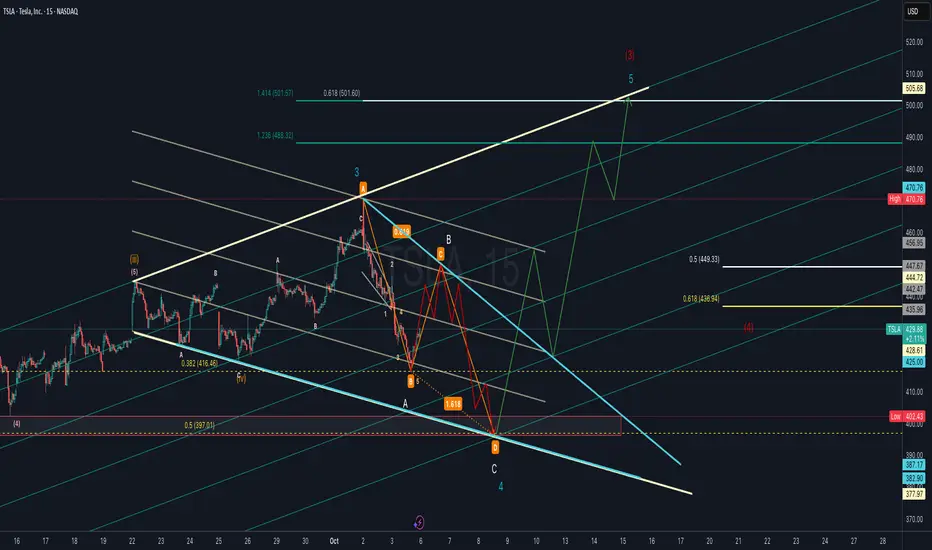
TSLA Elliott Wave Count with ABC Harmonic or Flat Corrective Tesla (TSLA) is forming a potential Wave 4 correction that aligns with an ABC harmonic structure. Price action suggests a possible deeper retracement into the 0.5–0.618 Fibonacci support zone (436–449 area) before resuming its larger uptrend.
If Wave 4 completes near the harmonic “D” zone (highlighted support box), the next leg higher could target the 1.236–1.414 Fibonacci extensions around 488–501, in line with Wave 5 projection.
Key levels to watch:
Support: 436.9 (0.618 retrace), 425 psychological, 397 strong support.
Resistance: 444.7, 470.8 (previous high), 501–505 (Wave 5 target).
Bullish scenario: Wave 4 completes soon, leading to a strong Wave 5 breakout towards 500+.
Bearish scenario: Breakdown below 425–397 support could invalidate the bullish count and extend correction lower.
The other possibility is that it is actually unfolding a flat correction in Wave 4 after completing Wave 3 near the recent high. The structure suggests price may continue to consolidate within the corrective channel before setting up the next impulse leg.
Bullish scenario: Flat correction completes, setting the stage for Wave 5 rally toward 490–505.
Bearish scenario: Breakdown below 397 invalidates the bullish count and signals deeper retracement.
NVDA Ready for Takeoff: $200 Target in Sight!
Based on the daily chart of NVIDIA (NVDA) on NASDAQ, here’s a breakdown:
🔎 Technical Analysis
Overall Trend
The stock is in a strong uptrend (rallying from around $120 to the current $186).
Higher lows are forming, and price is pressing against the 185–187 resistance zone, showing strong buying pressure.
Key Resistance
185–187 USD is a critical resistance zone tested multiple times.
Given the strong daily candle and volume, the probability of a breakout is high.
Short-Term Support
Uptrend line provides support around 176–178 USD.
Next key support sits near 170 USD.
🎯 Short-Term Outlook (1–4 Weeks)
Entry Trigger: After a confirmed breakout above $187
Target 1: $195
Target 2: $200
Stop-Loss: Close below $178
🌐 Long-Term Outlook (3–6 Months)
Sustained breakout above $187 could lead to a new bullish phase.
Target 1: $210
Target 2: $225
Stop-Loss: Break below $170
✅ Summary
NVIDIA is on the verge of breaking a major resistance level. A cautious entry above $187 may offer attractive upside potential. Risk of a false breakout exists, so stop-loss discipline is crucial.

Why Gen X Struggles with Crypto?Why does Gen X struggle with crypto?
Because they’re used to the stock market system, where ownership is recorded by a central registry and trades that are tied to a specific exchange.
In their world, you typically should buy through Nasdaq in this example and expect to sell through Nasdaq. But with Bitcoin or other cryptocurrencies, the blockchain itself is the registry, which means you can buy on one platform and sell on another freely. That shift—from centralized exchanges to decentralized settlement—is what makes crypto hard to grasp.
Mirco Bitcoin Futures and Options
Ticker: MBT
Minimum fluctuation:
$5.00 per bitcoin = $0.50 per contract
Disclaimer:
• What presented here is not a recommendation, please consult your licensed broker.
• Our mission is to create lateral thinking skills for every investor and trader, knowing when to take a calculated risk with market uncertainty and a bolder risk when opportunity arises.
CME Real-time Market Data help identify trading set-ups in real-time and express my market views. If you have futures in your trading portfolio, you can check out on CME Group data plans available that suit your trading needs www.tradingview.com

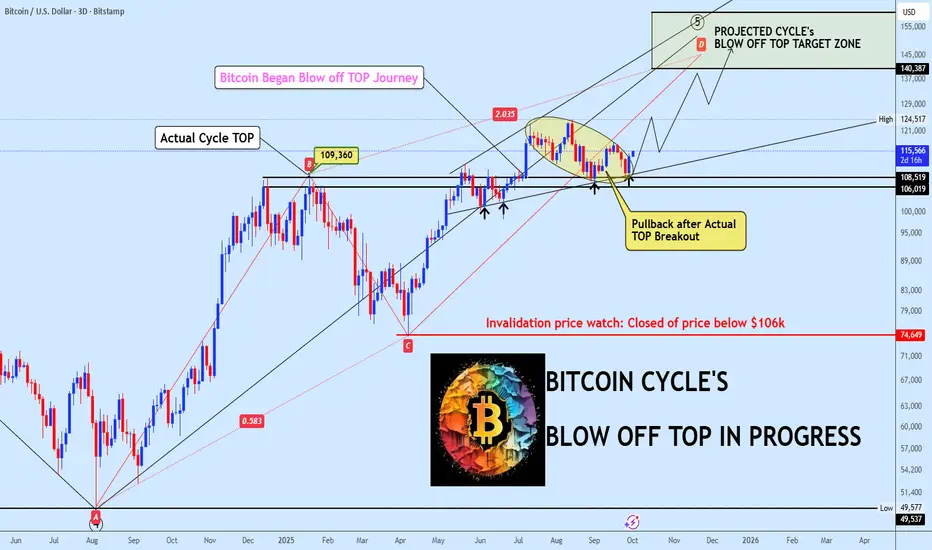
BTC ULTIMATUM: True Top Reached, Blow-Off Phase About to ExplodeHey everyone,
Let's cut through the noise. The market is flooded with conflicting signals about a potential market top, but the data on the chart is telling a crystal clear story. Many are getting this cycle wrong, so pay close attention.
Here's the truth: The Actual Cycle TOP was established back in JANUARY 2025.
That's right. However, the timing didn't align with the simplistic 4-year cycle models many were following. The definitive confirmation came with the recent powerful breakout and close above the $109,000 level. This wasn't a false breakout; it was the market screaming that the cycle is far from over.
What we are witnessing now is not the end of the bull market. This is the launch sequence for an extensive BLOW-OFF TOP formation.
The Current Setup: Building the Blow off top Launchpad
As the chart clearly shows, we are currently in a pullback, retesting the most critical zone in the market right now: the $109k - $106k area.
Why is this zone so important?
• This is the former resistance (the January '25 top) that has now become the ultimate support. • This is the Blow-Off Top Base.
• The bulls are making a strong stand here, working to absorb selling pressure and accumulate for the next and likely final major parabolic rally of this cycle.
Think of this consolidation as the coiling of a spring. The longer and tighter it holds this base, the more explosive the eventual breakout will be.
The Path Ahead: Key Levels to Watch
1. The Imperative Support (The Base): $109,000 - $106,000
This is the line in the sand. A sustained close below $106,000 would invalidate the immediate blow-off top scenario and signal a much deeper correction is likely. As long as we hold above here, the macro structure is overwhelmingly bullish.
2. The Immediate Resistance (The Trigger): $124,000
This is the next major hurdle. A decisive break and close above $124,000 will be the signal that the blow-off top phase is accelerating. It will confirm that the base is solid and the engines are firing for the climb to the projected target zone.
3. The Projected Target Zone: $145,000 - $160,000
Based on the chart's projections, a successful hold of the base and a break above $124k opens the path towards the $145,000 to $160,000 range. This is where we could see the euphoric, parabolic peak of this entire Bitcoin cycle.
Stop listening to the top-callers who are early. The market structure is clear:
• We HAVE broken the previous cycle high.
• We ARE building a massive support base above it.
• We ARE poised for a historic blow-off top.
MY PLAN:
• Aggressive: Accumulate in the $109k-$106k base zone with tight stops below.
• Conservative: Wait for a confirmed breakout and close above $124,000 to enter for the parabolic move.
The journey to six figures is behind us. The journey to the cycle peak is just getting started.
Stay disciplined, trade the levels, and ignore the noise.
Like, follow, and share your thoughts below! Are you accumulating in the base, or waiting for the $124k breakout confirmation?
BMNR Technical Outlook: A Textbook PlayStructure and Pattern Recognition
BMNR has developed a constructive base while holding its broader uptrend structure. The chart highlights the potential formation of a double bottom reversal, a classical pattern that often signals the exhaustion of selling pressure and a shift toward accumulation. The neckline aligns closely with recent liquidity zones (LQ), providing a clear reference point for confirmation.
Key Levels and Setups
Price is currently consolidating around the $50–$52 range, supported by the trendline from early August. Above, the immediate target lies at the $57–$60 liquidity zone, followed by a higher expansion opportunity toward $65–$67. If momentum persists, the upper extension into $71+ remains in play. A break and sustained close below the ascending trendline, however, would invalidate the structure and shift focus back to the mid-$40s.
Volume Profile and Momentum
The volume profile confirms heavy participation around the $50 area, creating a strong base of support. As price reclaims the 200 EMA and breaks above local resistance, order flow is likely to accelerate toward higher supply zones. This aligns with the thesis that any breakout above neckline resistance could trigger a measured move targeting the mid-$60s.
Outlook and Scenarios
Bullish Case: A confirmed breakout above the $57–$60 zone validates the double bottom structure, opening the path toward $65–$67 and potentially $71.
Bearish Case: Failure to hold the $50 trendline support exposes BMNR to a deeper retracement, with downside risk into the low-to-mid $40s.
Conclusion
BMNR sits at a technical crossroads. While downside risk remains if $50 fails, the pattern structure and volume dynamics favor continuation higher if resistance breaks. Traders should monitor the neckline breakout as the defining signal for near-term direction.

Gold Tops $3,800 to New Record as Traders Wonder: Short or Long?Gold OANDA:XAUUSD is back in the spotlight, flashing new record highs in bold efforts to reclaim its throne as the ultimate “don’t panic” asset.
The yellow metal hit a record high of $3,820 per ounce early Monday morning before cooling slightly to hover near $3,810. That’s up more than 47% year-to-date, absolutely crushing Bitcoin’s BITSTAMP:BTCUSD modest 17% gain and the S&P 500’s SP:SPX respectable-but-boring 13%.
So the question isn’t whether gold is hot — it’s what traders should do about it. Go long, go short, or sit tight with popcorn and watch the shiny show? Let’s break it down. 🤸🏻♀️
📈 A Rally Forged in a Rush
Gold’s monster run this year didn’t happen in a vacuum. Inflation has stayed sticky, but not alarmingly so — Core PCE clocked in at 2.9% in August, unchanged from July.
More importantly, markets are convinced that Jerome Powell and his not-so-merry band of central bankers will restart the rate-cutting cycle. Following the September cut , another trim could come as early as October.
Lower rates mean the opportunity cost of holding gold gets a lot smaller. (Gold famously pays no yield, no dividends, no interest, no nothing!). If Treasuries aren’t giving you much, parking money in shiny metal suddenly feels smarter. That’s been a huge tailwind for bullion.
On top of that, Trump last week announced tariffs on imported drugs, trucks, and furniture. Every time the tariff machine fires up, traders reach for their safe-haven toolkit. Spoiler: gold is always in there.
✨ Why Gold Still Glitters
Gold isn’t just a shiny rock — it’s a psychological anchor. Investors treat it like insurance against bad times. With rate cuts looming, central banks are buying aggressively. That way demand has a natural floor.
Global central banks, led by heavyweights like the US, China, Russia, and Turkey, have been stacking gold for months. That creates a structural bid under prices, no matter what institutional investors are doing day-to-day.
And don’t forget the everyday crowd: ETFs and bullion dealers have seen renewed inflows as traders hedge against “what if Powell loses control?” scenarios.
In short: gold thrives when confidence in the dollar, the economy, or politics falters. Check, check, and check. The dollar’s lower by about 10% on the year, the economy may or may not be adding jobs after wild job-count revisions . And politics? That’s where the US slaps tariffs on everyone.
📉 The Bearish Angle: Why Short Might Work
Now for the spicy take — maybe gold’s run is overdone. At nearly $3,800, the metal’s flirting with parabolic territory. There’s no recent support for a potential rebound so the way south could be steep. As steep as the first available support zone near $3,500.
Shorting gold here is essentially a bet that:
• The Fed’s cuts are already priced in.
• Inflation could flare up again, forcing rates higher, which could pressure gold.
• Risk assets rebound, reducing the appeal of hiding out in safe havens.
And let’s not forget: gold’s moves aren’t always rational. When everyone’s piled into the same safe haven, the smallest spark can trigger a stampede for the exits. A dip back to $3,500 — the April record — wouldn’t surprise seasoned traders. Speaking of steep selloffs, that’s exactly what happened after that April high.
🚀 The Bullish Angle: Why Long Still Makes Sense
On the other hand, momentum is a beast, and right now, gold has it. Every dip this year has been met with eager buying. As long as central banks keep accumulating and the Fed sticks to the rate-cutting script, the long case should stay intact.
The macro backdrop is still uncertain and murky: tariffs, wobbly jobs data, political drama, and a dollar that looks tired. That’s not a bad mix for more upside. A decisive breakout above $3,791 could put $4,000 on the radar, giving long traders another juicy leg higher.
🔀 Noise, Narratives, and the Middle Ground
Here’s the tricky part: both the bull and bear cases have merit. Gold’s fundamentals support strength, but technicals hint at exhaustion (RSI and MACD suggest overbought conditions).
That’s why positioning is everything. Reliable stops and clear risk-reward targets are your friends here — whether you’re riding the momentum wave or calling its top.
Seasoned traders know this dance: gold rallies hard, then chops sideways for weeks, lulling everyone into boredom before it explodes again. The key is not to let noise — tariffs, tweets, or Fed chatter — shake you out of your plan. But also, keep an eye on the Economic calendar and be ready for the next wave of reports and data.
🎯 Bottom Line
Gold’s 47% rally this year makes it the star of the market, but it also makes it vulnerable. A case exists for shorts (froth, more than anything) and for longs (structural demand, central bank buying, Fed easing).
The real takeaway? Don’t pick a side out of emotion. If gold breaks convincingly above $3,791, momentum traders will be justified in staying long. If it fails at resistance and rolls over, bears may get their payday.
Off to you : What’s your position in gold? Are you looking for more appreciation or you’re a short seller? Share your thoughts in the comment section!

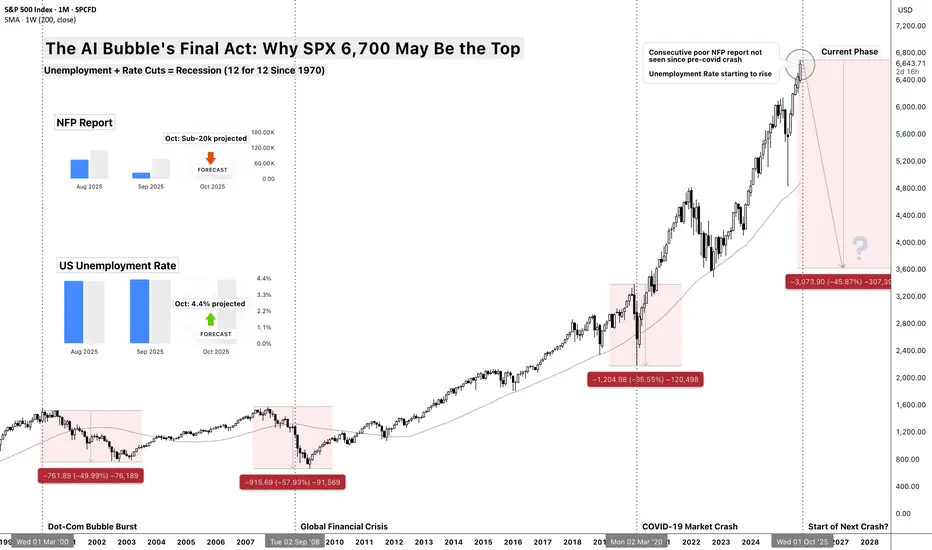
The AI Bubble's Final Act: Why $SP:SPX 6,700 May Be the TopThe AI Bubble's Final Act: Why SP:SPX 6,700 May Be the Top
Unemployment + Rate Cuts = Recession (12 for 12 Since 1970)
The Death Cross Pattern
There's a simple rule that's worked for 55 years: When the Fed cuts rates while unemployment is rising from cycle lows, recession follows within 12 months - every single time.
Think of it like a doctor taking your temperature while giving you painkillers. The medicine might make you feel better temporarily, but if the fever is rising, something serious is wrong underneath.
Current Status:
✅ Fed just cut rates ECONOMICS:USINTR (September 2025)
✅ Unemployment ECONOMICS:USUR rising from 3.4% cycle low
✅ TVC:SPX at all-time high ($6,700)
Historical Result: 12/12 times = recession + 35% average equity crash
The Precedent: Crisis Follows a Script
2000 Dot-Com Bubble:
Setup: TVC:SPX at ATH (1,550), ECONOMICS:USUR unemployment at 3.9%, ECONOMICS:USINTR Fed starts cutting
Crisis: Technology "revolution" story breaks down
Result: -49% crash over 2.5 years
Recovery: 7 years to new highs
2008 Financial Crisis:
Setup: CBOE:SPX at ATH (1,576), ECONOMICS:USUR unemployment at 4.4%, ECONOMICS:USINTR Fed starts cutting
Crisis: Housing/credit bubble bursts
Result: -57% crash over 1.5 years
Recovery: 5 years to new highs
2025 AI Bubble:
Setup: SPREADEX:SPX at ATH (6,700), ECONOMICS:USUR unemployment at 3.4%→4.2%, ECONOMICS:USINTR Fed starts cutting ✅
Crisis: AI productivity story meets employment reality
Projection: -35 to -45% crash over 18 months
Recovery: 3-5 years (faster due to tech infrastructure remaining)
The AI Employment Paradox
The Productivity Mirage
Wall Street celebrates AI boosting productivity, but here's the paradox:
productivity gains = job losses = reduced consumer spending = recession.
Think of it like a factory owner celebrating a new machine that replaces 100 workers. Great for margins, terrible for the local economy when those 100 families stop spending.
Jobs ECONOMICS:USNFP at Risk by Sector:
Customer Service: 2M jobs (chatbots replacing agents)
Software Development: 500K jobs (AI-assisted coding reducing teams)
Transportation: 3M jobs (autonomous vehicles accelerating)
Administrative: 4M jobs (AI handling routine tasks)
Content Creation: 1M jobs (AI writing, design, video)
Total Impact: 10+ million jobs facing displacement over next 2-3 years
Why This Time is Different?
Unlike previous automation waves that created new job categories, AI is targeting cognitive work directly. A factory worker could become a service worker, but what does a displaced knowledge worker become?
Valuation Extremes: 1929 Levels with 2025 Leverage
Current Valuation Metrics:
Shiller CAPE: 38+ (higher than 1929's 33)
Buffett Indicator: 195% (market cap/GDP, historical average 85%)
Price/Sales: 3.3x (vs 1.4x historical average)
Forward P/E: 23x (on optimistic AI earnings assumptions)
Valuations today exceed 1929 by most measures - but with far more leverage embedded in the system. If 1929 was a valuation bubble, 2025 is that bubble layered with derivatives, corporate debt, and passive flows.
The Leverage Layer:
Margin Debt: $1.023 trillion (record high)( as of July 2025, ycharts )
Corporate Debt/GDP: 85% (vs 45% in 2000)
Derivatives Exposure: $700 trillion notional ( as of June 2025, BIS semiannual data )
ETF/Passive Flows: $1.5 trillion annually (forced selling on reversals)
When liquidity stress hits, derivatives amplify shocks - notional exposure dwarfs underlying assets.
Think of today's market like a house of cards built on a trampoline. Even small bounces can bring the whole structure down.
Technical Breakdown: The Charts Don't Lie
Major Warning Signals:
Market breadth has deteriorated from 90% in Q4 2024 to ~60% today,
Defensives led earlier in the year,
TVC:VIX Volatility’s floor has shifted higher
Credit risk appetite (HYG/TLT) is stretched.
Together, these signal fragility beneath the index surface.
The Three-Stage Technical Collapse:
Stage 1 - The Warning (Now-Q4 2025):
Current Level: $6,700
Initial Support: $6,200 (previous resistance)
Character: Failed rallies, rotating leadership, "healthy correction" narrative
Target: 5,800-6,000 (-10 to -13%)
Stage 2 - The Cascade (Q4 2025-Q2 2026):
Breaking Point: Below 5,800 triggers algorithmic selling
Character: "Buy the dip" stops working, margin calls begin
Target: 4,800-5,200 (-25 to -30%)
Stage 3 - Capitulation (Q2-Q4 2026):
Final Flush: Panic selling, ETF redemptions
Character: "Markets will never recover" sentiment peaks
Target: 3,700-4,200 (-35 to -45%)
The Catalyst: When Reality Meets Hype
Q4 2025 Earnings Season - The Reckoning
Companies will face impossible questions:
"You spent $50B on AI - where's the revenue growth?"
"Productivity is up 20%, why are you laying off workers?"
"If AI is so transformative, why are margins declining?"
The Employment Data Domino Effect:
October/Nov NFP: First print above 250K unemployment claims
November Consumer Spending: Down 2%+ as job fears spread
December Holiday Sales: Weakest since 2008
January Layoff Announcements: Tech companies start "right-sizing"
Think of it like the moment in 2000 when investors finally asked: "How exactly does Pets.com make money?" or 2007 when they wondered: "What's actually in these mortgage bonds?"
Sector-by-Sector Breakdown
Technology (-50 to -70%)
AI hype stocks get destroyed first
Software companies face declining growth + competition
Semiconductor cycle turns negative
Biggest Losers: NVDA, MSFT, GOOGL
Consumer Discretionary (-40 to -55%)
Unemployment hits spending immediately
High-end retailers crushed first
Auto sales collapse with higher rates
Biggest Losers: TSLA, AMZN, NKE
Financials (-30 to -45%)
Credit losses surge as economy weakens
Interest margin compression
Commercial real estate exposure
Biggest Losers: Regional banks, non-bank lenders
Relative Outperformers (-15 to -25%)
Utilities, Healthcare, Consumer Staples
Companies with genuine AI cost savings
High-dividend yielders in low-rate environment
Key Dates and Catalysts
October 2025:
Jobs report (first warning?)
Q3 earnings disappointments
Fed meeting (dovish pivot?)
November 2025:
Election aftermath volatility
Black Friday sales data
Thanksgiving week low-volume crashes
December 2025:
Year-end tax selling
Institutional rebalancing
Holiday retail reality check
Q1 2026:
Layoff announcements surge
Earnings guidance slashed
Credit events begin
The Recovery Setup
Why This Crash Creates Opportunity:
Valuation Reset: P/E ratios back to historical norms
Weak Hands Flushed: Margin traders eliminated
Government Response: Fiscal + monetary stimulus
AI Infrastructure Remains: Real productivity gains continue post-bubble
Recovery Timeline:
Bottom: Q4 2026 around 3,700-4,200
Initial Rally: 30-50% bounce over 6 months
New Bull Market: Begins 2027 with stronger foundation
New Highs: 2029-2030 timeframe
Risk Management Rules
This Analysis Fails If:
Fed pivots to massive QE before crisis
Fiscal stimulus exceeds $2 trillion quickly
AI productivity gains offset job losses faster than projected
Geopolitical crisis overrides economic fundamentals
Probability Assessment:
60%: Correction to 4,800-5,500 range (25-30% decline)
25%: Major crash to 3,700-4,200 range (40-45% decline)
15%: Continued melt-up through 2026 (soft landing achieved)
Conclusion: The End of the Everything Era
At SPX 6,700 with unemployment rising and the Fed cutting rates, we're witnessing the final act of the 15-year "everything bubble."
The AI revolution is real, but like the Internet in 2000, revolutionary technology doesn't prevent financial gravity.
The bubble is ending exactly like the previous ones - with everyone believing "this time is different" right until it isn't.
Smart money is already rotating defensive. The question isn't whether a correction is coming - it's whether you'll be positioned for it.
Wall Street Weekly Outlook - Week 40 2025Every week I release a Wall Street Weekly Outlook that highlights the key themes, market drivers, and risks that professional traders are watching.
This week promises to be particularly important, with several events likely to move markets. 📊 Stay ahead of the curve—watch the video now and get prepared like a Wall Street insider.
Any questions? Drop a comment or reach out directly.
-Meikel

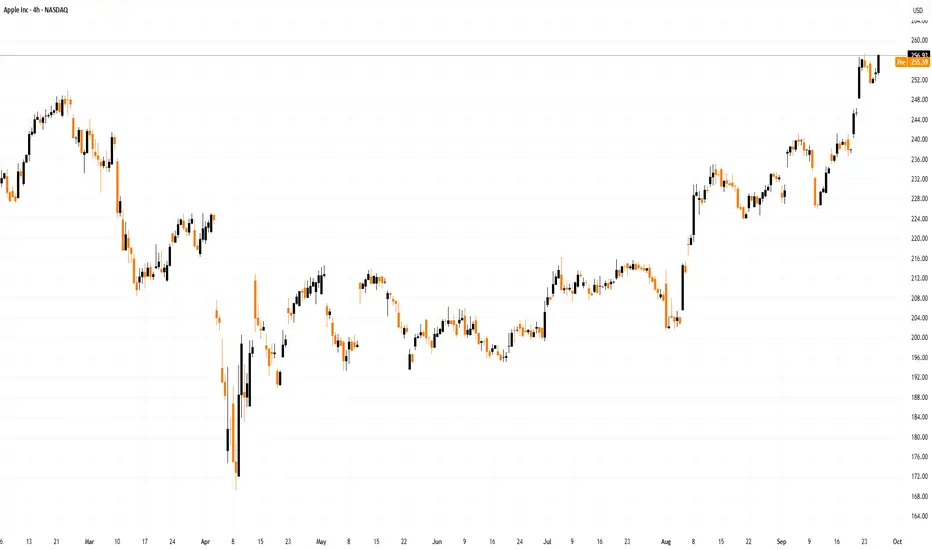
Apple Shares (AAPL) Close to Reaching Record HighApple Shares (AAPL) Close to Reaching Record High
On 10 September, we noted that following the launch of new products — including the iPhone 17 — AAPL shares had fallen by approximately 1.5%, as analysts considered the model lacked the breakthrough appeal necessary to drive further growth.
However, two weeks on, media reports point to strong demand for the new product range, highlighting that:
→ orders for the new devices exceed those for last year’s iPhone 16 series;
→ Apple has asked suppliers to increase production;
→ the base model, featuring the long‑awaited 120Hz display and the powerful A19 chip, is in especially high demand.
Positive reports of long queues at Apple Stores worldwide, along with extended delivery times — which Bank of America estimates at an average of 18 days compared to 10 days for last year’s model — have only bolstered bullish sentiment. AAPL shares are rising this week, even as broader market indices are falling.
Technical Analysis of Apple (AAPL) Shares
AAPL stock price movements in 2025 form a broad ascending channel (shown in blue). In this context:
→ Until early August, the price remained in a consolidation phase (shown by black lines) below the channel’s median;
→ Since then, the balance has shifted in favour of buyers — the price has demonstrated bullish momentum, forming a steep growth channel (shown in orange), with the median providing support (indicated by an arrow).
The strength of demand is confirmed by AAPL’s price action rising from $240 to $250:
→ bullish candlesticks were wide;
→ closing prices were close to the highs;
→ a bullish gap is visible on the chart.
This points to a buyers’ imbalance, giving grounds to regard this area as support in terms of a Fair Value Gap pattern.
From a bearish perspective:
→ the RSI indicator is in overbought territory;
→ shareholders may wish to take some profits.
Nevertheless, it cannot be ruled out that AAPL’s price growth will continue, driven by expectations that strong demand for the iPhone 17, as well as the updated Apple Watch Series 11 and AirPods Pro 3 with new AI features, will deliver record quarterly revenue for the company, covering the upcoming holiday season. In this scenario, bulls may target the upper boundary of the blue channel.
This article represents the opinion of the Companies operating under the FXOpen brand only. It is not to be construed as an offer, solicitation, or recommendation with respect to products and services provided by the Companies operating under the FXOpen brand, nor is it to be considered financial advice.
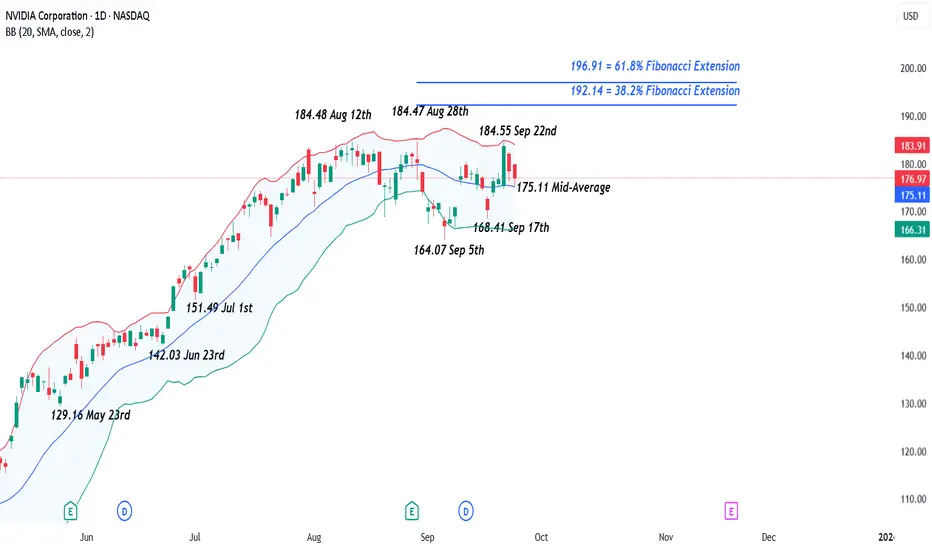
NVIDIA – Bumping Up Against Record HighsNVIDIA’s share price is experiencing an interesting run into the end of September as traders try and work out whether it can extend its run of gains through all time highs sitting just above the 184 level (184.55 Sept 22nd), a line in the sand that has capped the upside since the start of August (more on this in the technical update below).
With NVIDIA being the biggest company in the world by market capitalisation, currently sitting at a huge $4.34 trillion (No.2 Microsoft, $3.79 trillion), and it being the bellwether for AI performance, it’s not short of news flow to create periods of volatility.
Only on Monday, the company announced a $100 billion link up with Open AI to build new data centres and expand AI infrastructure together, which sent its stock price up 4% towards that 184 resistance, only for Federal Reserve Chairman Jerome Powell in a speech on Tuesday to send it back lower again as investors banked profits, when he offered a more cautious outlook towards future Fed rate cuts into the end of the year.
Looking into the end of the week, the focus may be on US economic data again, with the release of the final US Q2 GDP reading at 1330 BST today, and perhaps more importantly, the PCE index, which is the Fed’s preferred inflation gauge, due tomorrow at 1330 BST. Traders seem to be very sensitive to these inflation readings, given that they could determine whether the Fed is able to cut interest rates again before the end of 2025. Any deviation from expectations, to the up or downside could have an outsized impact on sentiment towards the NVIDIA stock price into the Friday close.
Technical Update: Watching Record Highs
Since reaching its 184.48 high on August 12th, NVIDIA has twice attempted to break and close above this resistance, on August 28th and September 22nd. The latest attempt did set a new intraday high of 184.55, but as the chart below shows, resistance held again by the close, triggering another sell-off from that level.
This price action confirms the 184.48/184.55 range as a potentially key resistance area. A successful close above it could lead to a further phase of price strength.
While not a guarantee of continued upside, a closing break above 184.48/184.55 could open the path to 192.14, a level equal to the 38.2% Fibonacci extension. If this level were to also give way on a closing basis, the next resistance may prove to be 196.91, which is the higher 61.8% extension.
Of course, with resistance at 184.48/184.55 still capping price strength, there's also the risk that support levels could give way, possibly suggesting further downside in price activity.
Initial support may now be marked by 175.11, the Bollinger mid-average, which is currently containing the latest pullback in price. While a close below here may not confirm extended price weakness, it might open the door to test lower supports at 168.41, which is the September 17th low, possibly even 164.07, a level equal to the September 5th extreme.
The material provided here has not been prepared accordance with legal requirements designed to promote the independence of investment research and as such is considered to be a marketing communication. Whilst it is not subject to any prohibition on dealing ahead of the dissemination of investment research, we will not seek to take any advantage before providing it to our clients.
Pepperstone doesn’t represent that the material provided here is accurate, current or complete, and therefore shouldn’t be relied upon as such. The information, whether from a third party or not, isn’t to be considered as a recommendation; or an offer to buy or sell; or the solicitation of an offer to buy or sell any security, financial product or instrument; or to participate in any particular trading strategy. It does not take into account readers’ financial situation or investment objectives. We advise any readers of this content to seek their own advice. Without the approval of Pepperstone, reproduction or redistribution of this information isn’t permitted.
The Bear Market Isn't Coming? Old BTC Playbook is a TrapFor years, traders have relied on Bitcoin's predictable cycles. We look for the same clues, the same topping signals, and the same patterns. But what if the market has evolved? What if the playbook we've all been studying is now a trap?
This analysis dives deep into key indicators across all three major bull runs, comparing the RSI, MACD, Volume, and especially the Bollinger Band Width Percentile (BBWP). The data suggests that while some classic bearish signals are flashing, the market's underlying structure is telling a very different, and potentially much more bullish, story.
A Tale of Two Cycles: The Historical Baseline
To understand where we are, we must first look back.
The First Bull Run (2015-2017): This cycle was defined by raw, explosive power. The weekly RSI crossed above 80 a staggering four times. However, the end was confusing. We had bearish RSI divergences fighting against bullish MACD. The primary exit signals were a massive spike in selling volume and a BBWP reading that finally hit 94%, signaling trend exhaustion. It was effective, but messy.
The Second Bull Run (2018-2021): This cycle top was much clearer and became the "classic" model for many traders. The RSI crossed 80 only twice, and the end was signaled by a textbook combination of:
Classic bearish divergences on the RSI and MACD.
Obvious selling pressure at the top.
Crucially, the BBWP spectrum crossed 90% three separate times, screaming trend exhaustion before the final downturn.
The Current Cycle: A New Breed of Bull 📈
Now, let's analyze our current cycle, which began in November 2022. On the surface, some things look familiar, but the engine of this trend is behaving in a completely unprecedented way.
The Familiar Signs (The Bear Case):
Yes, we can see a classic bearish divergence forming on both the RSI and MACD. Furthermore, the recent buying volume, while still okay, is showing signs of weakness compared to the explosive start of the rally. This is what is causing many analysts to call for a cycle top, just like before.
The Unprecedented Anomalies (The Bull Case):
This is where it gets interesting and why the old playbook may fail.
No BBWP Exhaustion: Unlike the (2015-2017) (2018-2021) bull runs, the BBWP spectrum has not crossed 90% a single time during this entire uptrend. The volatility has never reached the levels of euphoria and exhaustion that marked previous tops. The trend, while strong, has not shown signs of being "finished."
The Contraction Anomaly: This is the most compelling signal on the chart. Historically, a major BBWP contraction (the indicator squeezing down) signals that energy is building for a massive expansion in price. This event has almost always marked the beginning of a new bull phase or the start of a major move up. Yet, here we are at the supposed end of the cycle, and the BBWP is contracting again. This has never happened at a cycle peak before. This odd behavior suggests that instead of winding down, the market could be coiling up for another powerful move, Also the number of contractions in this cycle is much higher than the pervious cycles which explains the elliot waves unexpected targets
Elliott Wave Strength: While I have not drawn the Elliott Wave count here because every trader's interpretation can be subjective, my personal count indicates that the current wave structure is targeting prices significantly higher than the current all-time high.
Summary and Final Thoughts
To summarize, while we have some classic, textbook bearish signals that would have marked the top in (2018-2021), we also have powerful, unprecedented evidence suggesting this cycle is different.
The lack of a BBWP exhaustion signal (>90%) is a major deviation from the last 2 cycle top.
The current BBWP contraction at a "cycle end" is a massive anomaly. This is typically a pre-trend signal, not an end-of-trend signal, and could be hinting at a major breakout ahead.
This is not a guarantee of a continued bull run, but rather a data-driven observation that the market is showing a structure we haven't seen before. Relying solely on the old playbook could be a mistake. The market is evolving, and our analysis must evolve with it.
I have marked every anomaly and pattern on the chart, You can zoom in and analyze for yourself
I'm open to all discussions and opinions in the comments
Trade safe and keep an open mind.

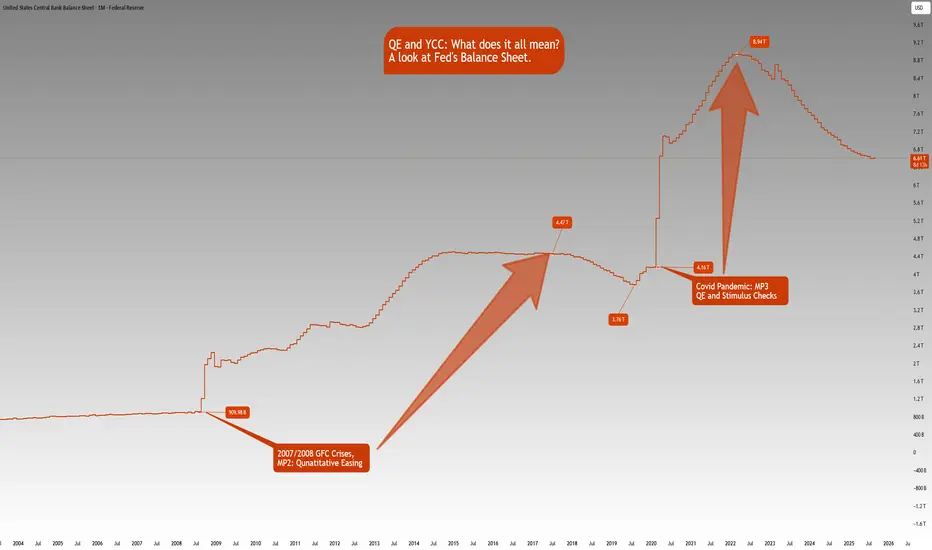
QE and YCC: What does it all mean?ECONOMICS:USCBBS
CBOT:ZB1! CBOT:ZN1! CME_MINI:NQ1!
There is growing market speculation that the Fed may tolerate inflation above 2% for longer, consistent with its Average Inflation Targeting (AIT) framework introduced in 2020.
This also implies that real rates i.e., nominal rates minus inflation are likely to fall significantly. Given this, we anticipate gold to continue trending higher as the U.S. dollar's purchasing power erodes with mounting debt, persistently higher inflation, and falling real yields.
What is QE?
Quantitative Easing (QE) refers to the Fed injecting liquidity into financial markets by purchasing large quantities of assets such as Mortgage-Backed Securities (MBS) and U.S. Treasuries, especially during periods of economic stress like the Global Financial Crisis (2007–2008) and the COVID-19 downturn.
How Does QE Work?
Asset Purchases: The Fed buys large volumes of Treasuries and MBS from financial institutions.
Balance Sheet Expansion: These purchases expand the Fed's balance sheet (now hovering near $6.6 trillion, per FRED).
Increased Liquidity: Banks receive excess reserves in exchange, increasing system-wide liquidity.
Lower Interest Rates: Demand for bonds pushes prices higher and yields lower.
Economic Stimulus: Lower borrowing costs promote credit creation, investment, and consumer spending.
However, a key drawback of QE is asset price inflation. As seen between the GFC and the COVID-19 pandemic, low rates and excess liquidity drove significant appreciation in equities, housing, and other financial assets, even while consumer inflation remained near target.
QE vs. Stimulus Checks
If traditional interest rate policy is Monetary Policy 1 (MP1), then QE is MP2. Stimulus checks, or government handouts, fall under MP, a fusion of monetary and fiscal policy.
While QE primarily injects liquidity into financial institutions, stimulus checks inject purchasing power directly into households. This approach where the Treasury issues debt and the Fed purchases that debt, stimulates demand for real goods and services. We saw this during the post-COVID recovery, which brought a sharp rebound in consumer activity but also a surge in inflation, reaching a peak of 9.1% in June 2022 (CPI YoY).
QE impacts Asset Price Inflation
Stimulus Checks impact Goods & Services Inflation
What is YCC? (Yield Curve Control)
Yield Curve Control (YCC) is a policy whereby the central bank buys government debt across various maturities to control yields not just at the short end (via rates), but across the entire yield curve.
A prime example is the Bank of Japan, which has used YCC since 2016 to anchor 10-year JGB yields near zero. The Fed has not formally adopted YCC, but market participants believe it may lean in that direction in the future especially during crises where long-end rates rise undesirably. Mounting US debt and rising long end yields may prompt the Fed to step in and adopt YCC like BoJ has done previously.
Front-End Control: Managed via policy rates
Long-End Control: Central bank buys 5Y, 10Y, 20Y, 30Y Treasuries to anchor yields
Potential Risks of YCC:
Credibility Risk: If inflation rises while the central bank suppresses yields, it may lose market trust.
Currency Pressure: Artificially low yields may trigger speculative pressure on the currency (as seen with the yen under BoJ YCC).
We’ve kept this concise and digestible for now, but there’s more to unpack—especially on the long-term implications of coordinated monetary-fiscal policy (MP3), debt sustainability, and central bank credibility.
The Fed’s balance sheet chart shows how Fed’s balance sheet has increased:
Aug 1, 2008: $909.98B
Jul 1, 2017: $4.47T
Aug 1, 2019: $3.76T
Feb 1, 2020: $4.16T
Mar 1, 2022: $8.94T
Aug 1, 2025: $6.61T
Note that this is not just a US phenomenon. It is a world wide phenomena looking at many of the developed and emerging markets. The Debt to GDP ratios are increasing, Central Banks balance sheets are rising in tandem with rising government debt.
With the rate cutting cycle starting, it is a matter of time that we also see QE restarting.
If you’d like us to dive deeper into any of these topics in future educational blogs, let us know. We're happy to build on this foundation with more insights.