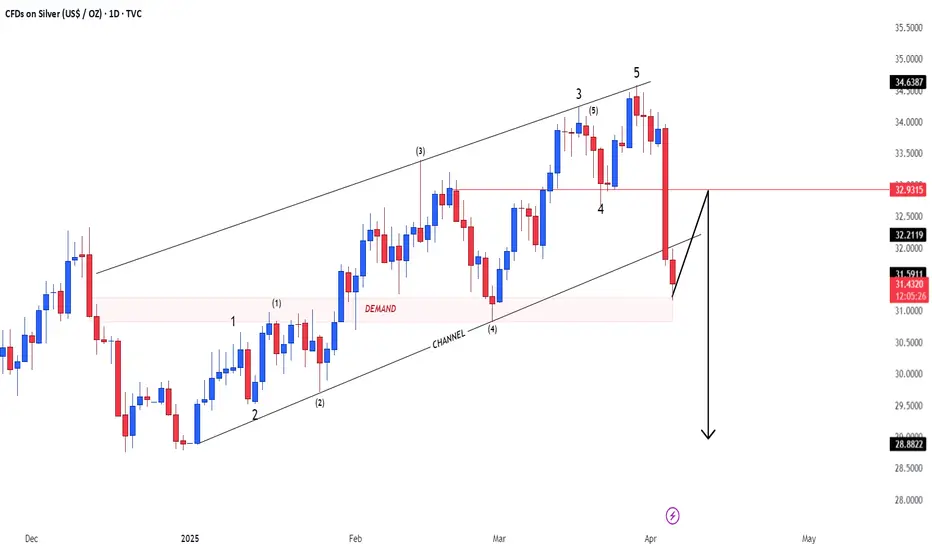
Silver could drop 2k+ pipsSilver has been on the rise recently, but unlike its big brother, Gold, it started rolling back down on Friday—even as Gold continued to print new all-time highs, culminating at 3,150 yesterday.
This divergence between the two metals could be an early sign that Silver is losing momentum.
___________
Key data points
About Silver / U.S. Dollar
Silver Prices have been followed for centuries. Silver (XAG) is a precious metal used in jewelry, silverware, electronics, and currency. Silver prices are widely followed in financial markets around the world. Silver has been traded for thousands of years and was once used for currency backing. Silver continues to be one of the most commonly traded commodities today. Silver prices are highly volatile due to speculation and supply and demand. Ag is the chemical symbol for silver on the periodic table of elements and its ISO currency symbol is XAG.
No news here
Looks like there's nothing to report right now

Could the Silver reverse from here?The price is rising towards the pivot which has been identified as a pullback resistance that lines up with the 138.2% Fibonacci extension and could reverse to the 1st support which is an overlap support.
Pivot: 34.86
1st Support: 32.94
1st Resistance: 36.08
S&P500 (US500) is falling towards the

XAG/USD Rising Wedge Breakdown To Bearish Trade Setup1. Overview of the Chart
This chart represents Silver (XAG/USD) on the 4-hour timeframe from the OANDA exchange. The price action has formed a Rising Wedge pattern, which is a classic bearish reversal formation. This suggests that a potential breakdown could lead to a significant decline in price.

Bullish momentum to extend?The Silver (XAG/USD) has bounced off the pivot and could rise to he 1st resistance.
Pivot: 33.56
1st Support: 33.09
1st Resistance: 34.91
Risk Warning:
Trading Forex and CFDs carries a high level of risk to your capital and you should only trade with money you can afford to lose. Trading Forex a

SILVER: Long Signal Explained
SILVER
- Classic bullish pattern
- Our team expects retracement
SUGGESTED TRADE:
Swing Trade
Buy SILVER
Entry - 29.598
Stop - 28.563
Take - 31.789
Our Risk - 1%
Start protection of your profits from lower levels
Disclosure: I am part of Trade Nation's Influencer program and receive a mon

Get Ready for the Silver Surge!🚀 Get Ready for the Silver Surge! 🚀
Hey there, silver enthusiasts! 🌟
We're diving into an exciting trend that’s shaping up right at the golden crab level—yes, we’re talking about that sweet spot of **$28.5!**
This is your chance to capitalize on the impending rise in silver prices! With all indic


Silver looking like a good buy on technicals, $34 targetI am putting on a small silver position, it really likes to bounce off the up sloping resistance line that is in orange, also indicated by the orange circles where it previously bounced. Good luck and please do your own research. Not financial advice.

See all ideas
Displays a symbol's price movements over previous years to identify recurring trends.