BTC Breakdown: Watching 112.6K-113.5K for Rejection Toward 109kHello guys!
Trend Structure:
The price was moving in a clear ascending channel, but recently broke down below the lower boundary with strong bearish momentum. This confirms a structural shift from bullish to bearish sentiment.
Current Price Action:
After the breakdown, BTC attempted a relief rally but is now struggling around the 112,682 – 113,581 resistance zone (marked in blue). This area was previously support inside the channel and is now acting as resistance (role reversal).
Scenarios (Entries):
Rejection at 112,682 zone:
If BTC fails to break above this resistance, sellers could step in and push the price lower. A clean rejection here would open the way toward 109,884 (next major support).
Deeper pullback to 113,581:
If bulls manage to push higher, the 113,581 level becomes the last line of resistance. A rejection here would be a high-probability short entry, also targeting 109,884.
Target Zone:
Both rejection scenarios point to 109,884 as the key downside target. A break below that level would increase bearish momentum toward 108,000 and possibly lower.
Community ideas

XAUUSD Long: Bullish Momentum to ContinueHello, traders! The price auction for XAUUSD has been in a strong bullish phase, confirmed by the establishment of a well-defined ascending channel. This uptrend was initiated after a breakout from lower levels and has shown significant strength by pushing through multiple prior resistance areas, including the 3470 DEMAND 2 and 3675 DEMAND levels, turning them into new support.
Currently, the price action is continuing its ascent within the upper portion of this ascending channel, indicating that the bullish initiative remains firmly in control. The market is in a clear expansion phase, with very little sign of significant selling pressure, suggesting that any pullbacks are likely to be minor and short-lived.
My scenario for the development of events is a direct continuation of the current bullish momentum. I believe that the price will only make a shallow correction from the current levels before the next impulsive wave higher begins. In my opinion, the underlying trend is strong enough to carry the price to a new high within the channel. The take-profit is therefore set at 3835 points, targeting the upper resistance line of the channel. Manage your risk.

Bear market has startedThe End of the Bull Cycle. Why I'm Selling Everything and Won't Buy Again Until September 2026.
For the last year and a half, I have said that we are in a bull market. I never once changed my opinion. But all things come to an end. The time has come.
September 13, 2025, the date I have been mentioning across my social media, was, in my opinion, the peak of this market cycle. As painful as it may sound, the bull market is over.
"Altseason" is a Scam. It's Time to Grow Up
Let's be honest. The "altseason" that everyone was dreaming of never happened. Yes, there were pumps on selective, mostly new coins. But the old guard, for the most part, showed nothing.
Therefore, I want to officially declare: I will never use the word "altseason" again. It's a meme from 2017. There are now over a million coins on the market. Liquidity is so diluted that pumping everything is impossible. Instead of "altseason," we have, and always will have, "selective pumps" driven by interested players. Our job is to learn how to find them, not to wait for a mythical wave that will lift all boats.
Why Now? The Classic Signs of a Top
I wouldn't be so certain if I didn't see the classic signs of euphoria that always appear at the top of a cycle:
- Universal Optimism: Governments are embracing crypto, creating reserve funds.
-Corporate Buying: Public companies are massively buying Bitcoin and Ethereum.
-Positive News: The media is filled with only positive news; no one wants to sell and is waiting for $200k, $300k, $500k.
When the crowd rushes into the market, smart money begins to exit. I prefer to be with the latter.
My Personal 2-Year Plan. Maximum Transparency
I'm not just saying the market will fall. I am publicly sharing my plan of action:
1. I am exiting the market into stablecoins NOW. I am locking in my profits.
2. I will NOT be buying the first correction. When Bitcoin drops to $90,000, most people will be buying, thinking it's a discount. I will not.
3. I plan to start actively buying again in September 2026.
Why so long? Because those who buy at the $90-100k mark risk sitting through two years of psychological and financial drawdown just to break even. I am not willing to pay that price. I won't disconnect from the market; I'll keep my finger on the pulse, but I don't plan on making any active buys.
Cycles Work. My Technical Rationale
My decision is not based on emotion but on cycle theory, which I have tested for years. The cycle consists of ~151 weeks of growth and ~51 weeks of decline. We have just completed the growth phase. The period between September 13 and October 6 is the exact reversal zone after which a decline should begin.
I could be wrong. No one can be right all the time. Perhaps the cycle theory will break this time. But I trust my system.
Conclusion: What's Next? The Long-Term View
I have not become a bear forever. I believe Bitcoin will hit $300,000. But not in the coming months. It will be worth that in 2.5 years, after a healthy 50-60% correction from the peak.
From this moment on, my bias is bearish. On strong upward bounces, I might even open short positions. A new game is beginning, with new rules. My job is to preserve my capital and multiply it in the next cycle. What about yours?
Why bear market started now Proofs:
Best regards EXCAVO

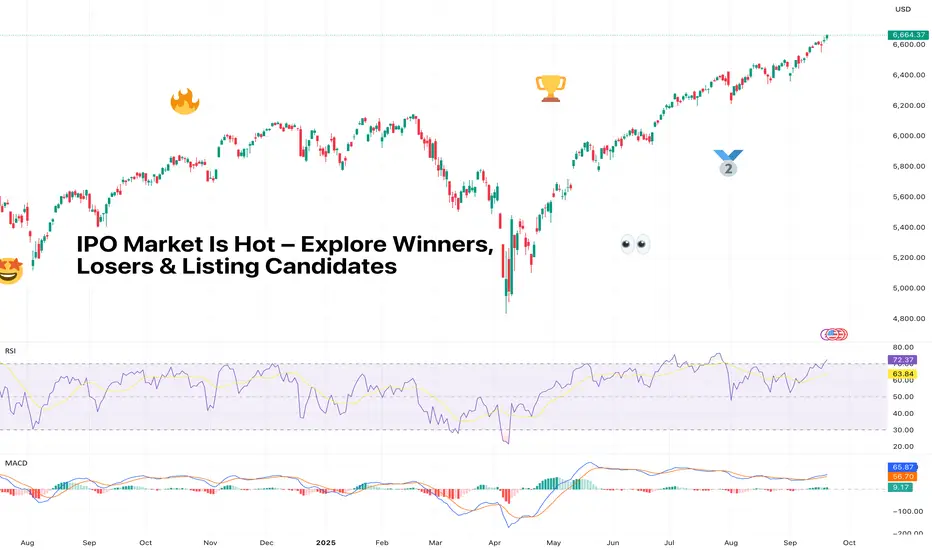
IPO Market Is Hot – Explore Winners, Losers & Listing CandidatesThe IPO market has woken up from its multi-year nap and is now in beast mode. But as always, Wall Street’s hottest party comes with an entrance fee and a dose of uncertainty – opaque prices, sketchy balance sheets, and a whole lot of FOMO.
So who’s winning, who’s losing, and who’s still waiting in the pipeline? Let’s find out.
🚀 The IPO Mania Returns
After years of drought, IPO mania is back in full swing. More than 150 companies have listed this year – up from 99 at this point in 2024 and just 76 in 2023, according to Renaissance Capital.
Together, they’ve raised nearly $30 billion, compared with $24 billion last year. First-day gains? Averaging 26%, the best since 2020. IPOs aren’t just back, they’re back with conviction.
Renaissance estimates we could see 40–60 more deals before the year is out. In other words, if you thought you missed the fun, the afterparty’s still ahead.
🤗 The Winners
Some debuts have been straight out of an IPO fantasy league.
Circle NYSE:CRCL , the stablecoin issuer, lit up the screens with a jaw-dropping 168% surge on its first trading day.
Firefly Aerospace NASDAQ:FLY , a rocket and lunar lander, blasted 30% higher on its IPO day, living up to its name.
Klarna NYSE:KLAR didn’t exactly moon, but a 15% pop for a lossmaking buy-now-pay-later firm isn’t shabby in this environment.
Then there’s Figure NASDAQ:FIGR , the blockchain-native mortgage lender. Since its listing in mid-September , it’s up 44% even after a midweek stumble. Investors love a fintech-meets-crypto mashup story – and Figure is playing it well.
Who said Figma NYSE:FIG ? The design software maker went vertical in its market debut , although reality has since slapped it down from those frothy day-one highs. Still, design nerds everywhere are proudly watching their favorite platform make its way up the rankings among the world's biggest software companies .
😭 The Losers
Not every IPO has the golden touch.
StubHub NYSE:STUB , the ticketing platform, came in hot with an 8% intraday pop above its $23.50 listing price, only to end its first session underwater at $22 . The days after? Even worse – the stock is floating near the $18 mark.
CoreWeave NASDAQ:CRWV , the AI up-and-comer, is a really interesting one. First off, it stumbled at the start after pricing its shares at $40 to float in March.
It traded under its IPO price for a while before clawing back with AI hype fueling the shares by 450% May through June. Then insider selling knocked the winds out of its sails in August.
Now it’s gravitating at triple its offering price, proving IPOs are a marathon, not a sprint.
🎲 The Pricing Game
The truth is, IPO pricing is as much science as it is art (and sometimes performance art). Investment banks like Goldman NYSE:GS , Morgan Stanley NYSE:MS , and Citi NYSE:C run the roadshows, build the books, and set the price. Oversubscribed IPOs often guarantee a strong open. Undersubscribed ones? Crickets.
Bears hate this one simple trick: most IPOs only float about 15–20% of the company. That tiny slice of tradable shares means volatility is baked into the flotation. Throw in a 180-day lockup (when insiders can’t sell), and early trading is a weird mix of price discovery and pure speculation.
💡 The Fundamentals Still Matter
The hype is real, but the numbers don’t lie. Valuations on some of these newly public firms are eye-watering. Circle trades at 130x earnings estimates, Figma at 184x. Compare that to Adobe’s 5x and you see how far the IPO froth can go.
Meanwhile, many of these firms aren’t consistently profitable. They post alternating quarters of red ink and black ink while investors cheer growth over everything.
🦄 Unicorn Watch: Who’s Next?
Here’s who’s buzzing on the IPO radar and what they’re worth in 2025:
• OpenAI, AI overlord, $500 billion
• SpaceX, rockets and satellites, $450 billion
• xAI / x.com, Elon Musk’s AI play, $200 billion
• Anthropic, OpenAI rival, $190 billion
• Databricks, data and AI analytics, $100 billion
• Stripe, payments giant, $92 billion
• Revolut, digital banking, $75 billion
• Canva, design platform (and your CV maker), $42 billion
• Fanatics, sports merch and betting, $30 billion
• Discord, chat for gamers (and everyone else), $15 billion
• Solera, software and data for auto and insurance, $10 billion
• Grayscale, crypto asset manager (part of Digital Currency Group), $10 billion
• AlphaSense, market intelligence, $4 billion
• Wealthfront, robo-advisor, $2 billion
• Quora, knowledge-sharing platform, $500 million
📉 The Risk of Chasing
So should you pile in? Here’s the trader’s dilemma: first-day pops are seductive, but inflated pricing means you’re often exit liquidity for early investors.
Waiting a few days, weeks, or even months for the froth to fade, lockups to expire, analyst coverage to roll in, and the hype to cool may be the smarter play.
🫶 Final Take
The current IPO season is hot, but so is the risk. But every IPO is different. Circle shows monster returns are possible, while StubHub proves not every ticker deserves a ticker-tape parade.
The winners? Companies with strong fundamentals (not just growth, but profits) and a story that Wall Street loves right now (AI, crypto, fintech).
The losers? Overpriced firms without consistent performance. The candidates? Mega-unicorns waiting for their grand entrance and some smaller players ready to make a splash.
As always, timing is everything. Here’s to hoping your favorite IPO won’t list right after a hawkish Jay Powell.
Off to you : What IPOs are on your radar for this year and the next? Share your thoughts in the comments!
INDV - Helping Trump Fight The Drug War In The US and Overseas.Thought this was a good example of the kind of stock I like to trade.
Not all of these have to be true to make it tradable. Just things I like to see.
Up over 100% over the last 12 months
Nice and steady price gains continuing to make higher highs
Had a good bump on earnings
Has had a recent pullback of 10-15% into a better value area as investors took some profits
Looks like it consolidated and established a support area
Analysts are bullish and think there is quite a bit of upside to its price
Starting to head back up
RSI and MACD both show a change in direction and buyer momentum coming back into the stock
Could be worth a watch.

Nvidia Returns to Yearly Highs on Temporary Boost in ConfidenceNvidia’s stock started the week with a gain of more than 4%, maintaining a steady bullish bias after it was announced that the company will invest over $100 billion in OpenAI to support the development of artificial intelligence infrastructure. As part of the agreement, Nvidia is expected to receive OpenAI shares as compensation. This move reflects both companies’ commitment to sustained growth in the AI industry and suggests that Nvidia views this project as a key step to strengthen its position beyond microchip production, seeking to consolidate itself as a strategic player in the sector over the long term. For now, market confidence has fueled buying pressure, and if further announcements are made, this trend could continue to dominate in the short term.
Short-Term Sideways Range at Risk
In recent weeks, Nvidia’s price had been moving within a sideways range, with a ceiling near $183 per share and a floor around $162. However, the latest bullish momentum is pushing the stock to test this resistance. If buying pressure holds, the range could break out and pave the way for a more relevant bullish bias in the coming sessions.
RSI
The RSI line remains above the neutral level of 50, showing that short-term bullish momentum has begun to dominate the average of the last 14 sessions. As long as this trend continues and the indicator does not enter overbought territory, buying pressure could become even more relevant in the short term.
MACD
The MACD histogram has started to show oscillations above the neutral 0 level, suggesting that the average strength of the moving averages has entered a steady bullish zone. If this signal persists, it could open the door to a stronger bullish bias in the short term.
Key Levels to Watch:
$183 – Yearly Resistance: Marks the yearly high and is the most important barrier in the short term. A sustained breakout above this level could drive the continuation of the broader bullish trend seen in recent weeks.
$173 – Nearby Barrier: Aligns with the zone marked by the Ichimoku cloud. Price action around this level could generate neutrality and extend the ongoing sideways formation.
$162 – Critical Support: Matches the 100-period moving average and the 23.6% Fibonacci retracement. A break below this support would activate a more relevant bearish bias, opening the door to a short-term downtrend.
Written by Julian Pineda, CFA – Market Analyst

Supreme Court ruling could lift gold further Gold has climbed $410 over the past four weeks, reaching ~$3,750 today after an additional ~$60 gain.
The combination of political risk, questions over central bank independence, and robust technical momentum has positioned gold as one of the best performing assets.
The Supreme Court has apparently scheduled arguments for December on the issue of whether President Trump can fire Fed governor Lisa Cook, and install another stooge like Stephen Mirin in her place. Such a precedent could further boost safe-haven demand for gold, as it could pave the way for the dismissal of other governors.
Support levels: Initial support sits at $3,660, followed by the breakout region around $3,515. As long as these levels hold, the broader bullish structure remains intact.
Momentum: Recent candles show strong buying pressure with limited pullbacks, indicating that buyers remain firmly in control.

NZDUSD to find buyers at previous swing low?NZDUSD - 24h expiry
The selloff is close to an exhaustion count on the intraday chart.
We expect a reversal in this move.
Risk/Reward would be poor to call a buy from current levels.
A move through 0.5875 will confirm the bullish momentum.
The measured move target is 0.5900.
We look to Buy at 0.5840 (stop at 0.5820)
Our profit targets will be 0.5895 and 0.5900
Resistance: 0.5875 / 0.5895 / 0.6000
Support: 0.5850 / 0.5840 / 0.5825
Risk Disclaimer
The trade ideas beyond this page are for informational purposes only and do not constitute investment advice or a solicitation to trade. This information is provided by Signal Centre, a third-party unaffiliated with OANDA, and is intended for general circulation only. OANDA does not guarantee the accuracy of this information and assumes no responsibilities for the information provided by the third party. The information does not take into account the specific investment objectives, financial situation, or particular needs of any particular person. You should take into account your specific investment objectives, financial situation, and particular needs before making a commitment to trade, including seeking, under a separate engagement, as you deem fit.
You accept that you assume all risks in independently viewing the contents and selecting a chosen strategy.
Where the research is distributed in Singapore to a person who is not an Accredited Investor, Expert Investor or an Institutional Investor, Oanda Asia Pacific Pte Ltd (“OAP“) accepts legal responsibility for the contents of the report to such persons only to the extent required by law. Singapore customers should contact OAP at 6579 8289 for matters arising from, or in connection with, the information/research distributed.

ANFIBO | BTCUSD Analysis – Weekly Trading PlanHi guys! It's me, Anfibo. My plan last week gave us a good profit selling from 118,000 USD to 115,000 USD.
And over the past weekend, BITSTAMP:BTCUSD consolidated in a sideways range, consistently holding above key support. However, with the opening of the new week’s Daily candle, the market decisively broke down through this support zone, signaling that selling pressure is now taking clearer control.
From a technical perspective, the next critical support levels to monitor are:
• $113,000
• $111,000
• $109,500
Around the $110,000 region, I view this as a pivotal area to consider initiating spot entries or building larger long-term positions. This zone is not only a technically strong support level but also carries significant psychological weight for institutional and large-scale flows.
Imo, in the short term, BTC may still attempt a retest of the $115,000 level before resuming its downward trend, depending on lower-timeframe reactions. This creates an opportunity for traders to capitalize on corrective moves.
>>> My Trading Plan for the Week:
(1) SELL SCALP:
– ENTRY: around 115,000
– SL: 117,000
– TP1: 113,000
– TP2: 110,000
(2) BUY SETUP:
- ENTRY: 109,000 - 111,000
- SL: 107,000
- TP1: 117,500
- TP2: 122,000
- TP3: 128,000
This strategy is designed for short-term trades, taking advantage of volatility within the current range. For long-term investors, patience will be key—waiting for BTC to approach $110,000 or lower provides a strategic opportunity to restructure portfolios and scale into positions at more favorable prices.
👉 Conclusion: BITSTAMP:BTCUSD has broken out of its weekend consolidation and is now entering a fresh leg down. Short-term traders should look to sell corrective bounces, while long-term investors should focus on accumulation opportunities near $110,000 - a level that could serve as a “strategic entry” for the upcoming cycle.
WISH EVERYONE A NEW WEEK FULL OF ENERGY! ;)

NIKE BREAKDOWN (NKE)...POTENTIAL LONG OPPORTUNITYHey hey Tradingview family!!! Joseph here AKA JosePips! Just wanted to come on this week and do a breakdown on the company Nike & what I see technically potentially happening next on this stock! In this video you will get a in depth breakdown of
1. Overall price action structure/context
2. Momentum & understanding how momentum can be used in your trading
3. Supply & Demand principles
4. Technical confluence & how to really use indicators to build your edge in trading
So I hope you guys enjoy this video and breakdown!! Boost this post & follow my page for more content!
Cheers!

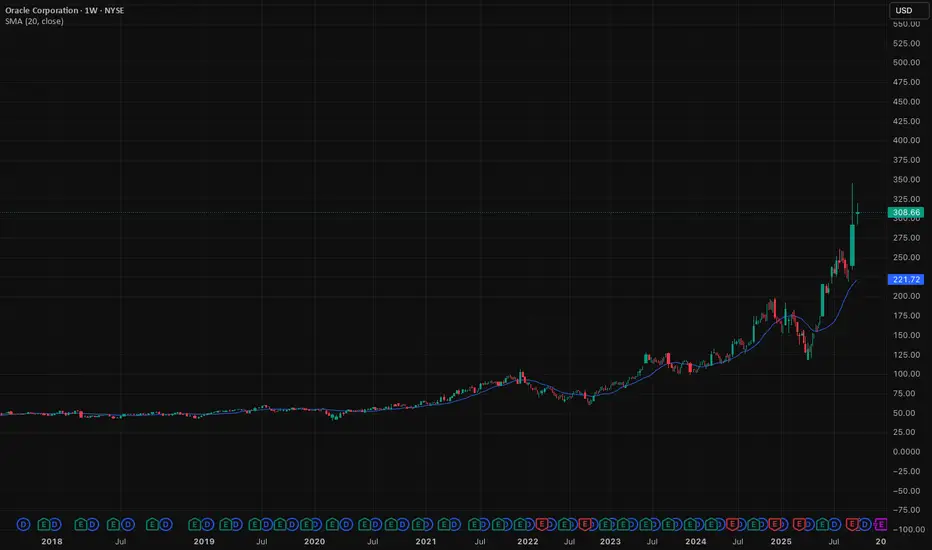
Oracle's surge is a bull market warningOracle has become the latest torch bearer of this market’s fever. A sharp, double-digit jump in days. Not because of numbers on a balance sheet, but because of mood. Sentiment is running wild, and traders are piling in.
These are the signs of caution experienced traders take during bull markets.
This market doesn’t need fundamentals. It needs stories. Oracle provided one, AI, cloud infrastructure, and firming whispers of a TikTok tie-up. That’s all it takes in a market already priced for perfection. The hotter the tape, the more dramatic the reactions.
The narrative is seductive. Media and enterprise tech converging. Old-guard software reborn as a cloud giant. These are big, glossy ideas. But when valuations are stretched, stories become more dangerous than compelling.
We’ve seen this play out before. In hot markets, price runs ahead of reality. Crowds cheer the breakout, analysts upgrade, and traders convince themselves this time is different. Then something shifts. Sentiment cracks. The same names that soared, collapse first.
Oracle is not the problem. It’s the signal. A sign that markets are running on fumes of optimism. The Nasdaq is back to trading at extreme multiples. Liquidity is abundant, and money is chasing flash. When that music stops, the hangover will be sharp.
Caution is the trade here. Oracle’s rally is not a testament to strength. It’s evidence of a market too eager to believe its own stories.
The forecasts provided herein are intended for informational purposes only and should not be construed as guarantees of future performance. This is an example only to enhance a consumer's understanding of the strategy being described above and is not to be taken as Blueberry Markets providing personal advice.
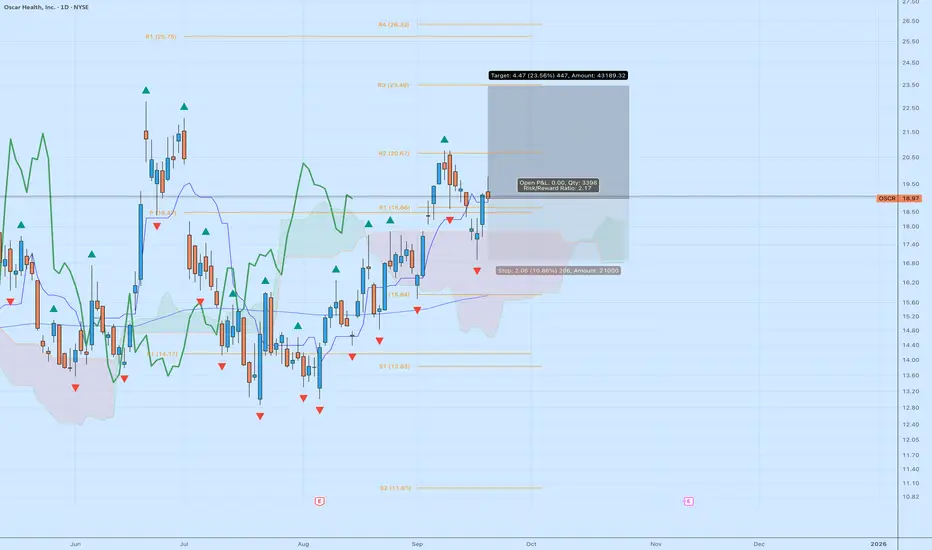
Oscar Health (OSCR) – Risk/Reward Setup Worth WatchingI’m tracking a long setup on NYSE:OSCR after a strong recovery trend that has been quietly building since the summer. It’s carving out a technical structure that offers a clean risk/reward.
Company Context
Oscar Health is a tech-driven health insurance company that’s been rebuilding its story in 2024–2025. With a focus on digital-first healthcare plans and partnerships, it’s been reducing losses and narrowing its path toward profitability. Investors are beginning to treat it less like a speculative health-tech play and more like a managed care turnaround. That shift alone can fuel momentum as institutions re-rate the name.
Technical Breakdown
Entry Zone: Around $18.90, just above the daily pivot (P: $18.51) and prior breakout support at $18.66.
Ichimoku Cloud: Price is holding above the cloud, with the leading span showing a bullish tilt. This suggests trend support into October if buyers defend current levels.
Moving Averages: OSCR is trading above its 50-day average and bouncing off the short-term Kijun line — a healthy pullback/retest dynamic.
R Levels: Resistance to watch sits at R2 ($20.67) and R3 ($23.49). Targeting these aligns with a potential 23% upside move.
Stop Placement: My risk is anchored near $16.80–$17.00 (just below R1/Pivot cluster and cloud support). That’s roughly -11%.
Reward: Upside target $23.49–$24.00 gives ~+23%. That’s a 2.1:1 reward-to-risk profile.
Why It’s Interesting
OSCR has been building higher lows since May, which is constructive in a volatile market.
The current consolidation looks like a platform for continuation, especially if it can break and hold above $20.
Liquidity is decent for a mid-cap, and options flow has been showing unusual activity recently (call side).
Risks to Monitor
As an insurance stock, OSCR is tied to regulatory headlines and policy changes.
Earnings volatility can be sharp — a stop discipline is key here.
Broader market sentiment could swamp this setup if risk-off flows dominate.
My Take:
This isn’t a “bet the farm” play, but OSCR gives traders a very tradable setup: clear support, well-defined stop, and room to run into the low $20s. As long as it holds above the cloud and the $18 pivot zone, I like the long bias.
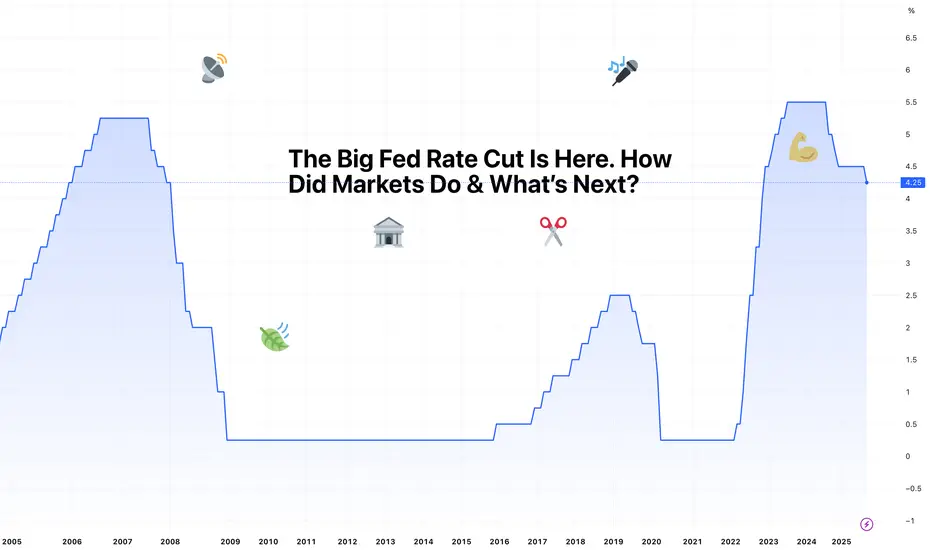
The Big Fed Rate Cut Is Here. How Did Markets Do & What’s Next?“ Best we can do is 25bps ,” officials, probably, when they gathered to lower the federal funds rate. It wasn’t the 50 basis points some of you had expected. But you also didn’t expect to hear that two more trims are most likely coming by year end.
Let’s talk about that and what it means for your trading.
🎤 Powell Delivers
The Federal Reserve finally trimmed rates for the first time in nine months, cutting the federal-funds rate by 25 basis points to 4%–4.25%. This was hardly a surprise.
Markets had already fully priced in a quarter-point move. But the real twist was the Fed boss hinting at two more cuts this year. With just two FOMC meetings on the calendar, it’s pretty clear: unless something changes dramatically, traders should expect a cut at both.
The decision wasn’t unanimous. Newly minted, Trump-appointed Fed governor Stephen Miran wanted to go big or go home with a 50bps slash. Powell, though, balanced his message by saying risks to the labor market had grown while inflation was still running at 2.9% (way above target).
What does this mean? The Fed’s dual mandate of price stability and full employment is officially leaning toward protecting jobs at the risk of flaring up inflation.
💵 Dollar Takes a Dive
The immediate reaction was classic. A weaker dollar is the natural byproduct of lower rates, and the greenback obliged by sliding against major peers.
The FX:EURUSD pushed toward $1.19, its highest in four years, while the FX:GBPUSD tested $1.37 and the FX:USDJPY sank below ¥146.
For forex traders, this was textbook: lower yields make the dollar less attractive, especially compared to rivals with steadier or higher returns. But that was a reaction to the initial shock.
By early Thursday the dollar bounced back, because markets love to overreact before correcting, but the broader trend is still tilted bearish .
📈 Stocks: Buy the Rumor, Sell the News
Stocks were less enthusiastic. The S&P 500 SP:SPX hovered near flat, the Nasdaq Composite NASDAQ:IXIC slipped 0.3% for a second straight loss, and the Dow Jones TVC:DJI managed to buck the trend with a 260-point climb.
The takeaway? Traders had already bought the rumor of rate cuts, jammed their cash into equities, so when Powell delivered the expected 25bps, it wasn’t enough to light another fire.
The bigger hope lies in those promised future cuts, which could set the stage for another push higher – especially if Big Tech earnings hold up through the third quarter. (For the record, earnings season is almost here.)
Thursday's futures contracts were showing a big jump ahead of the opening bell with Nasdaq futures up by more than 1%.
🟡 Gold Shines, Then Stumbles
Gold OANDA:XAUUSD did what gold usually does when the Fed loosens policy: it powered up. Bullion was surfing on the high point of its all-time record of $3,700, before sliding back under $3,640.
What’s the logic behind rising gold prices and a falling dollar? In a low-yield environment, non-yielding assets like gold look more attractive, and a weaker dollar only sweetens the deal for overseas buyers.
Still, this week’s whipsaw reminded everyone that gold is no straight line up – momentum is there, but so are the bears guarding resistance.
🟠 Bitcoin Shrugs
Crypto was more muted. Bitcoin BITSTAMP:BTCUSD slipped 1.2% after the cut, dipping toward $115,000, only to bounce back above $116,000 the next morning.
For the orange coin, the Fed story is just background noise. Institutional inflows and ETF demand remain the key drivers, and traders are still gauging whether crypto wants to behave like a risk asset or play its “digital gold” role.
Still, the OG coin remains off its $124,000 record from mid-August , the market seems caught between consolidation and correction.
⚖️ The Balancing Act
The Fed’s challenge is clear: unemployment is rising, job gains are slowing , and payrolls have been revised lower for months.
At the same time, inflation has crept back up, with core prices still well above target. Cutting too much risks reigniting price pressures; cutting too little risks a labor-market slide that could snowball into recession.
Powell chose the middle ground – a modest 25bps – and teased with two more to calm investor nerves.
👀 What’s Next?
Markets now have a new playbook: watch every jobs report ECONOMICS:USNFP , every CPI ECONOMICS:USCPI release, and every Powell presser between now and December.
If job creation continues to cool, the Fed will likely follow through with the cuts. If inflation heats up, those cuts may get scaled back. And if both trends stall, expect chop – the dreaded sideways trade that tests everyone’s patience.
What can you do in this situation? One message is to stay nimble. The dollar’s longer-term weakness is reshuffling the forex space, gold is on the cusp of a breakout, and stocks remain in record territory. And crypto is doing its usual unpredictable mood swinging.
In a nutshell, Powell gave markets a gift in the form of liquidity, but as history reminds us, the Fed giveth and the Fed taketh away.
👉 Off to you : What’s your strategy in this market? Now that you have the cut (and two more likely on the way), are you bullish or bearish? Share your thoughts in the comments!
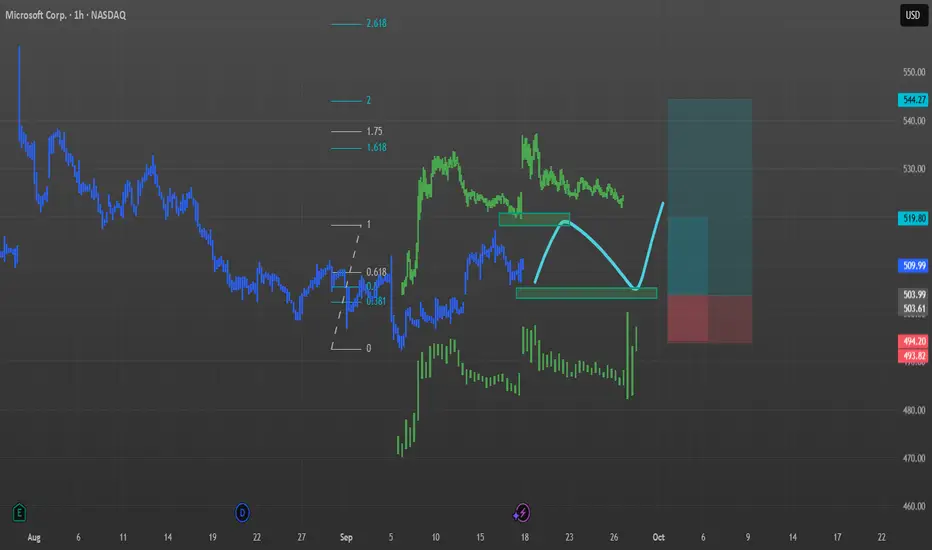
MSFT / MICROSOFT / Fractal and Seasonality inspiredHere is my view on MSFT from seasonal and fractal point of view.
Price gonna break the recent 516 high, shall turn and break recent 505 low than head upside for end of the year ralley.
i put 2 Longs into the chart. Smaller for first partial take profit and the larger one for rest.
All this should play out until 15th of November or latest until End of January.
After January 2026 downside. Be careful!
(This is not a trade call, just educational analysis, trade at your own risk)
Feel free to comment so we can learn and improve together!
Cheers!
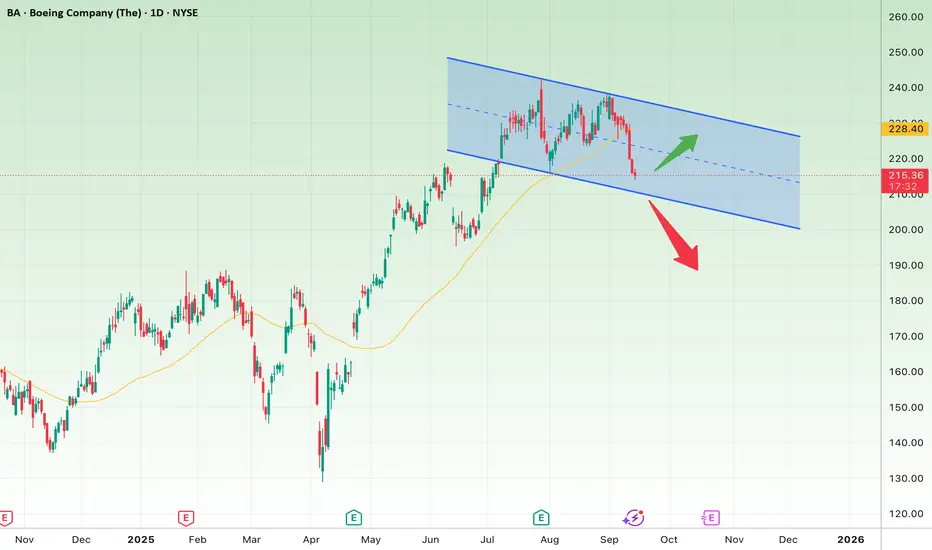
Professional Analysis of Boeing (BA) Stock – Daily TimeframeOn the daily chart, Boeing (BA) has entered a descending channel after a strong rally from the $175 lows up to around $240 highs.
Bullish Scenario:
The price is currently around $215, near the channel’s lower boundary.
If this support holds and the stock reclaims the 50-day moving average (yellow line around $220), a rebound toward the channel’s upper boundary at $228 – $230 is likely.
A confirmed breakout above the channel could open the way toward $240.
Bearish Scenario:
If the $215 – $210 support zone breaks, the stock could slide down to the channel floor around $200 – $198.
A deeper breakdown below that may trigger further downside toward $185.
Conclusion:
Boeing is in a corrective channel. The $210 – $215 zone is a decisive level:
Holding it = potential rebound and short-term upside.
Breaking it = further weakness and extended downside risk.
Bitcoin - Will Bitcoin break out of range?!Bitcoin is above EMA50 and EMA200 on the four-hour timeframe and is in its ascending channel. If the downward trend continues towards the specified demand range, we can buy Bitcoin with appropriate risk-reward.
Bitcoin’s rise to around 121,000 and its arrival at the specified supply range will provide us with its next selling position. It should be noted that there is a possibility of heavy fluctuations and shadows due to the movement of whales in the market and capital management in the cryptocurrency market will be more important. If the downward trend continues, we can buy within the demand range.
Bitcoin continues to fluctuate within the $110,000 to $117,000 range, as reduced capital inflows into ETFs combined with intensified profit-taking exert mounting pressure on its upward momentum. In this environment, the derivatives market—driven by the strong presence of futures and options contracts—plays a central role in balancing and shaping market direction. Profit-taking by 3–6 month holders, alongside losses realized by recent buyers at price peaks, has fueled selling pressure across the market.
On-chain liquidity still maintains a constructive structure, but signs of gradual weakening are evident. Meanwhile, net ETF inflows and outflows have declined to around 500 BTC per day, significantly undermining demand from traditional finance (TradFi), which had previously been a key driver of rallies in March and December 2024.
Following the mid-August all-time high, market momentum steadily weakened, dragging Bitcoin below the cost basis of recent buyers at the top and pushing the asset back into a range-bound structure. The critical question now is whether this reflects a healthy consolidation phase or the beginning of a deeper corrective cycle.
While dip-buyers provided some support, the primary selling pressure originated from experienced short-term holders. Data shows that 3–6 month holders have been realizing approximately $189 million in daily profits (based on the 14-day moving average), accounting for nearly 79% of total short-term holder realized gains. These figures indicate that many investors who entered the market during the February-to-May correction used the recent rally as an opportunity to lock in profits—creating considerable resistance against upward continuation.
In addition to profit-taking from seasoned short-term holders, recent peak buyers also capitulated by realizing losses during the pullback, further amplifying selling pressure. Alongside on-chain dynamics, assessing external demand through ETFs remains crucial, as these instruments have been pivotal in driving the current market cycle.
Since early August, net inflows into U.S. spot ETFs have sharply declined, currently averaging around 500 BTC per day (14-day moving average). This is far below the levels of capital inflows that had previously supported the bullish phase of the cycle, reflecting weakening momentum from TradFi investors. Given the central role of ETFs in fueling Bitcoin’s recent uptrend, the slowdown in flows makes the market’s current structure noticeably more fragile.
Meanwhile, blockchain-based prediction platform Polymarket has announced a new collaboration with Chainlink. The partnership aims to launch 15-minute crypto prediction markets featuring rapid settlement and industry-leading security standards.
The integration of Chainlink’s oracle technology with Polymarket’s trading infrastructure is expected to enhance user access to accurate and reliable data, delivering a new experience in short-term prediction markets. This collaboration could mark a turning point in the development of innovative trading instruments and price forecasting tools.

The Golden Run Continues: XAUUSD Eyes $3800? The Golden Run Continues: XAUUSD Eyes $3800?
Prior Bullish Momentum & Consolidation : XAUUSD entered a period of consolidation following a robust bullish rally earlier in the year. This initial surge established a strong underlying demand.
Symmetrical Triangle Formation : This consolidation phase manifested as a well-defined symmetrical triangle pattern on the 4-hour chart. This pattern typically represents a period of indecision, or accumulation/distribution, before a continuation of the prior trend.
Decisive Bullish Breakout: Gold has now executed a powerful and decisive upward breakout from the upper trendline of this symmetrical triangle. This action confirms the prevailing bullish sentiment and signals the likely resumption of the uptrend.
Key Support Level Established: The former upper trendline of the triangle, now residing around the $3500 mark, has effectively transformed into a critical immediate support level. A successful retest and hold of this level would further validate the breakout.
Strong Upward Trajectory: Post-breakout, the price action has been emphatically bullish, currently exhibiting a steep ascent within the marked green channel, indicating significant buying pressure.
Primary Price Target at Based on the measured move principle, often applied to symmetrical triangle breakouts (projecting the height of the pattern from the breakout point), our primary upside target for XAUUSD is 3800. This implies significant rally potential from current levels.
Disclaimer:
The information provided in this chart is for educational and informational purposes only and should not be considered as investment advice. Trading and investing involve substantial risk and are not suitable for every investor. You should carefully consider your financial situation and consult with a financial advisor before making any investment decisions. The creator of this chart does not guarantee any specific outcome or profit and is not responsible for any losses incurred as a result of using this information. Past performance is not indicative of future results. Use this information at your own risk. This chart has been created for my own improvement in Trading and Investment Analysis. Please do your own analysis before any investments.

The end of Bitcoin…. begins in 40 days time @ ~$160k in Oct 2025** What the next 12 months will look like **
Let’s just start with a strong provocative title to raise the blood pressure.. “The end of Bitcoin”
…. with an explosion and then a slow erosion of relevance, that’s how.
Whether it withers through regulation, succumbs to its own technological limits, or is simply eclipsed by something faster, greener, and more useful, the end of Bitcoin will be a quiet fading of a once radical idea into the background hum of history over the next 12 years.
Can already feel the calls for his head. Take a breath, unclinch your fits, consider the possibility for a moment.
For years Bitcoin stood as a monument to a digital rebellion, a currency without borders or masters promising freedom from central banks and governments alike. Yet the freedom that was marvelled on Bitcoin’s launch was equally celebrated on its loss the day the ETF was active. A currency available to all they chanted, now controlled by the few. The irony.
Diminishing returns
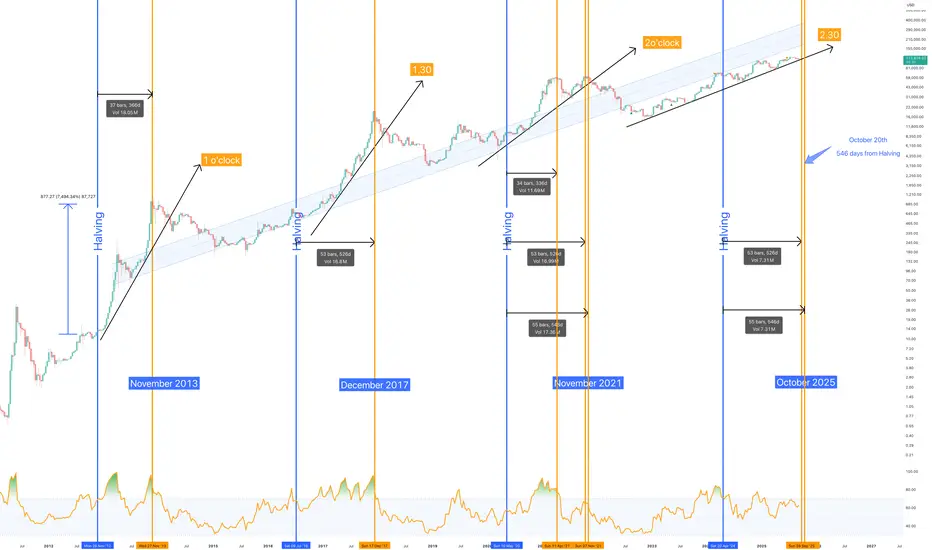
The bitcoin Halving cycles are a great place to start on the story of “How Bitcoin ends”. Bitcoin maximalists will themselves acknowledge this technical observation, post cycle returns are not only diminishing but on the road to disappear forever. It is the reason we've seen 2010-2012 wallets unload on the market those past 2 months. They know.
On the above 2 week chart it is fairly evident the momentum of each cycle is losing steam as the line of support rotates another hour of the clock face for every two cycles. The next halving cycle will complete at 3 o’clock with no measurable return from the 2025 cycle top. Consider that as the talking heads call for $1m+ by 2030.
The influencers and 40 days
Have you noticed influencers talk about the amazing things quarter 4 will bring? “October through December to mint millionaires!” The cringe.
At the height of every market top we see the same smoke and mirrors, “New paradigm” shift mantra. Every other day a new News article on crypto, ft.com is full of them. All red flags as the market top grows closer. Although euphoria is still to return, the time until the top is deterministic.
There’s never been a market top post halving (vertical blue lines) greater than 546 days (vertical orange lines). This value also includes the +/- 5 days price trades at the peak. The last two cycles (2017 and 2021) took 526 days to reach the peak. 2021 gave traders an additional 20 days to exit at the peak. Few accepted while the rest signed up for the 2 year bag holding challenge.
The market top is now between September 28th to October 20th, at most 40 days away from today, if you’re reading this on September 10th, 2025. Yes, perhaps this time will be different, however there’s now 3 out of 4 cycles with less than 546 days (at max) until the cycle top, and the Bitcoin bull market is approaching that value fast. Is this time really going to be different? Influencers certainly think so.
PS: Notice the monthly reduction in market peaks? 2017 = December, 2021 = November, 2025 = October!
40 days / October 20th to $160k - Seriously?
Historical halving to market peaks
2012 Halving: +9,300% to $1,150 in November 2013
2016 Halving: +2,930% to $19,700 in December 2017
2020 Halving: +702% to $69,000 in November 2021
Lower limit
*** 2024 Halving: +160% to $160k in October 2025 ***
Upper limt
*** 2024 Halving: +180% to $180k in October 2025 ***
There’s a whole host of reasons or should I say confluence for this price action forecast too numerous to go into detail. However here’s a couple of standout reasons:
Reason 1
Each new cycle’s return is roughly ~25–30% of the prior cycle’s return. This means the halving to peak return is compressing by a fairly consistent factor in each cycle, close to a “quartering” effect. For this reason the 2025 market top falls between $160k to $180k.
It would also mean the end of Bitcoin as the next cycle peak would be a macro lower high. Consider a cycle 5 (2028 halving) with ~25% of Cycle 4’s return: 25% × 170% ≈ 40–45% return from the 2028 halving to its peak.
A market correction beginning in October 2025 for a new bear market would not be over until the $40-50k area. A 40% return in cycle 5 peaks out at $70k after the 2028 halving, a macro lower high! Remember talking heads are calling for $1m and beyond 2 years later.
If that becomes true, Bitcoin has entered a confirmed macro multi year bear market. A bear market just as long as the bull market from 2010. Such a bear market would not see price action arrested until around $6k in 2039! A long way from Michael Saylor’s $13 million per coin in 2045.
Welcome to the Ponzi scheme.
Reason 2
The Fibonacci 1.618 extension has been an excellent marker for the cycle top, as were previous extensions in previous cycle tops. The market will always react to Fibonacci extensions regardless. Even if you believe Bitcoin will continue to print higher highs and 2026 is going to a very green year for price action.. you must accept price action will react strongly with those extensions, it always has.
But there’s more…. the 1.618 extension for this cycle shares confluence with point number 1. Yes, the quarterly reduction in return forecast of 160% for this Halving is also the 1.618. Dazzled? You should be!
There are many other studies for considering this level as the market top, which is discussed elsewhere.
Conclusions
If history continues to rhyme, the next 40 days may mark not only the top of this cycle, but also the start of Bitcoin’s long fade into irrelevance. A projected move to the $160k–$180k range would appear spectacular on headlines, yet within the broader arc of Bitcoin’s halving mechanics, it represents nothing more than the final gasp of exponential returns before the math itself runs out of road.
Each halving cycle has delivered progressively weaker gains, compressing the dream from life-changing multiples to mere percentages. At this trajectory, the next cycle risks producing a macro lower high, the first true sign of a terminal bear market. Beyond that lies the possibility of decades-long decline, where the legend of “digital gold” becomes just another case study in market psychology and technological obsolescence.
The irony is inescapable: what was once celebrated as unshackled freedom from centralised control now trades under the thumb of ETFs, influencers, and institutional flows. The rebellion has been monetised, the revolution syndicated. If October 2025 plays out as expected, we will look back not at the rise of Bitcoin to a million dollars per coin, but at its slow descent into being just another ticker on the screen, remembered more for what it symbolised than for what it ever achieved.
Ww
Why Ethereum is Outperforming Bitcoin? | FX ResearchWhile Bitcoin did manage to push to a fresh record high, the broader august trend reflected cautious investor sentiment, supported by modest momentum and ongoing macro uncertainty. The narrative suggests price resilience, but without the forcefulness needed for the next wave of bullish momentum.
In stark contrast, Ethereum continued with its run of outperformance—posting double-digit returns and surpassing its 2021 peak to hit fresh all-time highs. Its rally was powered by robust institutional demand, record ETF inflows, and active on-chain metrics like rising transaction volumes and reduced network fees. Favorable regulatory signals, particularly stablecoin-friendly legislation, further stoked confidence in ETH’s utility-driven narrative.
This divergence has shifted the ETHBTC dynamic sharply in ETH’s favor. As Bitcoin grinded higher with subdued volatility, Ethereum’s performance underscored its emergence as the speculative bellwether, attracting capital rotating away from Bitcoin’s more mature positioning.
Exclusive FX research from LMAX Group Market Strategist, Joel Kruger

Oracle Is Up 80% Since April. What Does Its Chart Tell Us?Oracle NYSE:ORCL will release fiscal Q1 results next week at a time when the tech giant's stock has risen more than 80% from its April lows, but also given back some 15% since hitting a 52-week high in late July. Let's see what the stock's technical and fundamental analysis can tell us.
Oracle's Fundamental Analysis
ORCL, which will report results after the bell on Tuesday, rose nearly 120% over the less than three months between its $118.86 April 7 intraday low and its $260.87 intraday July 31 high.
That included a 22% gain over two sessions that followed its fiscal Q4 2025 results' release on June 11.
Those earnings beat the Street's estimates for both revenues at adjusted earnings, with year-over-year sales growth accelerating to 11.3% from 6% in the prior quarter. In fact, the results marked the first time Oracle saw double-digit percentages for sales growth since 2023.
Beyond the headline results, ORCL's remaining performance obligation rose 41%, while cloud revenues (IaaS and SaaS) grew 27%.
Company founder and Chairman Larry Ellison said at the time that multi-cloud database revenue from Amazon, Google and Azure alone grew 115% between the company's fiscal Q3 and Q4. He added: "We expect triple-digit multi-cloud revenue growth to continue in FY26."
For fiscal Q1, analysts expect Oracle to post $1.48 in adjusted earnings per share on roughly $15.1 billion of revenue. That would represent 6.5% growth from the $1.39 in adjusted EPS that ORCL reported in the same period last year, as well as about a 13.5% y/y gain from last year's $13.3 billion in revenues.
The Street also projects 16% sales growth for Oracle's fiscal year as a whole, along with 19% revenue expansion in fiscal 2027. This supports just what Ellison said.
However, not everyone is sold on that. Of the 33 sell-side analysts that I can find that cover ORCL, 12 have revised their earnings estimates higher since the quarter began, while 10 have revised their projections lower. (Eleven made no changes.)
Oracle's Technical Analysis
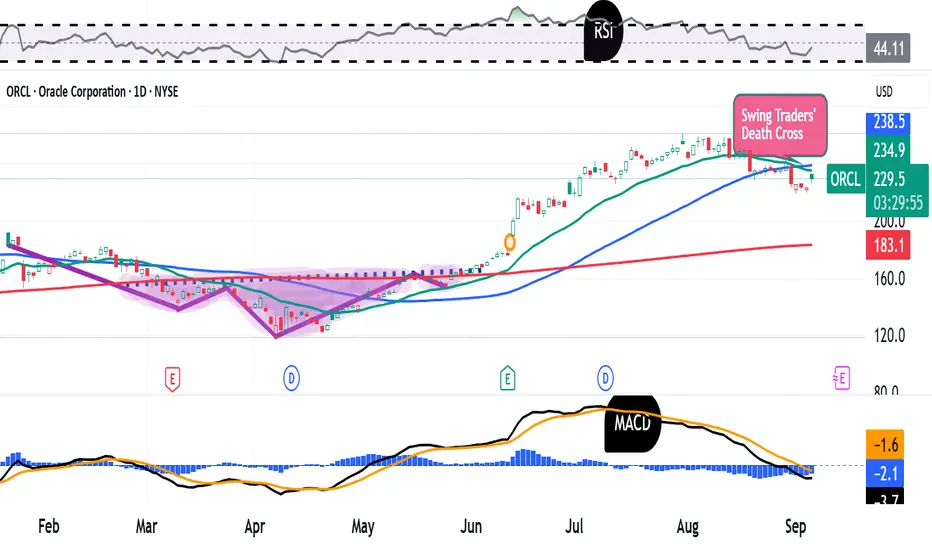
Now let's take a look at Oracle's year-to-date chart as of Wednesday:
How interesting is this? ORCL started the year with what's called an "inverse head-and-shoulders" pattern of bullish reversal with a $163 pivot, as denoted by the purple jagged line and purple field at the chart's left.
The stock then rallied from there, but developed a head-and-shoulders pattern of bearish reversal from late June unto the president day. This pattern has a $229 downside pivot that appears to have just recently been triggered. (ORCL closed at $223 Thursday.)
Making matters even trickier for the bulls, Oracle has just suffered what's called "baby death cross" or "swing trader's death cross," marked with a red box at the chart's right.
That's when a stock's 21-day Exponential Moving Average (or "EMA," denoted by a green line) crosses below its 50-day Simple Moving Average (or "SMA," marked with a blue line). That's usually considered a short- to medium-term bearish technical signal.
The other indicators in the chart above are likewise sending less-than-joyous signals ahead of Oracle's earnings.
For example, the stock's Relative Strength Index (the gray line at the chart's top) is weak, although not technically oversold.
Similarly, Oracle's daily Moving Average Convergence Divergence indicator (or "MACD," denoted by black and gold lines and blue bars at the chart's bottom) is getting gnarly.
The histogram of the 9-day EMA (the blue bars) is in negative territory and has been since mid-July.
Meanwhile, the stock's 12-day EMA (the black line) crossed below the 26-day EMA (the gold line) in early July and has never recovered. In fact, the gap between the two lines has only increased while both headed lower and now stand in negative territory. That can typically be a bearish signal.
Investors should also be cognizant that Oracle's chart has an unfilled gap from early July that would need a tick as low as $176.38 to completely fill in. That would require about a 20% drop from Thursday's close.
(Moomoo Technologies Inc. Markets Commentator Stephen “Sarge” Guilfoyle had no position in ORCL at the time of writing this column.)
This article discusses technical analysis, other approaches, including fundamental analysis, may offer very different views. The examples provided are for illustrative purposes only and are not intended to be reflective of the results you can expect to achieve. Specific security charts used are for illustrative purposes only and are not a recommendation, offer to sell, or a solicitation of an offer to buy any security. Past investment performance does not indicate or guarantee future success. Returns will vary, and all investments carry risks, including loss of principal. This content is also not a research report and is not intended to serve as the basis for any investment decision. The information contained in this article does not purport to be a complete description of the securities, markets, or developments referred to in this material. Moomoo and its affiliates make no representation or warranty as to the article's adequacy, completeness, accuracy or timeliness for any particular purpose of the above content. Furthermore, there is no guarantee that any statements, estimates, price targets, opinions or forecasts provided herein will prove to be correct.
Moomoo is a financial information and trading app offered by Moomoo Technologies Inc. In the U.S., investment products and services on Moomoo are offered by Moomoo Financial Inc., Member FINRA/SIPC.
TradingView is an independent third party not affiliated with Moomoo Financial Inc., Moomoo Technologies Inc., or its affiliates. Moomoo Financial Inc. and its affiliates do not endorse, represent or warrant the completeness and accuracy of the data and information available on the TradingView platform and are not responsible for any services provided by the third-party platform.
Long bond bulls’ eye bigger breakoutThe bullish move in U.S. ultra-long bond futures anticipated last week has played out nicely, with the contract surging higher over the subsequent days, taking out a key topside hurdle comprising the 200DMA and horizontal resistance at 119’19. The move has now stalled at a downtrend from the highs set in September last year, a period when the Fed went full-bore dove on concerns the U.S. was potentially slipping into recession. Sound familiar?
Zooming out, the contract is coiling within a falling wedge, a continuation pattern that points to the potential for a far larger extension of the bullish move should the price break and hold above the September 2024 downtrend. The signal from the breakout may not be as reliable as others given long bond futures have been anything but bullish in recent years, but convention suggests we could eventually revisit the September 2024 highs, implying a 30-year yield of less than 4%.
122’18 and 124’24 are minor levels to monitor on the topside before more significant tests await at 129’00, 132’00, 135’13 and the September 2024 swing high. RSI (14) and MACD point to building bullish momentum, favouring a similar directional bias that should improve the odds of the breakout sticking, should it occur.
Good luck!
DS

Downtrend in Dell?Dell Technologies has lagged the market for months, and some traders may see further downside in the maker of computer hardware.
The first pattern on today’s chart is the bearish gap on August 29 following quarterly results. While earnings and revenue beat estimates, investors focused on weaker margins amid higher costs and intense competition for AI servers.
Second is the August 21 closing price of $127.83, where DELL stalled last week. Has old support become new resistance?
Third, MACD is falling and the 8-day exponential moving average (EMA) is below the 21-day EMA. Those signals may reflect short-term bearishness.
Next, the stock is back under its 50-day simple moving average and has remained below a bearish gap from November. Those points may reflect weakness in the intermediate and long term.
TradeStation has, for decades, advanced the trading industry, providing access to stocks, options and futures. If you're born to trade, we could be for you. See our Overview for more.
Past performance, whether actual or indicated by historical tests of strategies, is no guarantee of future performance or success. There is a possibility that you may sustain a loss equal to or greater than your entire investment regardless of which asset class you trade (equities, options or futures); therefore, you should not invest or risk money that you cannot afford to lose. Online trading is not suitable for all investors. View the document titled Characteristics and Risks of Standardized Options at www.TradeStation.com . Before trading any asset class, customers must read the relevant risk disclosure statements on www.TradeStation.com . System access and trade placement and execution may be delayed or fail due to market volatility and volume, quote delays, system and software errors, Internet traffic, outages and other factors.
Securities and futures trading is offered to self-directed customers by TradeStation Securities, Inc., a broker-dealer registered with the Securities and Exchange Commission and a futures commission merchant licensed with the Commodity Futures Trading Commission). TradeStation Securities is a member of the Financial Industry Regulatory Authority, the National Futures Association, and a number of exchanges.
TradeStation Securities, Inc. and TradeStation Technologies, Inc. are each wholly owned subsidiaries of TradeStation Group, Inc., both operating, and providing products and services, under the TradeStation brand and trademark. When applying for, or purchasing, accounts, subscriptions, products and services, it is important that you know which company you will be dealing with. Visit www.TradeStation.com for further important information explaining what this means.

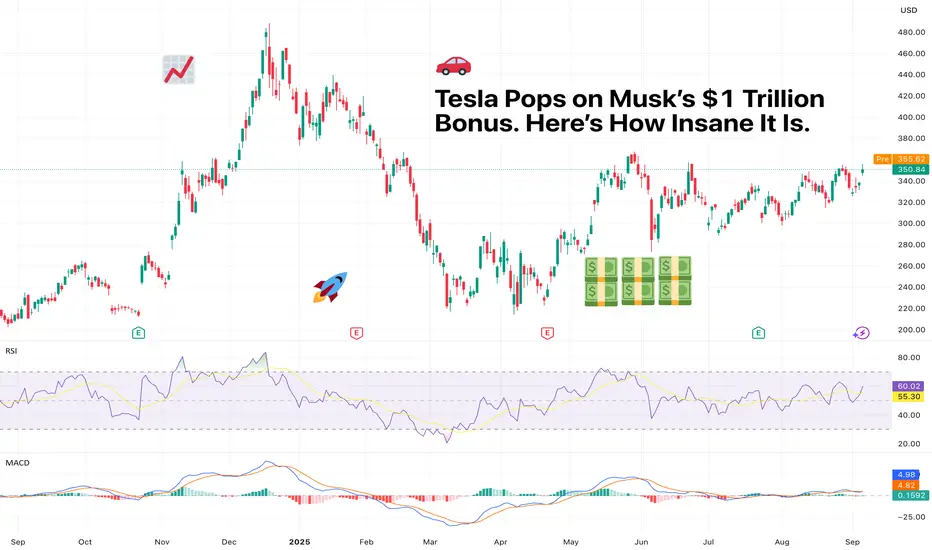
Tesla Pops on Musk’s $1 Trillion Bonus. Here’s How Insane It Is.The mother of all KPIs.
Elon Musk has a new carrot dangling in front of him, and it’s not a Mars colony or a flamethrower.
Tesla’s board is asking investors to approve a bonus so massive, so absurd, so galaxy-brained, that it makes past compensation packages look like pocket change.
Ready? We’re talking about the potential for a $1 trillion payday if Musk manages to drag Tesla to an $8.5 trillion valuation. In ten years.
That’s nearly eight times where it is today. So let’s unpack just how unhinged this deal really is, why Tesla stock popped on the news, and what it would take for Musk to collect.
🚀 The Trillion-Dollar Tease
Tesla stock NASDAQ:TSLA climbed 3.6% Friday on the back of this announcement, not because anything happened then and there, but because something could happen ten years out.
The board dropped the proposal in a securities filing, outlining that Musk could receive up to 423 million shares – worth over $1 trillion – if Tesla smashes through a series of market cap and operational milestones.
In other words, the board is looking to lock Musk in and make sure he doesn’t get distracted by rocket launches, robot brains, or tweeting memes about NPCs at 2 a.m.
💰 What’s the Catch?
The catch is that this isn’t free money. To claim the full $1 trillion, Musk has to lead Tesla into uncharted corporate territory: Boost Tesla’s market cap from $1 trillion to $8.5 trillion by 2035. That’s more than double Nvidia’s NASDAQ:NVDA current valuation ($4.2 trillion) and equal to the GDP of Japan, Germany, and the UK, combined.
Deliver 12 million more EVs (as of this summer, Tesla has managed about 8 million in its entire history).
Land 10 million autonomous driving subscriptions.
Register and operate 1 million robotaxis (Not on the market right now).
Sell 1 million AI robots (Not on the market right now).
Increase adjusted earnings from $13 billion to $400 billion. That’s a 24x jump in profit.
Next stop? Tesla’s earnings report ( Earnings Calendar for reference) in about a month from now.
🪄 The Board’s Spin
Tesla Chair Robyn Denholm called the package “fundamental to Tesla becoming the most valuable company in history.” Translation: Elon, please.
In a letter to shareholders, the board said the award “aligns extraordinary long-term shareholder value with incentives that will drive peak performance from our visionary leader.”
Which is corporate-speak for: We know he’s mercurial, but this should keep him tethered for at least a decade.
⚡ The Stakes for Tesla
Tesla’s stock reaction says investors are cautiously optimistic – emphasis on cautiously. Shares have been down nearly 30% since mid-December, plagued by slowing EV sales , rising competition, and Musk’s very public political feuds (including an ongoing rift with President Trump that’s cost Tesla federal EV incentives).
To make matters trickier, Tesla’s brand halo isn’t as shiny as it used to be. EV rivals like BYD, Rivian, Hyundai, and Mercedes are cutting into Tesla’s dominance, while price cuts have compressed margins.
Analysts expect Tesla to deliver 1.6 million vehicles this year, down from last year’s totals. On top of that, revenue continues to slide, lower by 12% in the last quarter , indicating a shrinking business.
So why the big gamble? Because if this plan works, Tesla wouldn’t just catch up – it would become the undisputed king of EVs, autonomous driving, AI robotics, and energy storage. In other words, a full-blown tech empire.
💰 Musk’s 25% Solution
Part of Musk’s motivation here isn’t just about the money – though a trillion-dollar payday to one person is actually insane. Musk has repeatedly said he wants at least 25% voting control over Tesla to feel “comfortable” keeping his focus there.
Under the proposed plan, if Musk hits every target, his stake in Tesla would rise to 25% from his current holdings of 12%, giving him outsized influence over its future direction. That means if Tesla’s valuation is at $8.5 trillion, he’d be holding shares worth $2.12 trillion. But if he misses? He gets nothing. Zero.
It’s a high-wire act for both Musk and shareholders: reward him with historic wealth if he delivers, but don’t overpay if he falls short.
🤖 Robotaxis, Humanoids, and AI Dreams
A key piece of this plan hinges on Musk’s boldest vision yet: turning Tesla into an autonomous AI platform. Forget just cars – think fleets of robotaxis generating recurring subscription revenue and Optimus humanoid robots replacing repetitive labor in warehouses, factories, and maybe even households.
If this strategy pays off, Tesla won’t just be an automaker – it’ll be an AI-powered infrastructure company. But right now, that future is priced into a present that still depends on selling Model Ys and Cybertrucks.
🔍 The Market’s Split Personality
Wall Street’s reaction has been mixed, and here’s why:
The bulls argue that Tesla has the innovation engine, the brand, and, yes, the Musk factor to make the impossible happen. They point to SpaceX’s reusable rockets and Nvidia’s AI dominance as proof that moonshots sometimes land.
The bears see the trillion-dollar pay package as monopoly money that’ll never be real. Between slowing EV demand, Tesla’s underwhelming Q2 deliveries, and Musk’s penchant for side quests, they’re skeptical Tesla can hit even half of these KPIs.
🏁 The Bottom Line
Tesla’s proposed Musk mega-package is nothing short of audacious. It’s an all-in bet on:
Explosive growth in EVs and autonomous driving
Turning Tesla into an AI + robotics powerhouse
Keeping Musk’s focus locked on Tesla instead of Mars, memes, or political campaigns
Is the plan bold? Absolutely. Is it risky? Without a doubt.
Off to you : Do you believe Musk deserves the “One-Trillion-Dollar Man” (or $2T) title? Or is all that a desperate move to keep him around? Share your thoughts in the comments!