$ORCL The Matrix OracleNow that you have grasped the basic knowledge of the Matrix and its blueprint being conceptually Math, here we are diving towards the horizon which is the future trying to make sense of the math of the path. That lies ahead of us.
Extracting the information required to navigate into the unknown whi
Next report date
—
Report period
—
EPS estimate
—
Revenue estimate
—
3.81USD
10.47 BUSD
52.96 BUSD
1.60 B
About Oracle Corporation
Sector
Industry
CEO
Safra Ada Catz
Website
Headquarters
Austin
Employees (FY)
159 K
Founded
1977
FIGI
BBG000BQLTW7
Oracle Corp. engages in the provision of products and services that address aspects of corporate information technology environments, including applications and infrastructure technologies. It operates through the following business segments: Cloud and License, Hardware, and Services. The Cloud and License segment markets, sells, and delivers enterprise applications and infrastructure technologies through cloud and on-premise deployment models including cloud services and license support offerings. The Hardware segment provides infrastructure technologies including Oracle Engineered Systems, servers, storage, industry-specific hardware, operating systems, virtualization, management, and other hardware-related software. The Services segment offers consulting, advanced support, and education services. The company was founded by Lawrence Joseph Ellison, Robert Nimrod Miner, and Edward A. Oates on June 16, 1977 and is headquartered in Austin, TX.

ORCL: Pay Attention to These Key Points! (D / W charts)The ORCL chart displays notable patterns and key levels on both the daily (1D) and weekly (1W) timeframes, offering insights into potential trading opportunities.
On the daily chart, ORCL is forming a possible double top pattern around the $145.32 resistance level, indicating a potential bearish re

ORCL Rejection - Price Precedes NewsORCL had been running up recently into the previous ATH, but broke below the ascending channel it was in. It recovered some and went back for another test of ATH. Of course when it got there, this news drops.
The dump was happening either way. Price precedes news.

ORCL, out of steam?ORCL presents a contrarian trading opportunity. Despite overall bullish sentiment, the price action suggests a potential downside. ORCL recently hit an all-time high but closed lower, indicating possible bearish momentum. With QQQ breaking out and major tech stocks like NVDA, AAPL, GOOGL, and MSFT s

Oracle introduces new AI breakthrough for corporate software devThis week, Oracle Inc. introduced an important artificial intelligence (AI) innovation aimed at the most popular AI field: corporate software development. Oracle expects this product to drive profitable sales, distinguishing it from most mass-market AI services.
The introduction of the new soluti

ORCL Long-Term Bull, ignore the noise from CRM and MDBJust a few days ago, ORCL was WS's darling. But suddenly, CRM software revenue was missed, vital guidance was absent, and Database MDB's soft earnings were lost in this high-expectation environment. Then, the macro environment around rates and inflation was ongoing.
All this is noise; ORCL is turni

6/11/24 - $orcl - not best reward for risk in this tape. pass.6/11/24 - vrockstar - NYSE:ORCL - literally wrote this prior to the last quarter (when i wasn't publishing publicly) and not much has seemed to change:
seems fairly valued all else equal "uninteresting" at current levels which implies 10 bn FCF discounted at 3% which seems to be about the norm fo

Oracle (ORCL): Bearish Scenario with Long-Term PotentialSince our last analysis of Oracle on the daily chart, there has been little significant change. The stock moved into our Wave (B) zone between $128 and $138, and after reaching a high of $132.77, it was rejected. A trendline was broken but quickly reclaimed, suggesting a potential push upward.
We a

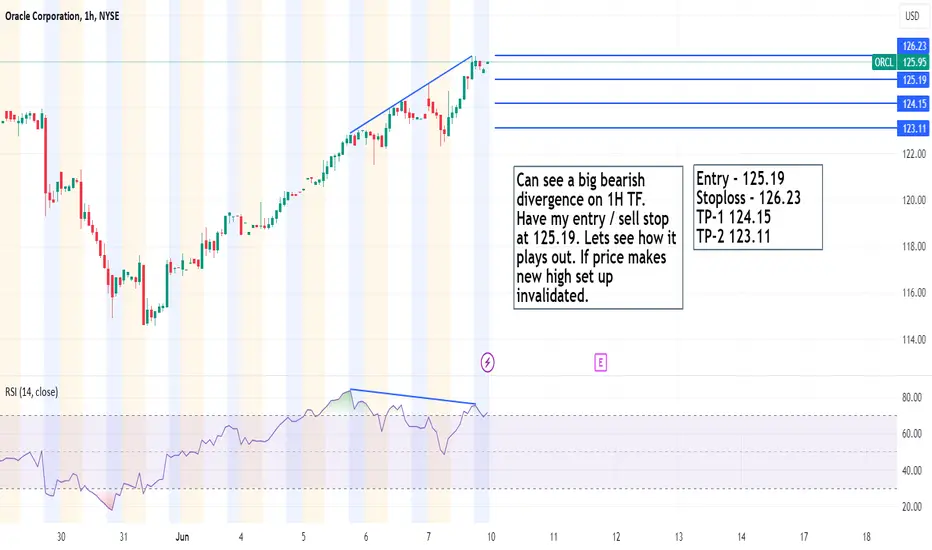
Oracle Corp - Short SetupCan see a big bearish divergence on 1H TF. Have my entry / sell stop at 125.19. Lets see how it plays out. If price makes new high set up invalidated.
Entry - 125.19
Stoploss - 126.23
TP-1 124.15
TP-2 123.11
ORACLE Gann analysis
up cycle end at 199.34
now must thrust above 120.09 oterwise it goes down to correct to 103.39

See all ideas
An aggregate view of professional's ratings.
Trade directly on the supercharts through our supported, fully-verified and user-reviewed brokers.


Curated watchlists where ORCL is featured.


Frequently Asked Questions
The current price of ORCL is 139.01 USD — it has increased by 0.86% in the past 24 hours. Watch Oracle Corporation stock price performance more closely on the chart.
Depending on the exchange, the stock ticker may vary. For instance, on NYSE exchange Oracle Corporation stocks are traded under the ticker ORCL.
ORCL stock has risen by 0.48% compared to the previous week, the month change is a 0.34% fall, over the last year Oracle Corporation has showed a 18.26% increase.
We've gathered analysts' opinions on Oracle Corporation future price: according to them, ORCL price has a max estimate of 175.00 USD and a min estimate of 105.00 USD. Watch ORCL chart and read a more detailed Oracle Corporation stock forecast: see what analysts think of Oracle Corporation and suggest that you do with its stocks.
ORCL reached its all-time high on Jul 15, 2024 with the price of 146.59 USD, and its all-time low was 0.04 USD and was reached on Sep 30, 1986. View more price dynamics on ORCL chart.
See other stocks reaching their highest and lowest prices.
See other stocks reaching their highest and lowest prices.
ORCL stock is 1.55% volatile and has beta coefficient of 1.14. Track Oracle Corporation stock price on the chart and check out the list of the most volatile stocks — is Oracle Corporation there?
Today Oracle Corporation has the market capitalization of 379.81 B, it has increased by 2.76% over the last week.
Yes, you can track Oracle Corporation financials in yearly and quarterly reports right on TradingView.
Oracle Corporation is going to release the next earnings report on Sep 9, 2024. Keep track of upcoming events with our Earnings Calendar.
ORCL earnings for the last quarter are 1.63 USD per share, whereas the estimation was 1.65 USD resulting in a −1.13% surprise. The estimated earnings for the next quarter are 1.33 USD per share. See more details about Oracle Corporation earnings.
Oracle Corporation revenue for the last quarter amounts to 14.29 B USD, despite the estimated figure of 14.56 B USD. In the next quarter, revenue is expected to reach 13.24 B USD.
ORCL net income for the last quarter is 3.14 B USD, while the quarter before that showed 2.40 B USD of net income which accounts for 30.90% change. Track more Oracle Corporation financial stats to get the full picture.
Yes, ORCL dividends are paid quarterly. The last dividend per share was 0.40 USD. As of today, Dividend Yield (TTM)% is 1.16%. Tracking Oracle Corporation dividends might help you take more informed decisions.
Oracle Corporation dividend yield was 1.37% in 2023, and payout ratio reached 43.15%. The year before the numbers were 1.28% and 44.24% correspondingly. See high-dividend stocks and find more opportunities for your portfolio.
As of Jul 27, 2024, the company has 159.00 K employees. See our rating of the largest employees — is Oracle Corporation on this list?
EBITDA measures a company's operating performance, its growth signifies an improvement in the efficiency of a company. Oracle Corporation EBITDA is 22.21 B USD, and current EBITDA margin is 41.94%. See more stats in Oracle Corporation financial statements.
Like other stocks, ORCL shares are traded on stock exchanges, e.g. Nasdaq, Nyse, Euronext, and the easiest way to buy them is through an online stock broker. To do this, you need to open an account and follow a broker's procedures, then start trading. You can trade Oracle Corporation stock right from TradingView charts — choose your broker and connect to your account.
Investing in stocks requires a comprehensive research: you should carefully study all the available data, e.g. company's financials, related news, and its technical analysis. So Oracle Corporation technincal analysis shows the neutral today, and its 1 week rating is buy. Since market conditions are prone to changes, it's worth looking a bit further into the future — according to the 1 month rating Oracle Corporation stock shows the strong buy signal. See more of Oracle Corporation technicals for a more comprehensive analysis.
If you're still not sure, try looking for inspiration in our curated watchlists.
If you're still not sure, try looking for inspiration in our curated watchlists.