Amazon (AMZN) is Entering a High-Probability Reversal Zone!
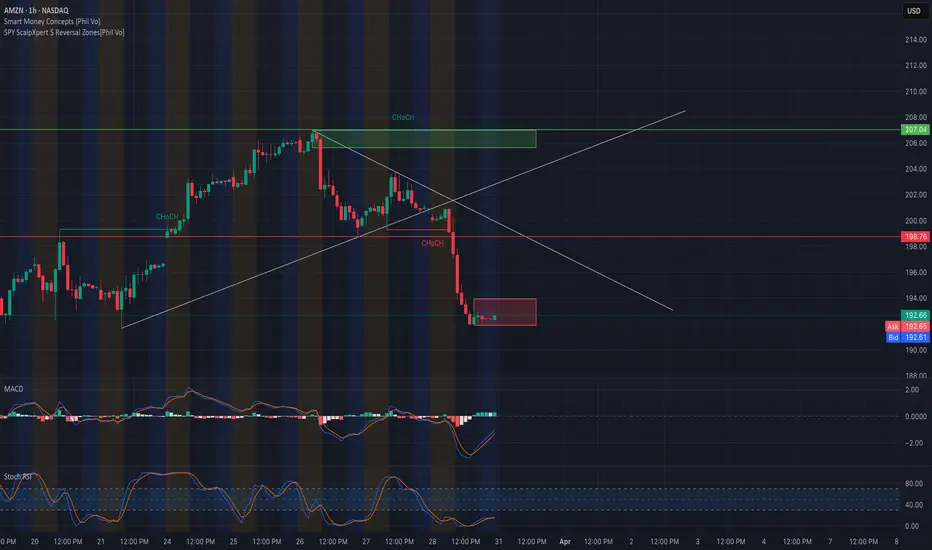
1. Market Structure & Price Action (1H Chart)
* Trend: AMZN is currently in a short-term bearish trend after rejecting from the $207 supply zone.
* CHoCH (Change of Character): The recent CHoCH around ~$198 confirms bearish control.
* Price Range: Current price is consolidating in the $191–193 zone
Key facts today
Next report date
≈
April 24
Report period
Q1 2025
EPS estimate
1.37 USD
Revenue estimate
155.29 B USD
5.65 USD
59.25 B USD
637.96 B USD
9.48 B
About Amazon.com
Sector
Industry
CEO
Andrew R. Jassy
Website
Headquarters
Seattle
Founded
1994
FIGI
BBG000BVPV84
Amazon.com, Inc. engages in the provision of online retail shopping services. It operates through the following business segments: North America, International, and Amazon Web Services (AWS). The North America segment includes retail sales of consumer products and subscriptions through North America-focused websites such as amazon.com and amazon.ca. The International segment offers retail sales of consumer products and subscriptions through internationally-focused websites. The Amazon Web Services segment involves in the global sales of compute, storage, database, and AWS service offerings for start-ups, enterprises, government agencies, and academic institutions. The company was founded by Jeffrey P. Bezos in July 1994 and is headquartered in Seattle, WA.
6.0%
7.2%
8.4%
9.6%
10.8%
Q4 '23
Q1 '24
Q2 '24
Q3 '24
Q4 '24
0.00
50.00 B
100.00 B
150.00 B
200.00 B
Revenue
Net income
Net margin %
Revenue
COGS
Gross profit
Op expenses
Op income
Non-Op income/ expenses
Taxes & Other
Net income
0.00
50.00 B
100.00 B
150.00 B
200.00 B
Revenue
COGS
Gross profit
Expenses & adjustments
Net income
0.00
50.00 B
100.00 B
150.00 B
200.00 B
Q4 '23
Q1 '24
Q2 '24
Q3 '24
Q4 '24
0.00
40.00 B
80.00 B
120.00 B
160.00 B
Debt
Free cash flow
Cash & equivalents
No news here
Looks like there's nothing to report right now
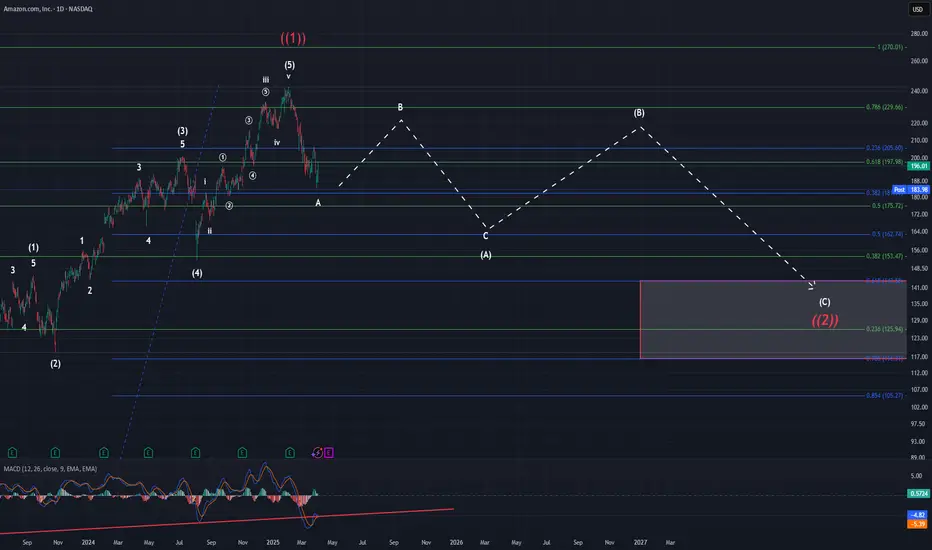
Amazon UpdatePrice made yet another new low since my last post. However, we have some nice pos div at this time and MACD appears to be bouncing off of the trend line. Either way, I do believe that minor A wave will be complete soon and minor B will kick off. Minor B should ideally take us back up to the $220 are
Amazon (NASDAQ: $AMZN) Drops 8% as Trump Tariffs Shake Markets. Amazon (NASDAQ: NASDAQ:AMZN ) is facing huge downward pressure following President Donald Trump's announcement of sweeping tariffs. The stock dropped 9.26% in early trading, reaching $176.92 as of 11:01 AM EDT.
These tariffs impact over 100 countries, including China, a key supplier for third-par


AMZN LongBought AMZN Calls due to retracement I called out in January of this year. Bought
250C LEAPS with min 15 months expiration.
1. Key weekly S/R level reached {$190}
2. Weekly uptrend established in 2022
3. Golden ratio Fib level
4. 5m time frame illustrating inverted head and shoulders candle patter

AMZN Bulls Crab After a period of seller dominance, indicated by the exhaustion of previous pricing strategies and the "crab" reaching its limit, the market dynamic has shifted.
The impetus now lies with the buyers, as their own strategic maneuvering and pricing pressure ("crab") begins to exert influence on th

Congrats on AMZN shorts - posted before it happenedThis trade idea was posted couple days ago and now the target has been met. I believe there might be some more room down but might get some retracement tomorrow before expanding more on Friday, let's see. But if you followed this you're getting bangers tomorrow.

Consider a Long Position on AMZN Amid Market Volatility
-Key Insights: With the current market trend showing increased volatility
highlighted by broad index declines, investors should consider focusing on
Amazon's support levels for strategic entry points. Despite not having a
specific current market price available, the historic support levels at $190,
Resistance or Rebound?
Amazon's chart is hanging around $192. Think of this zone as a tug-of-war between buyers and sellers. It's acted as support before, but can it hold again? If it fails, look out below! On the upside, cracking through the $216 resistance could signal a breakout. Will Amazon finally break free, or is

BIGGEST RALLY POTENTIALAmazon (AMZN) is showing signs of potential bullish continuation on the 4-hour timeframe, but confirmation is key before entering a trade. Here’s a structured breakdown of the setup:
Technical Analysis
1. Key Resistance at $200.50
• The price is currently consolidating just below this key leve

See all ideas
Summarizing what the indicators are suggesting.
Neutral
SellBuy
Strong sellStrong buy
Strong sellSellNeutralBuyStrong buy
Neutral
SellBuy
Strong sellStrong buy
Strong sellSellNeutralBuyStrong buy
Neutral
SellBuy
Strong sellStrong buy
Strong sellSellNeutralBuyStrong buy
An aggregate view of professional's ratings.
Neutral
SellBuy
Strong sellStrong buy
Strong sellSellNeutralBuyStrong buy
Neutral
SellBuy
Strong sellStrong buy
Strong sellSellNeutralBuyStrong buy
Neutral
SellBuy
Strong sellStrong buy
Strong sellSellNeutralBuyStrong buy
Displays a symbol's price movements over previous years to identify recurring trends.
US23135CE4
AMAZON.COM 22/25Yield to maturity
7.88%
Maturity date
Apr 13, 2025
AMZN4996701
Amazon.com, Inc. 2.7% 03-JUN-2060Yield to maturity
6.61%
Maturity date
Jun 3, 2060
US23135BT2
AMAZON.COM 20/50Yield to maturity
6.50%
Maturity date
Jun 3, 2050
US23135CC8
AMAZON.COM 21/61Yield to maturity
6.29%
Maturity date
May 12, 2061
AMZN5182959
Amazon.com, Inc. 3.1% 12-MAY-2051Yield to maturity
6.27%
Maturity date
May 12, 2051
US23135CK0
AMAZON.COM 22/62Yield to maturity
5.87%
Maturity date
Apr 13, 2062
AMZN5182958
Amazon.com, Inc. 2.875% 12-MAY-2041Yield to maturity
5.85%
Maturity date
May 12, 2041
US23135CJ3
AMAZON.COM 22/52Yield to maturity
5.81%
Maturity date
Apr 13, 2052
AMZN4531866
Amazon.com, Inc. 4.05% 22-AUG-2047Yield to maturity
5.79%
Maturity date
Aug 22, 2047
AMZN4531868
Amazon.com, Inc. 4.25% 22-AUG-2057Yield to maturity
5.73%
Maturity date
Aug 22, 2057
See all AMZN bonds
Curated watchlists where AMZN is featured.


Frequently Asked Questions
The current price of AMZN is 171.00 USD — it has decreased by −4.15% in the past 24 hours. Watch Amazon.com stock price performance more closely on the chart.
Depending on the exchange, the stock ticker may vary. For instance, on NASDAQ exchange Amazon.com stocks are traded under the ticker AMZN.
AMZN stock has fallen by −13.82% compared to the previous week, the month change is a −16.50% fall, over the last year Amazon.com has showed a −7.07% decrease.
We've gathered analysts' opinions on Amazon.com future price: according to them, AMZN price has a max estimate of 306.00 USD and a min estimate of 203.00 USD. Watch AMZN chart and read a more detailed Amazon.com stock forecast: see what analysts think of Amazon.com and suggest that you do with its stocks.
AMZN reached its all-time high on Feb 4, 2025 with the price of 242.52 USD, and its all-time low was 0.07 USD and was reached on May 22, 1997. View more price dynamics on AMZN chart.
See other stocks reaching their highest and lowest prices.
See other stocks reaching their highest and lowest prices.
AMZN stock is 7.48% volatile and has beta coefficient of 1.29. Track Amazon.com stock price on the chart and check out the list of the most volatile stocks — is Amazon.com there?
Today Amazon.com has the market capitalization of 1.81 T, it has increased by 2.62% over the last week.
Yes, you can track Amazon.com financials in yearly and quarterly reports right on TradingView.
Amazon.com is going to release the next earnings report on Apr 24, 2025. Keep track of upcoming events with our Earnings Calendar.
AMZN earnings for the last quarter are 1.86 USD per share, whereas the estimation was 1.49 USD resulting in a 25.14% surprise. The estimated earnings for the next quarter are 1.37 USD per share. See more details about Amazon.com earnings.
Amazon.com revenue for the last quarter amounts to 187.79 B USD, despite the estimated figure of 187.34 B USD. In the next quarter, revenue is expected to reach 155.29 B USD.
AMZN net income for the last quarter is 20.00 B USD, while the quarter before that showed 15.33 B USD of net income which accounts for 30.51% change. Track more Amazon.com financial stats to get the full picture.
No, AMZN doesn't pay any dividends to its shareholders. But don't worry, we've prepared a list of high-dividend stocks for you.
As of Apr 6, 2025, the company has 1.56 M employees. See our rating of the largest employees — is Amazon.com on this list?
EBITDA measures a company's operating performance, its growth signifies an improvement in the efficiency of a company. Amazon.com EBITDA is 122.15 B USD, and current EBITDA margin is 19.15%. See more stats in Amazon.com financial statements.
Like other stocks, AMZN shares are traded on stock exchanges, e.g. Nasdaq, Nyse, Euronext, and the easiest way to buy them is through an online stock broker. To do this, you need to open an account and follow a broker's procedures, then start trading. You can trade Amazon.com stock right from TradingView charts — choose your broker and connect to your account.
Investing in stocks requires a comprehensive research: you should carefully study all the available data, e.g. company's financials, related news, and its technical analysis. So Amazon.com technincal analysis shows the strong sell today, and its 1 week rating is sell. Since market conditions are prone to changes, it's worth looking a bit further into the future — according to the 1 month rating Amazon.com stock shows the neutral signal. See more of Amazon.com technicals for a more comprehensive analysis.
If you're still not sure, try looking for inspiration in our curated watchlists.
If you're still not sure, try looking for inspiration in our curated watchlists.