NATGAS RESISTANCE AHEAD|SHORT|
✅NATGAS is going up now
But a strong resistance level is ahead at 2.55$
Thus I am expecting a pullback
And a move down towards the target at 2.40$
SHORT🔥
✅Like and subscribe to never miss a new idea!✅
About Natural Gas Futures
Natural Gas is a fossil fuel formed from plants and animals buried underground and exposed to extreme heat and pressure. Natural gas is used domestically for cooking, as a power source, in agriculture, and in industrial manufacturing. Natural gas prices fluctuate constantly depending mainly on production issues, stockpiles, weather conditions, economic growth, crude oil prices, and more recently coal. Natural gas is commonly measured in MMBtu, with 1 MMBTu equaling 1 million BTU (British Thermal Units).

NATGAS Local Risky Long! Buy!
Hello,Traders!
NATGAS has hit a horizontal
Support level of 2.20$ from
Where we are seeing a bullish
Rebound and we will be
Expecting a further move up
Buy!
Like, comment and subscribe to help us grow!
Check out other forecasts below too!

Nat Gas: Heating Up into the WinterBrief Overview on Natural Gas
Natural Gas is a commodity generally traded on the premise of weather forecasts indicating cooler or warmer seasons. This allows traders to speculate on demand for the product as it generally trades higher with cooler temperatures. Today we are looking at the weekly c

Natural Gas Oil, Dollar, Silver, Gold Price ForecastNatural Gas stock Bulls PEPPERSTONE:NATGAS Support & Resistance Guide

Natural Gas still coiling! breakdown or breakout?Hello Traders
In This Chart NATGAS HOURLY Forex Forecast By FOREX PLANET
today NATGAS analysis 👆
🟢This Chart includes_ (NATGAS market update)
🟢What is The Next Opportunity on NATGAS Market
🟢how to Enter to the Valid Entry With Assurance Profit
This CHART is For Trader's that Want to Improve Their Te

NATGAS RISKY LONG|
✅NATGAS retested the strong support level of 2.215$
After trading in a local downtrend from some time
Which makes a bullish rebound a likely scenario
With the target being a local resistance above at 2.331$
LONG🚀
✅Like and subscribe to never miss a new idea!✅

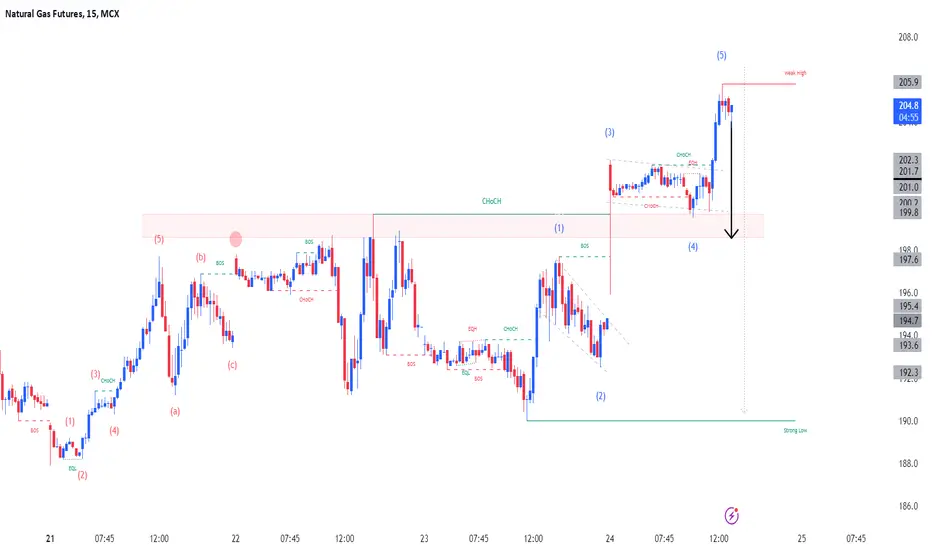
GasPair : Natural Gas
Description :
Completed " 12345 " Impulsive Waves
Break of Structure
Consolidation Phase as an Corrective Pattern in Short Time Frame
Order Block
RSI - Divergence
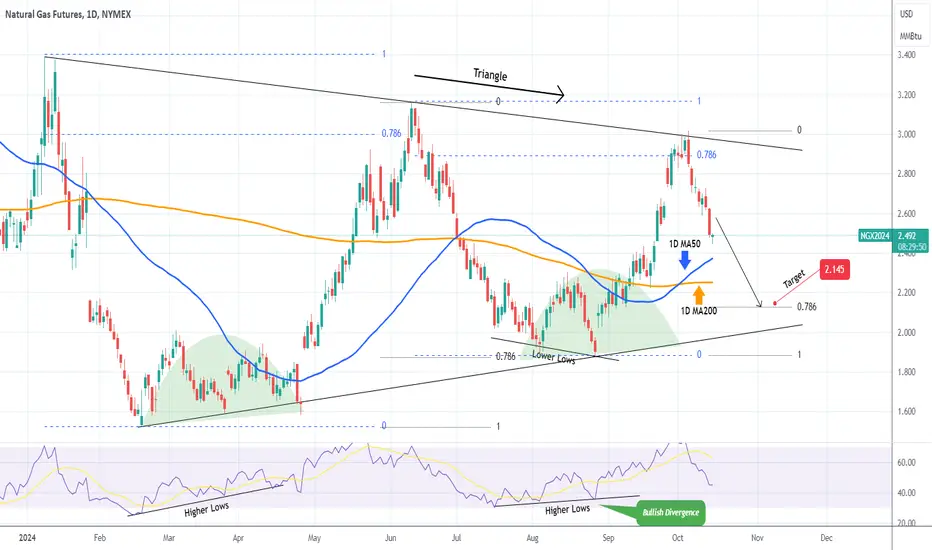
NATURAL GAS on a Bearish Leg. Still a sell signal.Natural Gas (NG1!) gave us an excellent buy opportunity last time (August 29, see chart below) and easily hit our 2.900 Target:
Once it hit the 0.786 Fibonacci retracement level (blue) it formed a Lower High at the top of the Triangle pattern and got rejected. The previous Lower High rejection
Natural Gas Oil Dollar Silver Gold Price ForecastNatural Gas stock Bulls PEPPERSTONE:NATGAS Support & Resistance Guide


See all ideas
A representation of what an asset is worth today and what the market thinks it will be worth in the future.
Displays a symbol's price movements over previous years to identify recurring trends.
Related symbols
Frequently Asked Questions
The current price of Natural Gas Futures is 2.560 USD / MMBTU — it has risen 1.51% in the past 24 hours. Watch Natural Gas Futures price in more detail on the chart.
The volume of Natural Gas Futures is 61.27 K. Track more important stats on the Natural Gas Futures chart.
Open interest is the number of contracts held by traders in active positions — they're not closed or expired. For Natural Gas Futures this number is 30.30 K. You can use it to track a prevailing market trend and adjust your own strategy: declining open interest for Natural Gas Futures shows that traders are closing their positions, which means a weakening trend.
Buying or selling futures contracts depends on many factors: season, underlying commodity, your own trading strategy. So mostly it's up to you, but if you look for some certain calculations to take into account, you can study technical analysis for Natural Gas Futures. Today its technical rating is buy, but remember that market conditions change all the time, so it's always crucial to do your own research. See more of Natural Gas Futures technicals for a more comprehensive analysis.