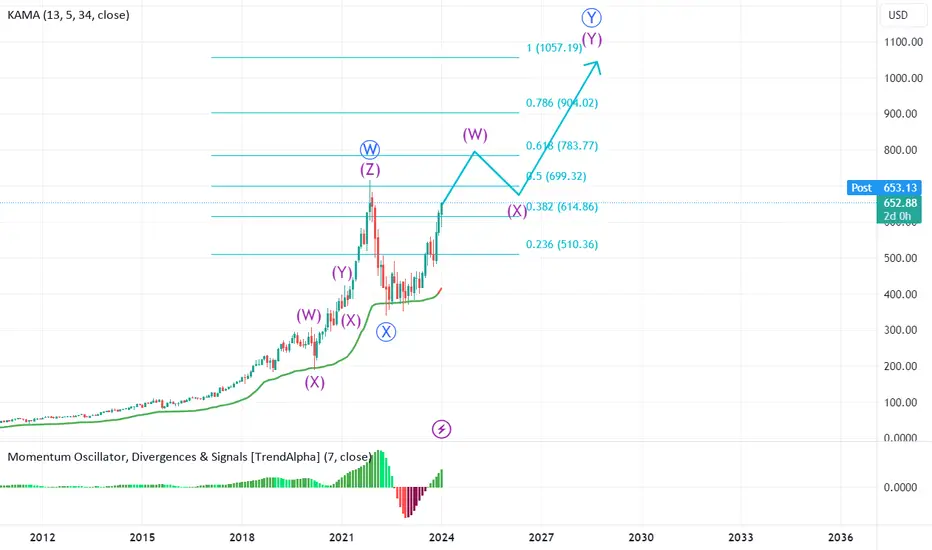
Top stock picks for the next years No 7 Intuit Inc.I am publishing a series of the best stocks with the highest growth rates that I expect over the next few years. Today with the Intuit share with a target price of 1057$
Next report date
Report period
Q3 2024
EPS estimate
9.38USD
Revenue estimate
6.65 BUSD
9.87USD
2.38 BUSD
14.37 BUSD
272.02 M
About Intuit Inc.
Sector
Industry
CEO
Sasan K. Goodarzi
Website
Headquarters
Mountain View
Employees (FY)
18.2 K
Founded
1983
FIGI
BBG000BH5DV1
Intuit, Inc. engages in the provision of business and financial management solutions. It operates through the following segments: Small Business and Self-Employed, Consumer, Credit Karma, and ProTax. The Small Business and Self-Employed segment offers QuickBooks financial and business management online services and desktop software, payroll solutions, payment processing solutions, and financing for small businesses. The Consumer segment includes do-it-yourself and assisted TurboTax income tax preparation products and services. The Credit Karma segment serves consumers with a personal finance platform that provides personalized recommendations of credit cards, home, auto and personal loans, and insurance products, and online savings and checking accounts. The ProTax segment refers to the professional accountants in the U.S. and Canada, who are essential to both small business success and tax preparation and filing. The company was founded by Scott D. Cook and Thomas A. Proulx in March 1983 and is headquartered in Mountain View, CA.
INTU Intuit Options Ahead of EarningsIf you haven't bought INTU ahead of the previous earnings:
Then analyzing the options chain and the chart patterns of INTU Intuit prior to the earnings report this week,
I would consider purchasing the 560usd strike price Puts with
an expiration date of 2023-12-1,
for a premium of approximately

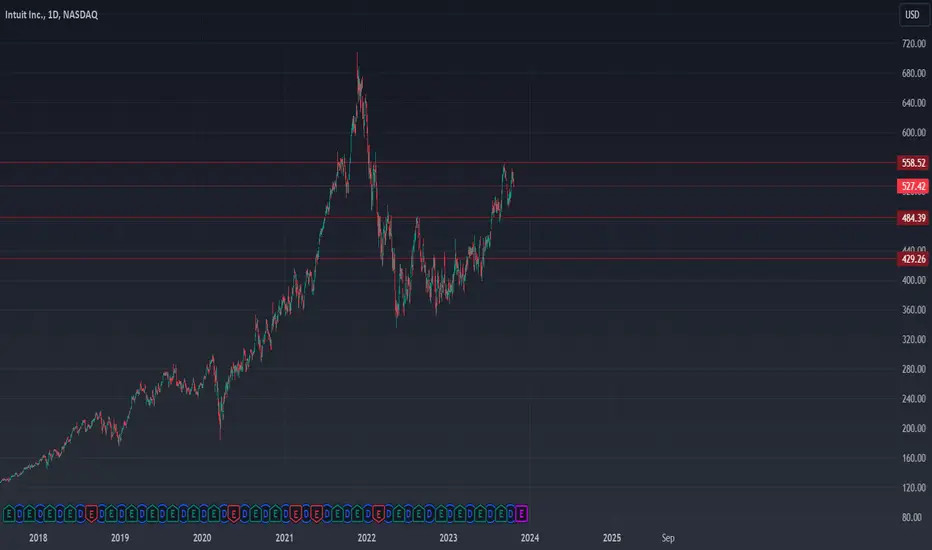
INTU breakoutINTUIT has broken out of the small congestion zone. It can move to 61.8% of the decline. My first target is 540. Second 570. SL - Closing below 510. Will trail once starts moving up.

IRS -- Friend or foeThe IRS's recent announcement of direct tax filing services in 13 states poses a direct and significant threat to Intuit Inc.'s (INTU) core business, specifically its tax preparation software and services. This government-backed initiative not only erodes the competitive advantage enjoyed by Intuit
INTU SELL++++INTU testing cloud support of $530 with sell signal $514 bottom of cloud and $509 longer term support which will be tested

$INTU: Oversold bounce?Growth company Intuit may get an oversold bounce here around the 500-510 area. The extent of it however remains to be seen

Intuit to find buyers at previous resistance?Intuit - 30d expiry - We look to Buy at 507.51 (stop at 491.51)
Price action continues to trade around significant highs.
The primary trend remains bullish.
Short term momentum is bullish.
Previous resistance located at 505.
Previous resistance at 505 now becomes support.
We look to buy dips.

Intuit,,, Buy opportunity As you see this chart is inside a good uptrend and just passed a major price level on daily time frame. In my opinion, this wave is very strong and after touching the top, it again will rise properly. About 475 can be a good price for SL but stop is related to your strategy completely.

INTU - Rising Trend Channel [MID-TERM]🔹Rising trend channel in the medium long term.
🔹In case of a NEGATIVE reaction, the stock has support at approximately 490.
🔹Short-term trading range has been positively signaled by breaking a resistance level.
🔹The RSI is showing a Bearish Divergence against the price, indicating a potential downwa

INTU Intuit Options Ahead of EarningsAnalyzing the options chain and the chart patterns of INTU Intuit prior to the earnings report this week,
I would consider purchasing the 500usd strike price Calls with
an expiration date of 2023-9-15,
for a premium of approximately $12.80.
If these options prove to be profitable prior to the earnin

See all ideas
Trade directly on the supercharts through our supported, fully-verified and user-reviewed brokers.


Curated watchlists where INTU is featured.


Frequently Asked Questions
The current price of INTU is 626.39 USD — it has decreased by 1.43% in the past 24 hours.
Depending on the exchange, the stock ticker may vary. For instance, on NASDAQ exchange Intuit Inc. stocks are traded under the ticker INTU.
Intuit Inc. is going to release the next earnings report on May 21, 2024. Keep track of upcoming events with our Earnings Calendar.
INTU stock is 2.53% volatile and has beta coefficient of 1.58. Check out the list of the most volatile stocks — is Intuit Inc. there?
INTU earnings for the last quarter are 2.47 USD per share, whereas the estimation was 1.98 USD resulting in a 24.89% surprise. The estimated earnings for the next quarter are 2.30 USD per share. See more details about Intuit Inc. earnings.
Intuit Inc. revenue for the last quarter amounts to 2.98 B USD despite the estimated figure of 2.88 B USD. In the next quarter revenue is expected to reach 3.39 B USD.
Yes, you can track Intuit Inc. financials in yearly and quarterly reports right on TradingView.
INTU stock has risen by 1.54% compared to the previous week, the month change is a 2.46% fall, over the last year Intuit Inc. has showed a 49.74% increase.
INTU net income for the last quarter is 353.00 M USD, while the quarter before that showed 241.00 M USD of net income which accounts for 46.47% change. Track more Intuit Inc. financial stats to get the full picture.
Today Intuit Inc. has the market capitalization of 175.38 B, it has decreased by 0.28% over the last week.
Yes, INTU dividends are paid quarterly. The last dividend per share was 0.90 USD. As of today, Dividend Yield (TTM)% is 0.54%. Tracking Intuit Inc. dividends might help you take more informed decisions.
Intuit Inc. dividend yield was 0.61% in 2023, and payout ratio reached 37.04%. The year before the numbers were 0.60% and 37.39% correspondingly. See high-dividend stocks and find more opportunities for your portfolio.
Like other stocks, INTU shares are traded on stock exchanges, e.g. Nasdaq, Nyse, Euronext, and the easiest way to buy them is through an online stock broker. To do this, you need to open an account and follow a broker's procedures, then start trading. You can trade Intuit Inc. stock right from TradingView charts — choose your broker and connect to your account.
As of Apr 26, 2024, the company has 18.20 K employees. See our rating of the largest employees — is Intuit Inc. on this list?
Investing in stocks requires a comprehensive research: you should carefully study all the available data, e.g. company's financials, related news, and its technical analysis. So Intuit Inc. technincal analysis shows the neutral today, and its 1 week rating is buy. Since market conditions are prone to changes, it's worth looking a bit further into the future — according to the 1 month rating Intuit Inc. stock shows the buy signal. See more of Intuit Inc. technicals for a more comprehensive analysis.
If you're still not sure, try looking for inspiration in our curated watchlists.
If you're still not sure, try looking for inspiration in our curated watchlists.
We've gathered analysts' opinions on Intuit Inc. future price: according to them, INTU price has a max estimate of 775.00 USD and a min estimate of 556.00 USD. Read a more detailed Intuit Inc. forecast: see what analysts think of Intuit Inc. and suggest that you do with its stocks.
EBITDA measures a company's operating performance, its growth signifies an improvement in the efficiency of a company. Intuit Inc. EBITDA is 4.24 B USD, and current EBITDA margin is 27.47%. See more stats in Intuit Inc. financial statements.