TSM Trend BreakTSM is another semi that has recently broken below its major uptrend. It tried to rally and come back for a retest, but it rejected. Now it is well below the uptrend and looks primed for more downside.
Key facts today
Next report date
—
Report period
—
EPS estimate
—
Revenue estimate
—
26.90 BUSD
69.35 BUSD
5.19 B
About TAIWAN SEMICONDUCTOR MANUFACTURING
Sector
Industry
CEO
Che Chia Wei
Website
Headquarters
Hsinchu
Employees (FY)
76.48 K
Founded
1987
FIGI
BBG000BD8ZK0
Taiwan Semiconductor Manufacturing Co., Ltd. engages in the manufacture and sale of integrated circuits and wafer semiconductor devices. Its chips are used in personal computers and peripheral products, information applications, wired and wireless communications systems products, and automotive and industrial equipment including consumer electronics such as digital video compact disc player, digital television, game consoles, and digital cameras. The company was founded by Chung Mou Chang on February 21, 1987 and is headquartered in Hsinchu, Taiwan.

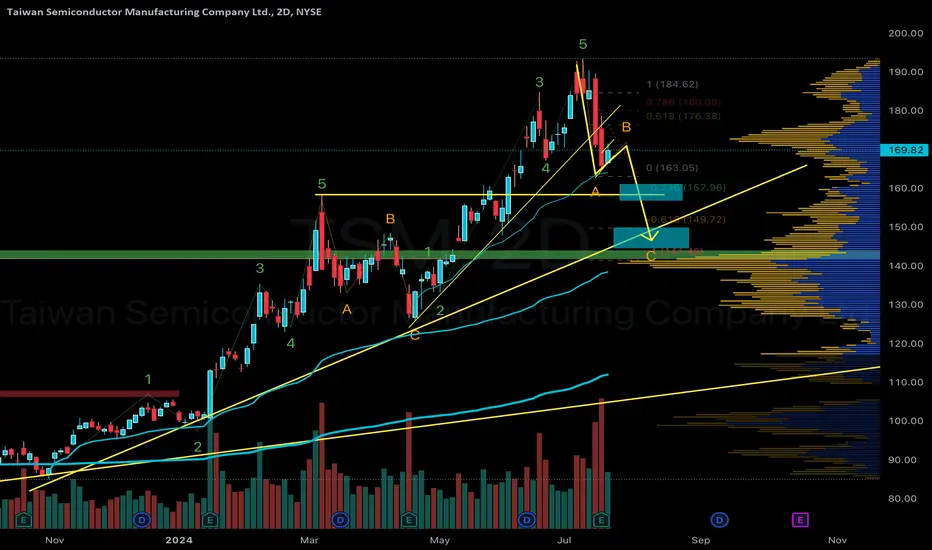
TSM bounces Fib 0.61 looking for fill gap aboveNYSE:TSM extreme price action shocks the AI sector recently and has made good price correction. We are still in bullish market and personally i think we will see big leg of upward price trend to check all times in coming months from this area. Todays pull back forms very attractive candle form and

TSM - short until it finds a supportLike all Semis TSM is on a slide as well
Target#1 160
Target#2 150
Target #3 140, most probably
TSM forms a broadening formation on earnings day!4HR Broadening Formation?
Is TSM going to hold support here after gapping down for earnings?
This 4hr timeframe displays the bounce off 200 MA. Daily 50MA hold as well. See fibs .88 or .618 purple REACTION zones. Today's low can serve as a SL.

TSM breaksdown uptrend!This chart looks bearish and have some consolidation after sharp fall. Then down towards $160 and if it breaks down next target is $150 for sure.
I really love to hear thoughts on this and please comment and share your ideas.
Thank you

TSM - Taiwan semiconductors - Long position Dear traders,
Id like to share this idea in order to take long positions.
Now price is getting to a buying zone 160- 170$ is is a good price range to look for buying opportunities.
Nevertheles I find a 2nd Opportunity for buying if prices reaches 150.
General trend is uptrend but corrections it

TSM Taiwan Semiconductor Options Ahead of EarningsIf you haven`t sold TSM here:
Then analyzing the options chain and the chart patterns of TSM Taiwan Semiconductor prior to the earnings report this week,
I would consider purchasing the 100usd strike price at the money Calls with
an expiration date of 2024-9-20,
for a premium of approximately $11.

TSMLooks so interesting and seems bounce on the up trend line due to positive earnings. but in big time frame indicators sign bearish.

TSM Taiwan Semiconductor Options Ahead of EarningsIf you haven`t bought TSM before it skyrocketed:
Now analyzing the options chain and the chart patterns of TSM Taiwan Semiconductor prior to the earnings report this week,
I would consider purchasing the 190usd strike price Calls with
an expiration date of 2024-9-20,
for a premium of approximately


See all ideas
An aggregate view of professional's ratings.
Trade directly on the supercharts through our supported, fully-verified and user-reviewed brokers.


