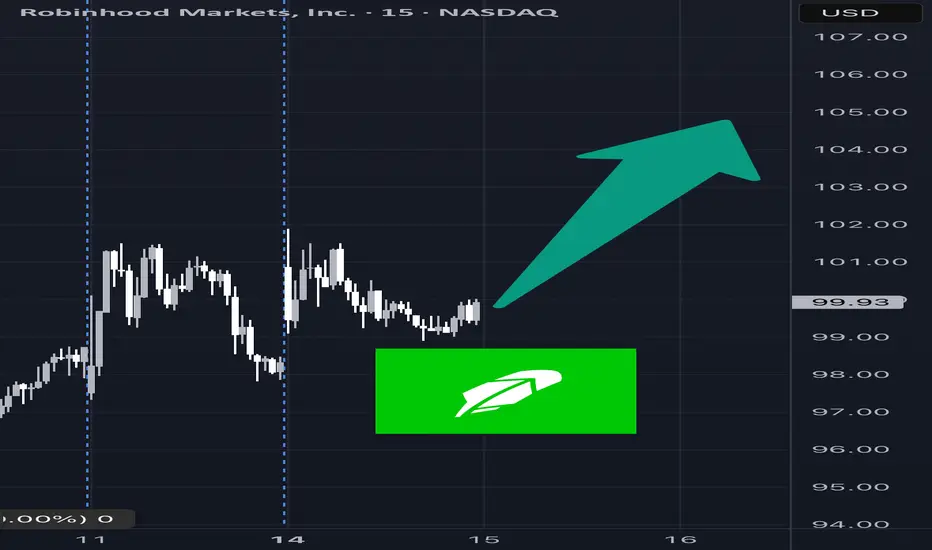
Trade Idea: $HOOD – $106C by 7/25 | Bullish Setup🧠 Thesis:
After topping out at $100, NASDAQ:HOOD pulled back ~10%. I believe this recent pullback sets up a healthy base for a continuation move back toward $100+ in the coming sessions. If momentum kicks in, we could see a push toward the $106 level by expiration.
📊 Key Levels:
Resistance: $95.
Robinhood Markets, Inc.
109.74USDR
+4.29+4.07%
At close at Jul 18, 23:59 GMT
USD
No trades
Key facts today
Next report date
July 30
Report period
Q2 2025
EPS estimate
0.31 USD
Revenue estimate
908.32 M USD
1.80 USD
1.41 B USD
2.98 B USD
739.47 M
About Robinhood Markets, Inc.
Sector
Industry
CEO
Vladimir Tenev
Website
Headquarters
Menlo Park
Founded
2013
FIGI
BBG008NMBXN8
Robinhood Markets, Inc is a financial services platform, which engages in the provision of retail brokerage and offers trading in U.S. listed stocks and Exchange Traded Funds, related options, and cryptocurrency trading, as well as cash management, which includes debit cards services. The company was founded by Vladimir Tenev and Baiju Prafulkumar Bhatt in 2013 and is headquartered in Menlo Park, CA.
20%
40%
60%
80%
100%
Q1 '24
Q2 '24
Q3 '24
Q4 '24
Q1 '25
0.00
260.00 M
520.00 M
780.00 M
1.04 B
Revenue
Net income
Net margin %
Revenue
Op expenses
Op income
Int expenses
Non-op income/expenses
Pretax income
Taxes & Other
Net income
0.00
250.00 M
500.00 M
750.00 M
1.00 B
Revenue
Op expenses
Op income
Expenses & adjustments
Net income
0.00
250.00 M
500.00 M
750.00 M
1.00 B
No news here
Looks like there's nothing to report right now

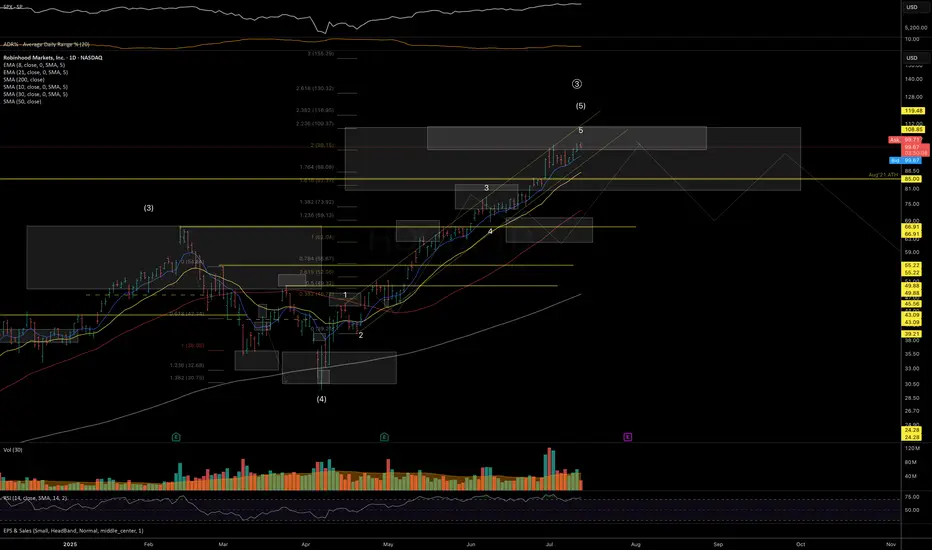
HOOD — In Key Macro Resistance ZonePrice has reached a major resistance zone, with the 110 level marking an ideal spot where downside pressure may begin to dominate and a mid-term top could start forming. Macro support for the macro-uptrend structure is at the 80–65 area.
Hedging near current levels may be prudent - especially ahead
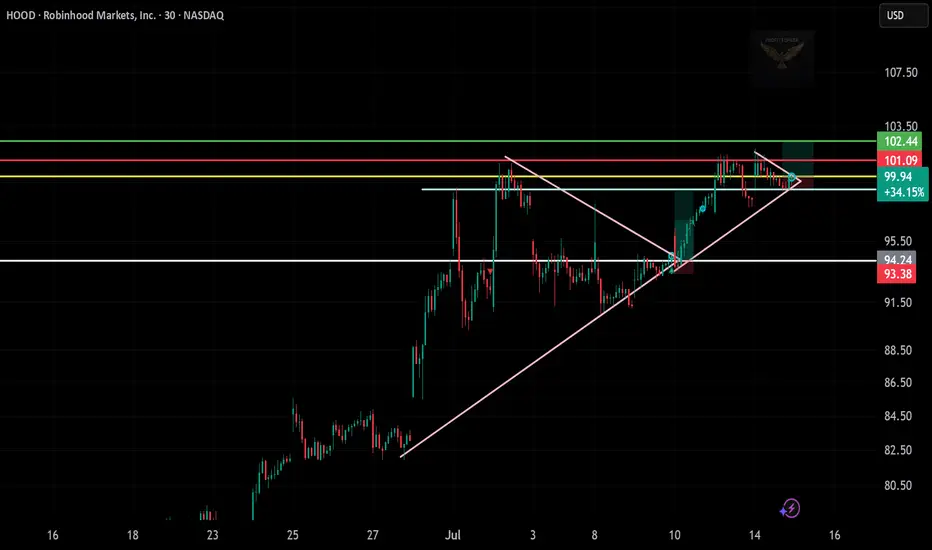
HOOD Breakout Watch – Eyeing $103+
🧠 Chart Breakdown:
Setup: Price broke out of a large ascending triangle and is now forming a mini symmetrical triangle — a consolidation before a possible continuation.
Current Price: $99.94
Breakout Zone: Near $100, close to decision point.
📊 Key Levels:
Immediate Resistance:
$101.09 (yellow)

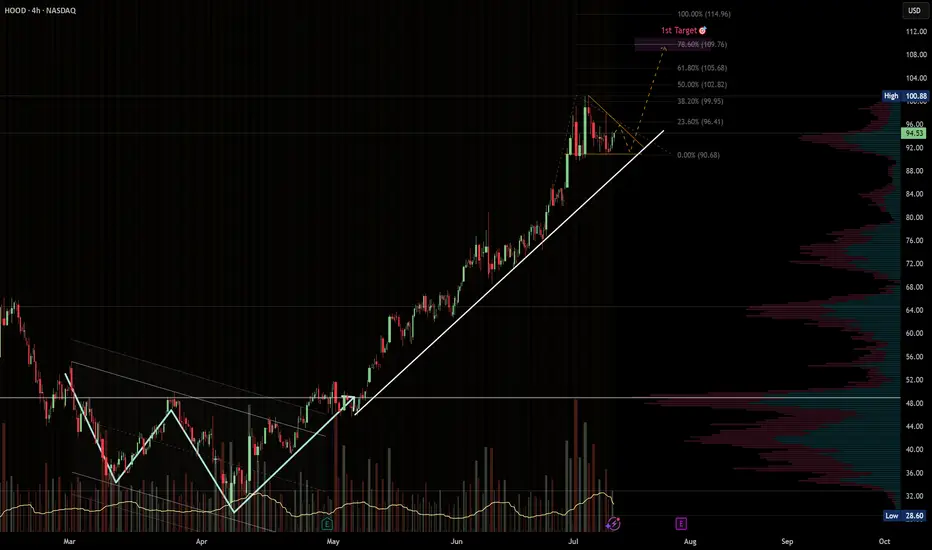
HOOD · 4H — Bullish Continuation Setup Targeting $109 → $115Pattern Overview
HOOD has been riding a strong ascending trendline since early May, respecting higher highs and higher lows all the way up.
After the most recent parabolic move from ~$90 to ~$101, price is now consolidating in a bullish pennant, just above key fib levels.
The setup looks primed f

HOOD - Get Great PricingNASDAQ:HOOD and I have had a mixed relationship over the years. I have had my biggest win on the HOOD brokerage (5,000% options trade, $1200 into 60k) and at the same time I was present for the Derogatory removal of the GME button (of which I had sold before they took that button).
After many yea

HOOD Weekly Call Option Setup – 07/14/2025 $106C | Exp. July 18
📈 HOOD Weekly Call Option Setup – 07/14/2025
$106C | Exp. July 18 | Breakout Watch Above $100 👀
⸻
🔥 BULLISH MOMENTUM BUILDING
🟢 HOOD is pushing hard into $100 resistance — price riding above 10/50/200 EMAs on all timeframes.
📊 RSI hot (65.6 on 5m / 71.6 daily), but not maxed out — short-term pu
What’s Your Catalyst?
Lately, many QS members have been DM’ing me asking:
“What do you think of this trade idea?”
“Should I go long here?”
“Do you think this setup looks good?”
And my go-to response is always the same:
“What’s your catalyst?”
Because without a catalyst, you’re not trading — you’re guessing.
---
🎮 Tradin

See all ideas
Summarizing what the indicators are suggesting.
Neutral
SellBuy
Strong sellStrong buy
Strong sellSellNeutralBuyStrong buy
Neutral
SellBuy
Strong sellStrong buy
Strong sellSellNeutralBuyStrong buy
Neutral
SellBuy
Strong sellStrong buy
Strong sellSellNeutralBuyStrong buy
An aggregate view of professional's ratings.
Neutral
SellBuy
Strong sellStrong buy
Strong sellSellNeutralBuyStrong buy
Neutral
SellBuy
Strong sellStrong buy
Strong sellSellNeutralBuyStrong buy
Neutral
SellBuy
Strong sellStrong buy
Strong sellSellNeutralBuyStrong buy
Displays a symbol's price movements over previous years to identify recurring trends.
Curated watchlists where HOOD is featured.


Frequently Asked Questions
The current price of HOOD is 109.74 USD — it has increased by 4.07% in the past 24 hours. Watch Robinhood Markets, Inc. stock price performance more closely on the chart.
Depending on the exchange, the stock ticker may vary. For instance, on NASDAQ exchange Robinhood Markets, Inc. stocks are traded under the ticker HOOD.
HOOD stock has risen by 12.55% compared to the previous week, the month change is a 45.99% rise, over the last year Robinhood Markets, Inc. has showed a 353.10% increase.
We've gathered analysts' opinions on Robinhood Markets, Inc. future price: according to them, HOOD price has a max estimate of 125.00 USD and a min estimate of 47.00 USD. Watch HOOD chart and read a more detailed Robinhood Markets, Inc. stock forecast: see what analysts think of Robinhood Markets, Inc. and suggest that you do with its stocks.
HOOD reached its all-time high on Jul 11, 2025 with the price of 101.50 USD, and its all-time low was 6.81 USD and was reached on Jun 16, 2022. View more price dynamics on HOOD chart.
See other stocks reaching their highest and lowest prices.
See other stocks reaching their highest and lowest prices.
HOOD stock is 7.47% volatile and has beta coefficient of 3.14. Track Robinhood Markets, Inc. stock price on the chart and check out the list of the most volatile stocks — is Robinhood Markets, Inc. there?
Today Robinhood Markets, Inc. has the market capitalization of 93.06 B, it has increased by 7.23% over the last week.
Yes, you can track Robinhood Markets, Inc. financials in yearly and quarterly reports right on TradingView.
Robinhood Markets, Inc. is going to release the next earnings report on Jul 30, 2025. Keep track of upcoming events with our Earnings Calendar.
HOOD earnings for the last quarter are 0.37 USD per share, whereas the estimation was 0.33 USD resulting in a 13.74% surprise. The estimated earnings for the next quarter are 0.31 USD per share. See more details about Robinhood Markets, Inc. earnings.
Robinhood Markets, Inc. revenue for the last quarter amounts to 927.00 M USD, despite the estimated figure of 920.08 M USD. In the next quarter, revenue is expected to reach 908.32 M USD.
HOOD net income for the last quarter is 336.00 M USD, while the quarter before that showed 916.00 M USD of net income which accounts for −63.32% change. Track more Robinhood Markets, Inc. financial stats to get the full picture.
No, HOOD doesn't pay any dividends to its shareholders. But don't worry, we've prepared a list of high-dividend stocks for you.
As of Jul 19, 2025, the company has 2.3 K employees. See our rating of the largest employees — is Robinhood Markets, Inc. on this list?
EBITDA measures a company's operating performance, its growth signifies an improvement in the efficiency of a company. Robinhood Markets, Inc. EBITDA is 1.36 B USD, and current EBITDA margin is 38.82%. See more stats in Robinhood Markets, Inc. financial statements.
Like other stocks, HOOD shares are traded on stock exchanges, e.g. Nasdaq, Nyse, Euronext, and the easiest way to buy them is through an online stock broker. To do this, you need to open an account and follow a broker's procedures, then start trading. You can trade Robinhood Markets, Inc. stock right from TradingView charts — choose your broker and connect to your account.
Investing in stocks requires a comprehensive research: you should carefully study all the available data, e.g. company's financials, related news, and its technical analysis. So Robinhood Markets, Inc. technincal analysis shows the strong buy rating today, and its 1 week rating is strong buy. Since market conditions are prone to changes, it's worth looking a bit further into the future — according to the 1 month rating Robinhood Markets, Inc. stock shows the strong buy signal. See more of Robinhood Markets, Inc. technicals for a more comprehensive analysis.
If you're still not sure, try looking for inspiration in our curated watchlists.
If you're still not sure, try looking for inspiration in our curated watchlists.