How to Identify Significant Liquidity Zone in Gold Trading
A liquidity zone is a specific area on a price chart where the market orders concentrate.
In this article, I will teach you how to identify the most significant liquidity zones on Gold chart beyond historical levels.
Liquidity Zones
First, in brief, let's discuss where liquidity concentrates.
Market liquidity concentrates on:
1. Psychological levels
Above, you can see a clear concentration of liquidity around a 2500 psychological level on Gold price chart.
2. Fibonacci levels
In the example above, we can see how 382 retracement of a major bullish impulse attracts market liquidity on Gold XAUUSD daily time frame.
3. Horizontal support and resistance levels and trend lines.
In that case, an area based on a classic support/resistance level was a clear source of market liquidity on Gold.
Significant Liquidity Zone
A significant liquidity zone will be the area where psychological levels, Fibonacci levels, horizontal support and resistance levels and trend lines match .
Please, note that such an area may combine the indicators, or any other technical tools.
Such zones can be easily found even beyond the historic levels.
Look at a price chart on Gold on a daily.
Though the market has just updated the ATH, we can spot the next potentially significant liquidity zone with technical analysis.
We see a perfect intersection of a rising trend line, 2600 psychological level based on round numbers and a Fibonacci extension confluence of 2 recent bullish impulses.
These technical tools will compose a significant liquidity zone.
The idea is that Gold was rallying up because of the excess of demand on the market. We will assume that selling orders will be placed within that liquidity zone and the excess of demand will be absorbed by the supply.
It will make the price AT LEAST stop growing and potentially will trigger a correctional movement.
Learn to recognize such liquidity zones, it will help you a lot in predicting Gold price movements.
❤️Please, support my work with like, thank you!❤️
Futures market

Gold at support- But is too obvious... (update)In my morning video analysis, I noted that after yesterday's strong bearish engulfing candle, the most likely scenario was a continuation of the down move, with the next support level identified around the 2660-2665 zone.
The price indeed reached this area, but I believe this support is too obvious and likely to break, instead of a meaningful reversal.
At this point, it is very risky to trade against the flow.
A more prudent approach would be to wait for rallies and consider selling at higher levels.

Small correction up and a drop for goldHi traders,
Last week XAUUSD tested the higher Daily FVG again and dropped.
This could be the start of the last C-wave (orange).
So next week we could see a small correction up and another drop to finish the (orange) A-B-C ZIgzag correction.
Or it turns out that the whole bigger correction was a Triangle (finishe before blue wave b) and we see the next impulsive wave up from here. Then you could trade longs after a correction down on a lower timeframe.
Let's see what price does and react.
Trade idea: My main idea is the first one.
So I would wait for a correction up and a change in orderflow to bearish to trade shorts.
If you want to see more from my analysis, please make sure to follow me, give a like and respectful comment.
This shared post is only my point of view on what could be the next move in this pair based on my analysis. I do not provide trade signals.
Don't be emotional, just trade!
Eduwave

XAUUSD 4H BUY MODELPrice just tapped the daily bullish fair value gap as well as the 4H breaker block and order block. So I expect a bullish reversal to the swing high tagged as 'buy side liquidity'
lets go!!!

XAU/USD Long imminent lookout! back up to 2690My analysis this week for gold is to look for potential imminent buys at this demand if i see a correct confluences play out on the lower time frame as well as the sweep of that sunday asia low. Once that happens i will look price to retace in this area back up to an area of supply.
As price has changed character the downside and broke structure i see now heading down more. i will wait for price to make a correction and fill imbalance above then continue to drop off around the area of that 6 hr supply zonne
Confleunces for XAUUSD BUYS are as follows:
- Price Changed character to the upsice on the higher time frame.
- Price swept the top side liquidity off last week consolidation and letf the bottom which still hasn't been taken.
- Price needs to retrace to continue its bearish course.
- DXY corresponding slightly as well.
P.S. I am interested in shorts but the opportunity as of were current price is, isn't ideal hence why I'm looking for short term buys to sell. Have a great trading week, Q4 soon coming to an end, lets gooooo!!!

PULLBACK BEFORE BOUNCE - $2750 / $2800 NEXTAs illustrated, market has grabbed liquidity above a mid-term high just above $2720.
The market is selling all of that liquidity toward the lower side of the internal range, where there is a lot of sell-side liquidity below $2612 (near $2600) and below $2580 (near $2570 in extension).
Should those areas hold as support, the yellow metal should see a strong rebound off of key psychological prices (such as $2600 or $2575/70) to make a year-end bull expansion move reaching near it's historical max of $2790.
The geopolitical situation DOES NOT seem to get better everywhere where there is conflict, and that DOES NOT help global certainty at all; investors will only continue to protect themselves by hedging their portfolios buying more gold. Not to get deep into China's buying cycle starting again after 6 months. Demand will continue to increase, driving prices higher again.
Lastly, global economy is on a very slim rope above a very high pit-fall as inflation continues to rise + the USA plans to put trade tariffs on China, Canada, and Mexico, which will NOT help ease inflation and rather drive prices higher simply because many companies would have to compensate for such tariffs by increasing consumer prices; thus, whichever sector that gets affected must compensate for the increment in prices by also rising the prices of their products; Homes will just get "poorer", specially with al the jobs that could get cut precisely to compensate from an increase in prices. It's a dangerous and risky spiral to assume.
That being said and technically speaking, keep an eye on key psychological price levels and wait for an evident "V" Shape manipulation pattern on the 1H and 4H timeframes in order to take a long entry and try to catch what could be an interesting and promising bullish push.
--
GOOD LUCK!

A silver low here would strongly imply big bull breakoutBuilding more on the idea of a USD crash explained in previous ideas, here's the silver setup.
Silver has a pending butterfly reversal patten on it. Currently we have a 1.61 high and a pullback to 1.27.
From the perspective of USD bulls, the 1.61 high is encouraging but the 1.27 has to break - otherwise, failure of the butterfly is very likely. Failure of the butterfly most often leads to parabolic moves to the 2.20 and 2.61 fibs.
Here is this same setup flagging the rally after the election.
Bear trades did well from the 1.61 but you had to be locking in profits at the 1.27.
Same thing in BTC. Last short level In posted was the 1.61. Great trade with every single day being down after the entry, but you had to lock in profits at the 1.27.
If this trade is coming is silver, the implied move is around 25% directly up.

The Importance of Stop Loss and Emotional Discipline in TradingThe Importance of Stop Loss and Emotional Discipline in Trading
“The market doesn’t care about your emotions; it follows its own rules.”
One of the most critical aspects of successful trading is setting a stop loss and sticking to it. Here's why:
Protect Your Capital
Trading without a stop loss is like driving without brakes. A stop loss helps limit your losses and keeps your trading capital safe for future opportunities.
Stay Disciplined
Many traders make the mistake of moving their stop loss further away out of fear of being stopped out. This is a slippery slope that can lead to even larger losses. Stick to your plan, no matter what.
Remove Emotions from Trading
Fear and greed are your worst enemies. By predefining your stop loss, you eliminate emotional decision-making in the heat of the moment.
Focus on Risk Management
Before entering a trade, always ask yourself:
What’s my risk-reward ratio?
How much am I willing to lose if the trade goes against me?
Learn to Accept Losses
Losses are a natural part of trading. A stop loss isn’t a failure; it’s a tool to protect you and keep you in the game for the long term.
Key Tip:
Never remove your stop loss hoping the market will “come back.” Hope is not a strategy—discipline and planning are.
Let your emotions stay out of your trades. Protect your capital, trade your plan, and let the market do the rest.

So our bull targets done in crude oil This free new indicator helps to get accurate signals almost on all time frames and if you as me i use it on 15m chart normal candles , so lets talk about crude oil -
when to take trades now-
waiting for the bear signal between 5850-6200
if bear signal we can hold around 70 points tp with 20 sl
Prediction are simply gambling but depending on market situation it shows that market can go upto 6200 or more with 30% chances or else it can open gap down and and go till 6100 or 6110 or more with 50 % chances.
or it can break 6100 and give a bear signal around 6070 with 20% chances.
the indicator you seeing is totally free and will be available soon, keep following.
good luck

NATGAS Will Explode! BUY!
My dear followers,
I analysed this chart on NATGAS and concluded the following:
The market is trading on 3.268 pivot level.
Bias - Bullish
Technical Indicators: Both Super Trend & Pivot HL indicate a highly probable Bullish continuation.
Target - 3.355
About Used Indicators:
A super-trend indicator is plotted on either above or below the closing price to signal a buy or sell. The indicator changes color, based on whether or not you should be buying. If the super-trend indicator moves below the closing price, the indicator turns green, and it signals an entry point or points to buy.
———————————
WISH YOU ALL LUCK

Gold Analysis==>>Rising again==>>Short term!!!Gold ( OANDA:XAUUSD ) started to decline from the Resistance zone($2,740-$2,708) , as I expected in the ✅ previous post ✅.
Gold is moving in the Support zone($2,670-$2,653) and near the Potential Reversal Zone(PRZ) .
According to Elliott's wave theory , Gold is completing wave 5 .
Also, Regular Divergence(RD+) between Consecutive Valleys .
I expect Gold to start rising again from the PRZ and attack the Downtrend line ; if it breaks, we can expect further pumps .
⚠️Note: We should expect further decline if Gold breaks the Support zone($2,670-$2,653).⚠️
🔔Be sure to follow the updated ideas.🔔
Gold Analyze ( XAUUSD ), 1-hour time frame ⏰.
Do not forget to put Stop loss for your positions (For every position you want to open).
Please follow your strategy; this is just my idea, and I will gladly see your ideas in this post.
Please do not forget the ✅' like '✅ button 🙏😊 & Share it with your friends; thanks, and Trade safe.

GOLD ROUTE MAP UPDATEHey Everyone,
A fantastic finish to the week with our chart idea targets all completed!
We traded the entire move up from Monday, all the way up, confirmed with cross and lock to give us plenty of time to get in for the action.
2645 - DONE
2661 - DONE
2679 - DONE
2697 - DONE
After our last target was hit, we now finished off perfectly today with the rejection for the move down.
We will now come back Sunday with our updated Multi time-frame analysis, Gold route map and trading plans for the week ahead.
Have a smashing weekend!! And once again, thank you all for your likes, comments and follows, we really appreciate it!
Mr Gold
GoldViewFX


Gold directionMy view of gold is that it still has a chance to climb. We can see it break level 2729. From there, it will go to level 2790.

GOLD MONTHLY CHART LONG TERM/RANGE ROUTE MAPHey Everyone,
Please see update on our monthly chart idea for our long term/range analysis that we last updated last week on month start.
Last week we stated that this month also started with a detachment to ema5 below for a correction, which was nearly completed and can be pulled up to complete, also highlighted with a small mini circle on the charts for visual purpose.
- This detachment to ema5 was completed perfectly.
We also stated that the area above 2589 is a strong level of support with ema5 providing dynamic support now for a bounce.
- This also played out perfectly with ema5 providing dynamic support and above our 2589 support level for the push up, perfectly hitting our axis target 2702.
We will wait for month end to look for a body close above 2702for a further continuation or if momentum allows to compete the axis targets above before hand.
However, we will keep in mind the channel top that may require a support test. We will continue to use all support structures, across all our multi time frame chart ideas to buy dips also keeping in mind our long term gaps above. Short term we may look bearish but looking at the monthly chart allows us to see the bigger picture and the overall long term Bullish trend.
As always, we will keep you all updated with regular updates throughout the week and how we manage the active ideas and setups. Thank you all for your likes, comments and follows, we really appreciate it!
Mr Gold
GoldViewFX


Will the interest rate cut in late 2024 happen? XAU UP OR DOWN ✍️ NOVA hello everyone, Let's comment on gold price next week from 12/16 - 12/20/2024
🔥 World situation:
Although gold posted some losses, it remains up nearly 1% for the week, supported by a mix of US economic data. While inflation figures were varied, the latest Initial Jobless Claims report strengthened investor confidence in a December rate cut by the Federal Reserve.
Attention now shifts to the Fed’s December 17-18 policy meeting, with traders pricing in a 93% likelihood of a 25 basis point cut, according to CBOT data. Following the announcement, all eyes will be on Fed Chair Jerome Powell’s press conference for insights into the policy direction for 2025.
🔥 Identify:
H4 is seeing price close to the bullish trendline - which will be validating the last rate cut of the year. There will be some upside but it will still be difficult to break above the 2723 price zone
🔥 Technically:
Based on the resistance and support areas of the gold price according to the H4 frame, NOVA identifies the important key areas as follows:
Resistance: $2678, $2723
Support : $2613, $2590, $2535
🔥 NOTE:
Note: Nova wishes traders to manage their capital well
- take the number of lots that match your capital
- Takeprofit equal to 4-6% of capital account
- Stoplose equal to 2-3% of capital account
- The winner is the one who sticks with the market the longest

USOIL: Bearish Continuation & Short Signal
USOIL
- Classic bearish pattern
- Our team expects retracement
SUGGESTED TRADE:
Swing Trade
Sell USOIL
Entry - 71.02
Stop - 71.82
Take - 69.48
Our Risk - 1%
Start protection of your profits from lower levels
❤️ Please, support our work with like & comment! ❤️

Gold can little correct and then grow to 2720 resistance levelHello traders, I want share with you my opinion about Gold. Looking at the chart, we can see how the price some time traded near the resistance level in the seller zone, and later price rebounded and started to grow. In a short time price rose to 2790 points and then turned around and started to decline inside the downward triangle. In this pattern, the price first broke the 2720 level and then declined to the support level, which coincided with the buyer zone, after which broke this level too. Next, Gold declined to support line of the triangle, after which at once made impulse up, breaking the 2625 level one more time. Then it made a retest and continued to grow to the resistance line of the triangle, and when Gold reached this line it at once dropped to the 2625 support level. Price some time traded near this level, after which fell to the buyer zone and then started to grow. In a short time, the price rose to a resistance level, exiting from the triangle, but recently it turned around and made correction. So, now, I think that Gold can decline to support line of the triangle and then rebound up to the 2720 resistance level. That's why I set my TP at this level. Please share this idea with your friends and click Boost 🚀

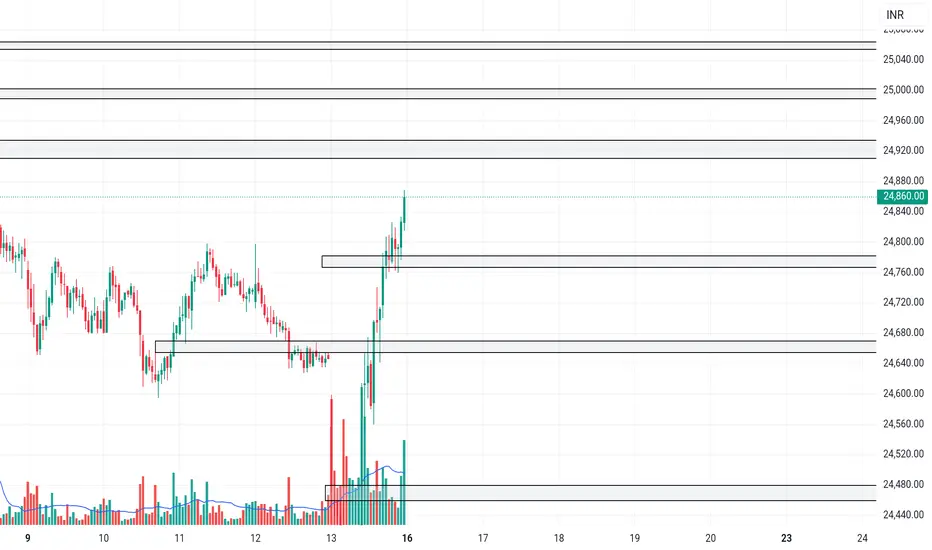
NIFTYNifty levels are based on imbalances
1. gapup 24950 long
2. 25950-24750 trade breakout
3. gapdown 24750 short
Gold is consolidating within channalGold is consolidating within channal, now sitting at support/trenline. It may reverse up from this support

XAU/USD 14.12.2024OANDA:XAUUSD
Hello traders,
after we broke my last wave 4, I reinterpreted my chart view. Essentially, my second plan is now in effect. For now, we have a big (a)(b)(c) setup, within which we see a 12345 count. Currently, we are in waves 1 to 2. Wave 1 is structured as an abc correction, which itself follows an abc structure. Within the corrective wave b to c, we can also count a 12345 wave setup.
Take profit for the sellers would align with the blue Fibonacci extension levels. The 100% extension (the first target) doesn't look very promising to me. It is near the 61% (orange) Fibonacci level but feels too far away. We might observe some bullish momentum there, but likely not enough.
The 161% Fibonacci extension (blue), however, aligns almost exactly with the 78% Fibonacci level. If the price reaches this depth, we will likely see many traders closing their sell positions and others opening buy positions. This could generate enough momentum to create a new minor wave 1, which could then evolve into a 12345 setup for our (orange) wave (3).
This is one potential scenario, but we need to observe what happens next week. If we see an impulsive move to the upside from another level, I will look for a new wave 1 and then search for higher highs.
Wishing you the best of luck!

GOLD Trading Opportunity! BUY!
My dear subscribers,
My technical analysis for GOLD is below:
The price is coiling around a solid key level - 2648.6
Bias - Bullish
Technical Indicators: Pivot Points Low anticipates a potential price reversal.
Super trend shows a clear buy, giving a perfect indicators' convergence.
Goal - 2675.4
About Used Indicators:
By the very nature of the supertrend indicator, it offers firm support and resistance levels for traders to enter and exit trades. Additionally, it also provides signals for setting stop losses
———————————
WISH YOU ALL LUCK
