USD-CAD Long From The Rising Support! Buy!
Hello,Traders!
USD-CAD is trading along
The rising support and
The pair is already making
A bullish rebound so
I think we will see
A further move up
Buy!
Like, comment and subscribe to help us grow!
Check out other forecasts below too!
Forex market

EURUSD: Very Risky LONG ScenarioEURUSD: Very Risky LONG Scenario
Today we have the US GDP data and this is also the focus of the market for today.
Another speculation that is happening is related to the EUR CPI preliminary data tomorrow and the US PCE data.
Both very important figures as the market will interpret what the central banks may decide
to do next.
Technical analysis:
EURUSD is showing some kind of expansionary pattern in one of its boundaries.
The support zone is clear and proved to be strong in the past.
It is likely to push the EURUSD back up.
The problem is only the speculation at this moment.
You may find more details in the chart!
Thank you and Good Luck!
❤️PS: Please support with a like or comment if you find this analysis useful for your trading day❤️

Lingrid | EURUSD trend SHIFTThe price perfectly fulfilled my last idea. It literally tanked hit the target zone. FX:EURUSD is currently retracing towards the resistance zone after its recent breakout from the range zone. On the 1H timeframe, the market has been correcting its downward trend, indicating a potential pause in the bearish momentum. With high-impact news today, I expect the market to continue moving sideways, then potentially move downwards after retesting the range zone. If the EURUSD fails to breach the resistance zone around 1.08100-1.08200, we can anticipate a rebound from this level. My goal is the support level of around 1.07480
Traders, if yTraders, if you liked this idea or if you have your own opinion about it, write in the comments.

A B( triangle) then c wave for 2?I like this setup on a low risk sale at 10920-50… see if it plays out.

GBPAUD - Follow The Trend!Hello TradingView Family / Fellow Traders. This is Richard, also known as theSignalyst.
📈 GBPAUD has been overall bearish , trading within the falling channel in red.
At present, GBPAUD is approaching the upper bound of the channel acting as a non-horizontal resistance.
Moreover, it is retesting a strong resistance marked in green.
🏹 Thus, the highlighted red circle is a strong area to look for sell setups as it is the intersection of the green resistance and upper red trendline.
📚 As per my trading style:
As #GBPAUD approaches the circle zone, I will be looking for bearish reversal setups (like a double top pattern, trendline break , and so on...)
📚 Always follow your trading plan regarding entry, risk management, and trade management.
Good luck!
All Strategies Are Good; If Managed Properly!
~Rich

correction Considering the behavior of the price in the current support range, it is expected that the continuation of the downward trend will be formed according to the specified paths

USDCHF Short BiasHello Traders!
Hope you are all keeping well!
I have shared an idea for a swing sell on USDCHF a month ago (24/04/2024 - please see idea on my profile). The sell from 0.92 worked wonders! And is still valid.
I have my eyes on the following setup which counts as a confirmation entry! We see that perfect head and shoulders formation completed last week. And the price is in a POI which is a strong supply zone at the premium price.
Fundamentally nothing changed from my previous idea, and the explanation from that UCHF idea is still valid.. Retail traders are bearish on Swiss Franc.
This trade can be taken on market open, personally, I am in this trade already, as it tapped the confirmation entry. However, not too late to enter.
Trade safe!
Will update the idea accordingly!

USDCAD Bullish Trading IdeaDisclaimer, these ideas are for my records of what I see in the market after taking a trade. It will help me document the reason of why I took the trade so I can have a track record. And as such, this is not a financial advice.
I've noticed that at the monthly timeframe the pair is doing a wyckoff distribution schematic.
Then at the weekly timeframe, the pair once more is doing a wyckoff distribution schematic.
At the daily timeframe, I've identified a potential area of interest delimited by the fibonacci levels 1, 0.5, and 0 (orange lines). I believe the price is trying to reach that area of interest to get right of the liquidity delimited with the lines that have the $$$ above them.
At the 4 hour timeframe, the price appears to want to go higher, potentially giving strenght to my trade idea.
Given these findings, I'll be entering a buy position until it reaches the fibonacci levels, then I'll start looking for sells.

GBPCHF Long Upward TrendGBPCHF - Long Position
I am seeing a positive upward trend since the start of 2024 with 30/50% fib retracements on each pullback. Current level is showing a breakthrough with possible support at previous highs.
SL 1.4833
TP 1.16500

lookingn for retracementif price drops back down, im looking to enter a long around here, but im expecting it to hard pump, if no pump or any rejection, i'll close it.

USDCHF LONGThis is just simple trading idea draw into chart using labels and lines. Please use it as educational purpose and you are free to modify any

USDCHF WILL EXPLODE BUYManage SL during news time, intraday trade tp and sl mentioned not a financial advice

DeGRAM | AUDUSD breakout of the retracement levelAUDUSD is moving in an ascending channel between the trend lines.
The price is above the support coinciding with the 62% retracement level.
The chart has maintained an ascending structure.
We expect the growth to continue after the support is retested.
-------------------
Share your opinion in the comments and support the idea with like. Thanks for your support!

NZDCAD...DT Curve AnalysisBased on the 4D Chart
SLO @ 0.8393 ⏳
SSO @ 0.8345 ⏳
TP1 @ 0.8255
TP2 @ 0.8179
TP3 @ 0.8123
TP4 @ 0.8037
BLO1 @ 0.8016 ⏳
BLO2 @ 0.7966 ⏳
ADDITIONAL INFO:
⏱ It's prime time for a short BABY.
🤑 Get it while the getting is good.
This is an Intermediate Time Frame trade (4 hours to 6 day):
— Offers a clearer picture of the underlying trend compared to short-term frames.
— Provides more opportunities for confirmation signals and technical analysis.
— Allows for more flexible trading schedules, trades can be held overnight.
— Suitable for swing traders and some positional traders.
🔑
BLO = BUY LIMIT ORDER
DT = DOWNTREND
SLO = SELL LIMIT ORDER
SSO = SELL STOP ORDER
TP = TAKE PROFIT

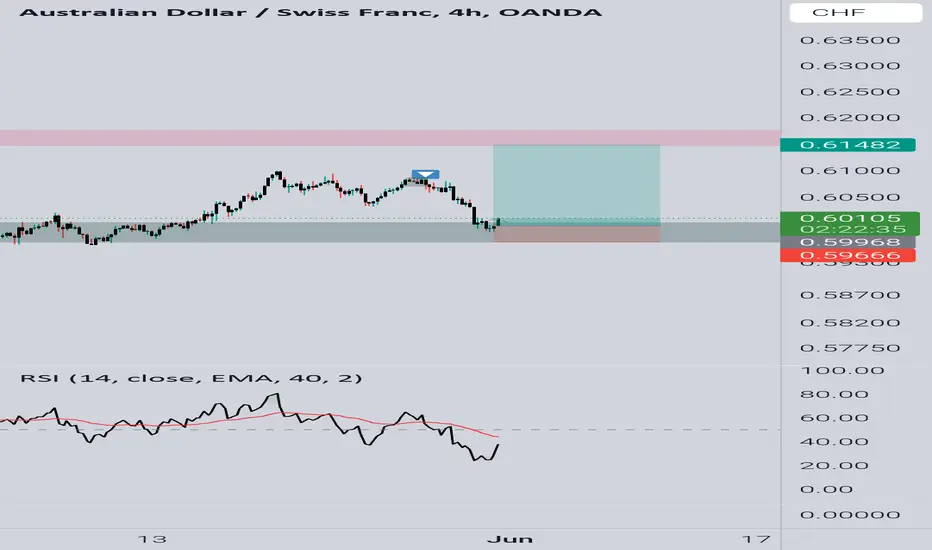
AUDCHF BUY Based on Daily and Weekly TF, the market is overall bullish. The market is currently reacting to a major resistance structure.
The 4HR TF is showing a reversal chart pattern, plus the the RSI is forming a divergence. We could possibly see buyers coming in.
Let's see how this will play out.
Feel free to share your views
EURNZD waiting for long confirmation/entry EURNZD D2 demand in control
Waiting for a lower time frame confirmation entry

USDCHF - Divergence - Heikin Ashi - Long1. Market Analysis:
Asset: USDCHF
Timeframe: 1-hour
Pattern: Bullish divergence identified
Candle Type: Heikin Ashi
2. Entry Criteria:
Divergence Confirmation: Identify bullish divergence on the 1-hour timeframe using indicators like RSI or MACD. Bullish divergence occurs when the price forms lower lows, but the indicator forms higher lows.
Heikin Ashi Confirmation: Look for the formation of the first green Heikin Ashi candle after the bullish divergence is identified, indicating a potential reversal and trend change to the upside.
3. Trade Setup:
Entry Point: Place a buy order at the close of the first green Heikin Ashi candle that confirms the bullish reversal.
Stop-Loss: Set the stop-loss order below the low of the most recent swing low or below the low of the green Heikin Ashi candle that confirms the reversal. This helps limit potential losses if the price reverses.
Take-Profit: Determine your take-profit target based on a risk-reward ratio of either 1:1 or 1:2.

USD-CHF Bullish Bias! Buy!
Hello,Traders!
USD-CHF is going down
Towards the horizontal
Support level of 0.9000
From where we will be
Expecting a bullish rebound
From the level below
Buy!
Like, comment and subscribe to help us grow!
Check out other forecasts below too!

NZDCAD Potential UpsidesHey Traders, in today's trading session we are monitoring NZDCAD for a buying opportunity around 0.83600 zone, NZDCAD is trading in an uptrend and currently is in a correction phase in which it is approaching the trend at 0.83600 support and resistance area.
Trade safe, Joe.

EUR/JPY SENDS CLEAR BEARISH SIGNALS|SHORT
Hello,Friends!
We are going short on the EUR/JPY with the target of 169.809 level, because the pair is overbought and will soon hit the resistance line above. We deduced the overbought condition from the price being near to the upper BB band. However, we should use low risk here because the 1W TF is green and gives us a counter-signal.
✅LIKE AND COMMENT MY IDEAS✅

EURUSD ONE MORE SELL LIMIT ORDER Manage SL during news time, intraday trade tp and sl mentioned not a financial advice

EURGBP potential upsidesHey Traders, in today's trading session we are monitoring EURGBP for a buying opportunity around 0.85100 zone, EURGBP is trading in an uptrend and currently is in a correction phase in which it is approaching the trend at 0.85100 support and resistance area.
Trade safe, Joe.

EURAUD LONGPrice hit my protective stop on Monday but respected structure, waited for proper pullback and a clear break of my AOi, now looking to take advantage of the move further
Market Structure Bullish on HTF
Weekly and Daily at the same AOi
Weekly Rejection at AOi
Daily Rejection at AOi
Around Psychological Level 1.63500
H4 EMA Retest
H4 Previous Structure Point
H4 Candlestick rejection
Levels 1:6
Entry 100%
REMEMBER: Trading is a Game Of Probability
: Manage Your Risk
: Be Patient
: Every Moment Is Unique
: Rinse, Wash, Repeat!
: Stay Hydrated
#Follow#Share#Comment#Boost
