XRT trade ideas
Poppin' Tags in $XRT?Multiple retail names posting blowout numbers. Budget retail like FIVE, NKE, HBI, and URBN could also still see upside momentum. Notice the rejection off the 2018 highs. Selling bullish verticals in case it's a slow grind

XRTTrying to break out here, along with XLB, XLI, and XLY. Not to mention XLF has been ripping as of late. Vix falling as well as credit spreads. All healthy signs to me.

XRT - Retail - Chart says its doing Great!
Amazon is not in this Retail ETF - you couldn't tell looking this chart.
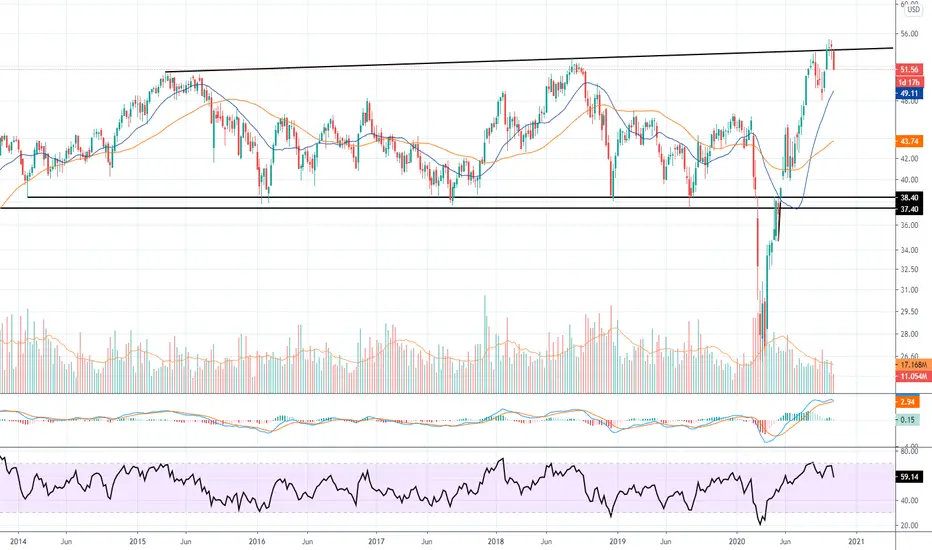
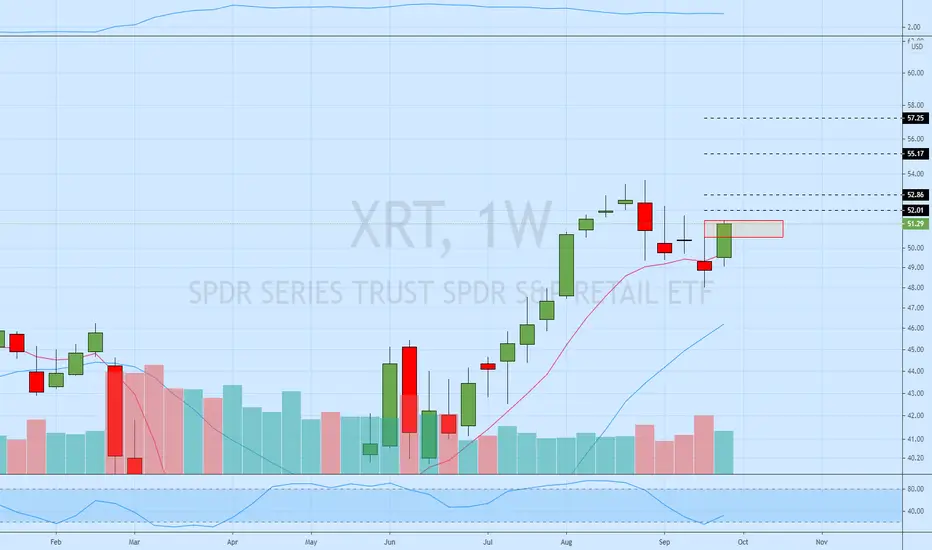
Seems we have a double top - that said on weekly basis looks like it goes higher but a pull back to average price and or support resistance would make sense - which may turn into an inflection point.
Top Five holding are:
Overstock.com, Inc. 6.15%
Lithia Motors, Inc. Class A2.25%
Carvana Co. Class A1.91%
L Brands, Inc. 1.89%
Wayfair, Inc. Class A1.85%

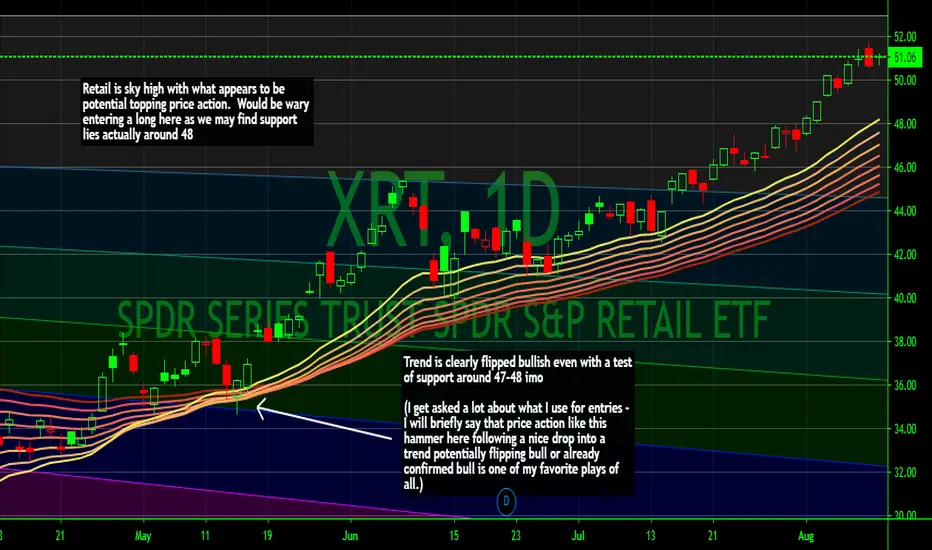
Potential topping in retail, with commentary on a long setupTrend is clearly flipped bullish even with a test of support around 47-48 imo
(I get asked a lot about what I use for entries - I will briefly say that price action like this hammer here following a nice drop into a trend potentially flipping bull or already confirmed bull is one of my favorite plays of all.)
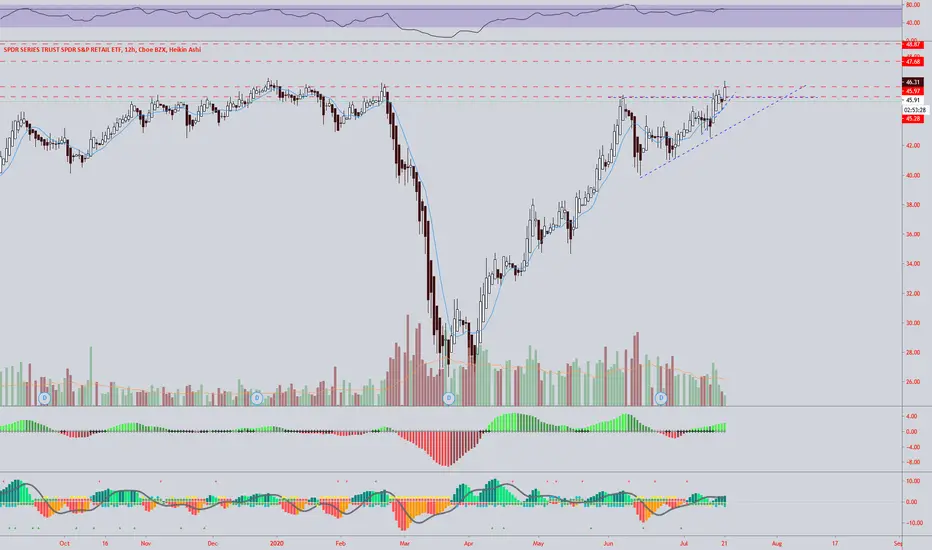
XRT Attempting to BreakoutFundamentally = garbage, but the technicals are pointing to a breakout. It is currently crossing one of the major horizontal resistances, and going up against another.
RSI is showing strength, and the volume profile over the last few months has been significant, compared to earlier in the year.
Today I bring you Sectors $XRT $XLF $XME $IWMXRT - Retail Sector (Non Market Cap Weighted)
XLF - Financial Sector (Market Cap Weighted)
XME - Mining Index (Non Market Cap Weighted - US Miners only)
IWM - Small Cap (Non Tech Giants)
First The critical levels shown on Right Charts are something to be very mindful off.
The Product must hold support for the SPX to move higher. But a Crash in the SPX market wont happen without Russell 2000, QQQ will have to lead the market to a crash. Not happening at this point, I boycott trading short side on QQQ.
These products are Ready to Pop.
I personnally think they are going to breakout and fade back.
For someone who want to make money on this. Build a Spread (OTM), ensure that the IV is in your favor.
In a Nutshell, My analysis is - XLF, XRT, XME all going up, while the QQQ walk down a few steps,
SPX and IWM may have a slight p/b (UCS#2 Long Entry) and then run higher with QQQ.
A Crash right now, although would be great for my account. Is highly unlikely.

Short XRT Target 37Retail earnings will be coming in next week and there will be a lot of bad news that will push the market down. In the options market there are 4x the put volume contract on the XRT. The MACD has already turned over to the down side and you have a clear double top formed all bearish sign for this ETF. Target is the 37 dollar support level


XRT Retail apocalypse headlines coming soon lolTop 3 holdings (5%) = Rite Aid (RAD), Grubhub (GRUB), and Michael's (MIK)... rest of the top 10 doesn't look promising either. www.etf.com

Inner conversation of a trader This could be you or me or anyone else for that matter.
Trend lines and patterns are just a guide , not a 100% accurate , must happen thing for the Market to follow. Anyone attempting to control the market are either out of the market , cursing and swearing never to get in or have busted one too many accounts.
This entire selling saga lasted for 427 days; ie one year and two months. Do you have the patience, stamina to wait that long? Most retail traders would not , I think, maybe a small minority.
Here's a valuable lesson that we can all learn -
If we divide this shorts into 3 trades, then it is likely we are taken out on the first one as the SL would be hit. 2nd short if your SL is above 46.45 , just slightly more , at 46.69 , then with patience you hold this trade and add shorts on the 3rd attempt, you should be handsomely rewarded.
Of course, this is on hindsight and without emotions , it is so much easier to analyse in a logical manner.
The benefits of studying past historical patterns is Mr Market will repeat itself again and again. We just need to be a little hardworking to identify these patterns and understand how to avoid the pitfalls and understand the risks involved.
Not all shorts are 90 degree plunge down and even if it does, you might not be quick enough to catch it. With this kind of shorts, it is on the other extreme, it drags on and on , testing one's patience to the limit.
Like the SPX500 and other indices now, if you believe it is a bear market rally, then how long more will the price continue to rise bit by bit and for how long before we witness the next plunge ?

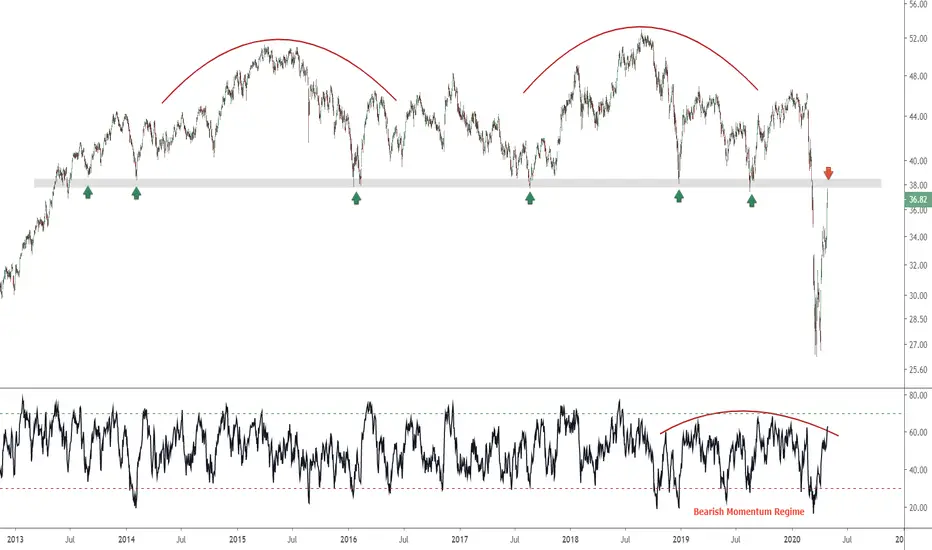
$XRT Approaching Potential ResistanceAfter rallying 40% over the last month is former support about to turn into resistance for Retail? $XRT is approaching a logical level of overhead supply at a variety of key prior lows ~$38. Momentum remains in a bearish regime as the daily RS1-14 has been unable to achieve an overbought reading despite the recent rally. In fact, it hasn't been overbought since 2018.
Retail breaking outOn the news we could see some re-openings of the economy in certain states.
Retail is breaking out of a 2-week consolidation channel; after a double bottom April 3rd.
RSI @60, is in an uptrend. (Bull)
OBV is still consolidating (Bear)
We are testing the 50% fibonacci retracement line at $36.5 (closing price will be important)

Gap closed on XRT Wolfe wave fair structure TL goes way down by Fundamentally retail is dead
Bear Wolfe wave will go from $33 to $23
Time to sell short or buy puts.
Stop just above Thur high.
Great R:R

Retail EFT (XRT) Bear Wolfe WaveBear Wolfe Wave after yesterday's high and then lower close.
Has perfect symmetry.
Most likely it will retrace 0.786 of yesterday's bar today before proceeding down.
Sell short bottom of yesterday's bar, SL at top of bar and target at TL.
Excellent R:R ratio

XRT Retail bankruptcyThe govt can pump all the loans it wants, but retailers are going to go bankrupt. Loans don;t prevent that, just delays it.
Sooner or later everything comes crashing down.....
Note, IWM and XRT look like they're going to break through the previous support.

XRT Inverted H&SXRT calls are a cheap bet if you think the algos will pump futures overnight.
Inverted H&S pattern going as well.

XRT - Ascending Triangle BreakoutThe SPDR S&P Retail ETF closed above the resistance line yesterday but is seeing continuation of that breakout early in today's session. A close above the previous resistance line would confirm the breakout but a price above $45.70 would be better as price has rejected from there a couple of times prior.

black friday, red herringAlready seeing headlines boasting BIGGEST BLACK FRIDAY EVAR!!! Looking like a setup for a good short, especially as a hedge if you're long the overbought scam that is the SPX right now.
Thxgiving week (light blue intervals) has marked a local top or a continuation of a downtrend in 4 out of the past 6 years. The purple indicator is correlation w/ put volume on the SPX. Would like to see a spike here as well as a third touch of that top TL to complete the diagonal wave. Green line is relative performance to SPX which is high and tight right now.
Wave count wise I've labeled it as the end of wave (iv) flat but it could be a leading diagonal as well in various other counts... not too worried about that, what's important is that this looks clearly like a diagonal (either leading or ending) that will likely retrace back to 41 by March.
I've drawn a harmonic which looks like a developing 5-0 pattern (.500 retrace has already rejected it once) which would mean a deeper retrace below 38 to make lower lows. A daily close above that schiff channel would invalidate any immediate reversal.

Holiday seasonality play on RETAIL- XRT LONG IDEAXRT is the retail ETF and every year we get a burst around the holiday season if you're patient.
Over the past three years, starting the beginning of November into December and even through some of January XRT and the Retail sector popped higher off the increased sales through the holiday season. Even last year while we experienced a correction to bear market in the market, the XRT long play had a chance for profitability by $5-6. This time around we expect a move higher from $43 up to $47 even $50 to capture the retail seasonality. The year to date POC is holding good support unless we see a strong market reversal in the last month of the year, the trade has potential.

XRT - H1 CHARTHi, today we are going to talk about XRT
We observe a h1, some important points. The details are highlighted above.
Thank you for reading and leave your comments if you like.
Join the Traders Heaven today, for more exclusive contents!
Link bellow!
Disclaimer: All content of Golden Dragon has only educational and informational purposes, and never should use it as financial advice

XRT UpdateRetail numbers sucked, so of course XRT went up. The market is doing exactly the opposite of what it's supposed to do, lol.
A straddle on the China deal would have netted very little, so I was right not to play it. Fact of the matter is that they still haven't resolved anything, and Dec tariffs haven't been cancelled yet.
But in any case, I wanted to show the plot again just to show the disconnect between the market and reality.
Also, indicators are getting close to overbought, short when it does.
