AUDCAD SHORTS Cpi is coming if its bad this will melt. Other than that it rejected top of zone simple break and retest as always.
AUDCAD trade ideas

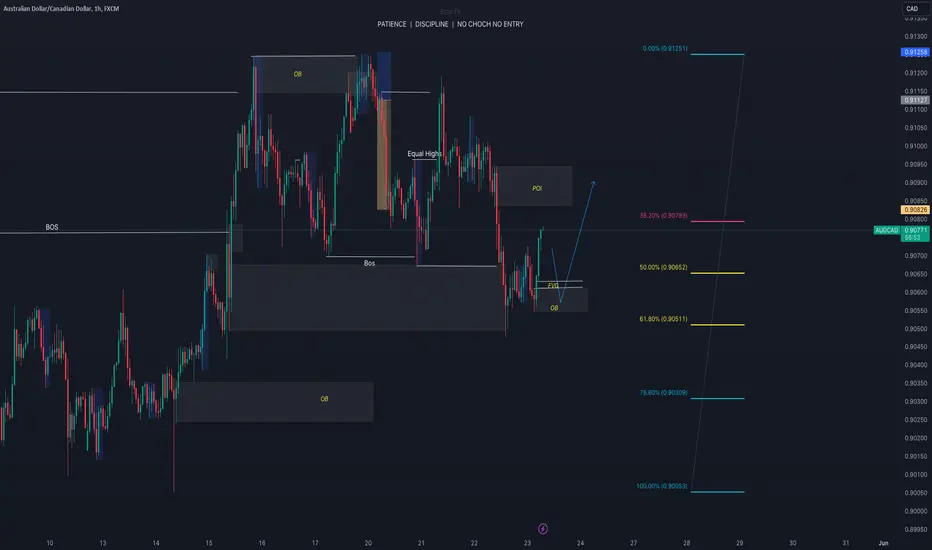
Choch in a ChochNow that the new week has began ,I’m looking for price to mitigate the 1H ob inside the 4h range to move price lower shill will target our daily liquidity

AUDCAD About to test the 1W MA200 after more than 1 year.The AUDCAD pair has been on a structured rise since the September 25 2023 Bottom, which technical is a Double Bottom formation for the long-term. The price is about to test the 1W MA200 (orange trend-line) for the first time since the week of March 20 2023 as well as the Lower Highs trend-line that started on the February 22 2021 High.
Every time the pair approached the 1W MA200 to this distance, it broke above it, even just for the medium-term. We expect a similar development, which would be conveniently a Lower Highs test. Our Target is 0.92250.
-------------------------------------------------------------------------------
** Please LIKE 👍, FOLLOW ✅, SHARE 🙌 and COMMENT ✍ if you enjoy this idea! Also share your ideas and charts in the comments section below! This is best way to keep it relevant, support us, keep the content here free and allow the idea to reach as many people as possible. **
-------------------------------------------------------------------------------
💸💸💸💸💸💸
👇 👇 👇 👇 👇 👇

AUDCAD potential Bat pattern - swing playPaytiently waiting on Audcad to work itself into the harmonic killzone
Once it wicks one of the potential entries then take to a potential take profit point
As of now overall trend for Audcad is bullish
FYI: AUD Red folder CPI on tuesday 9:30 pm EST

✅AUD_CAD TIME TO SELL|SHORT🔥
✅AUD_CAD made a bearish
Pullback from the horizontal
Resistance of 0.9077 so we
Are bearish biased and we
Will be expecting a further
Local move down
SHORT🔥
✅Like and subscribe to never miss a new idea!✅

AUDCAD: Long Signal with Entry/SL/TP
AUDCAD
- Classic bullish setup
- Our team expects bullish continuation
SUGGESTED TRADE:
Swing Trade
Long AUDCAD
Entry Point - 0.9053
Stop Loss - 0.9034
Take Profit - 0.9091
Our Risk - 1%
Start protection of your profits from lower levels
❤️ Please, support our work with like & comment! ❤️


AUDCAD TREND BREAKOUT AND CONTINUATIONThe AUDCAD pair has confirmed a trend breakout, and we are currently observing hourly consolidation forming within a flag pattern. This suggests potential further downside momentum, reinforced by the bearish signals for this pair. We anticipate continued selling pressure, likely bringing the pair back to the highlighted key level.

AUDCAD - TRIPLE TOP 📉Hello Traders !
On Wednesday 15 May, The AUDCAD reached a resistance level (0.90994 - 0.91174).
The price formed a triple top pattern.
At the moment, the neckline is broken.
The support line is broken.
So, i expect a bearish move📉
---------------
TARGET: 0.90295🎯

AUDCAD - Accumulation phase ✅Hello traders!
‼️ This is my perspective on AUDCAD.
Technical analysis: As we can see here price is in a range for the last couple of days, so I expect we can see a manipulation of sell side liquidity and then price to reject from FIBO 0.618 level for distribution.
Like, comment and subscribe to be in touch with my content!

AUDCAD Reversal AUDCAD has been rejected at the daily resistance level forming a Double Top/ with a 4h Divergence.
Sell Stops can be placed at the Neckline.
Sentiments also indicate for a reversal

AUDCAD Bullish Study CaseDisclaimer, these ideas are for my records of what I see in the market after taking a trade. It will help me document the reason of why I took the trade so I can have a track record. And as such, this is not a financial advice.
Currently we are in a monthly pullback due to the break of market structure to the downside in a quasimodo type pattern.
After refining the entry a little bit in both daily and 4 hour timeframes, see below charts, I refined my entry point of interest to the zone highlighted in white, which is a supply zone.

AUDCADhi everyone,
what do you see about this pair.?
i using TF Daily,
and i think this bullish still strong (coz break daily resis ! and found a divergent )
disclaimer
i just share what i see
this is not a signal
be smart
thanks!

AUDCAD - DOUBLE BOTTOM? CUP&HANDLE PATTERN?lets we speculation about chart pattern
what do you see guys?
please share !
a. double bottom
b. cup and handle
c. nothing ! hahahaha!!

AudCadWith price strengthening to the downside, bears look to push prices lower with the break of structure.

AUD/CADBearish Gartley Pattern Breakdown:
1. **Definition:**
- The Bearish Gartley pattern is a harmonic trading pattern used in technical analysis to identify potential trend reversals in the financial markets, specifically signaling a bearish reversal. It is named after its creator, H.M. Gartley, and consists of specific geometric shapes formed by price movements.
2. **Formation:**
- **X to A Leg:** The pattern begins with a significant downward price move (leg) from point X to point A, representing the initial leg of the pattern and establishing a bearish trend.
- **A to B Retracement:** After reaching point A, the price retraces upwards to point B, typically ranging between 0.618 and 0.786 Fibonacci retracement levels of the XA leg.
- **B to C Leg:** From point B, the price resumes its downward movement, forming the BC leg. This leg typically retraces between 0.382 and 0.886 Fibonacci retracement levels of the AB leg.
- **C to D Leg:** The final leg of the pattern extends from point C to point D. This leg typically mirrors the length and direction of the AB leg. Point D serves as the completion point of the pattern and represents a potential selling opportunity.
3. **Key Characteristics:**
- **Fibonacci Ratios:** The Bearish Gartley pattern relies on Fibonacci retracement and extension levels to define the proportions of each leg relative to the preceding leg.
- **Symmetry:** The CD leg is typically equivalent in length (or proportional) to the AB leg, creating symmetry within the pattern.
- **Point D:** Point D serves as the completion point of the pattern and represents a potential selling opportunity for traders anticipating a bearish reversal.
4. **Confirmation and Trading Strategies:**
- **Validation:** The pattern is confirmed when the price reaches point D, completing the CD leg. Traders look for additional confirmation signals such as bearish candlestick patterns, trendline breaks, or volume expansion.
- **Entry and Stop-Loss:** Traders may enter short positions at point D, with stop-loss orders placed above point X or above the recent swing high. This helps manage risk in case the pattern fails.
- **Profit Target:** The profit target for Bearish Gartley patterns is often set at Fibonacci extension levels beyond point D, such as 1.272 or 1.618 extensions of the BC leg.
5. **Example Scenario:**
- Suppose a stock price moves from $100 (point X) to $80 (point A), retraces to $90 (point B), then declines again to $70 (point C), and finally rallies to $85 (point D). This price movement forms a Bearish Gartley pattern. Traders may consider entering short positions at point D, anticipating further downward movement.
6. **Limitations and Considerations:**
- **False Signals:** Not all Gartley patterns lead to successful bearish reversals. Traders should use additional technical analysis tools and indicators to confirm the pattern.
- **Market Conditions:** Market context and prevailing trends should be considered when trading Gartley patterns. Strong bearish trends are more conducive to successful bearish reversals.
Understanding the Bearish Gartley pattern and its formation can assist traders in identifying potential bearish reversal opportunities in the financial markets. However, it's essential to use this pattern in conjunction with other technical analysis tools and consider the broader market context for increased reliability.

AUDCAD: OutlookAUDCAD biased on bearish side. Forming Continuity bearish flag pattern.
Forecasted price 0.90121


AUDCAD is approaching a significant supportHey Traders, in today's trading session we are monitoring AUDCAD for a buying opportunity around 0.90600 zone, AUDCAD is trading in an uptrend and currently is in a correction phase in which it is approaching the trend at 0.90600 support and resistance area.
Trade safe, Joe.

Heading into 61.8% Fibonacci resistance?AUD/CAD is rising towards a resistance level which is an overlap resistance that aligns with the 611.8% Fibonacci retracement and could potentially reverse from this level to our take profit.
Entry: 0.90910
Why we like it:
There is an overlap resistance level that lines up with the 61.8% Fibonacci retracement.
Stop loss: 0.91189
Why we like it:
There is a pullback resistance level.
Take profit: 0.90489
Why we like it:
There is a pullback support level.
Please be advised that the information presented on TradingView is provided to Vantage (‘Vantage Global Limited’, ‘we’) by a third-party provider (‘Everest Fortune Group’). Please be reminded that you are solely responsible for the trading decisions on your account. There is a very high degree of risk involved in trading. Any information and/or content is intended entirely for research, educational and informational purposes only and does not constitute investment or consultation advice or investment strategy. The information is not tailored to the investment needs of any specific person and therefore does not involve a consideration of any of the investment objectives, financial situation or needs of any viewer that may receive it. Kindly also note that past performance is not a reliable indicator of future results. Actual results may differ materially from those anticipated in forward-looking or past performance statements. We assume no liability as to the accuracy or completeness of any of the information and/or content provided herein and the Company cannot be held responsible for any omission, mistake nor for any loss or damage including without limitation to any loss of profit which may arise from reliance on any information supplied by Everest Fortune Group.

AUDCAD analysisIn case of failure, the sales transaction range will be activated! Please be careful!

AUDCADH&S formed that's a reversal pattern & it has now been broken & retested making past support future resistance, there's also an engulfing bearish candle on H2.

idea on a chartWW have a great set up where price could possible go AUDCAD price ended the recent bullish rally by facing the major resistance at 0.9125, to form solid obstacle against recording any new positive target and notice the beginning of activating the correctional bearish track and settling near 0.9060.
Now, stochastic decline towards 50 level will increase the negative pressures on the price, allowing us to suggest more negative attempts and wait to target 0.9020 and 0.8990 levels.