US/UK OILClear descending wedge on a weekly/daily structure, looking for a retest of previous resistance for entry. Break on trend line or 8 daily ema may mean a change of trend
WTI trade ideas

Crude bouncesCrude oil has put in quite a turnaround over the last couple of trading sessions. At the end of last week, Brent and WTI had sliced through support and looked as if they were set to head lower. Both had broken down through the lower ends of their respective trading ranges that had been building since the beginning of this month. But prices suddenly turned higher and Brent and WTI are now comfortably back within their ranges once again. This has seen front-month WTI head back towards $80 per barrel, a level which has held as resistance this month. The daily MACDs on both contracts have been in oversold territory since early this month. But these had flattened out recently and turned higher, suggesting a rally could be on the cards. Well it has now happened, but not before support there was a break of significant support. There are meetings between OPEC and OPEC+ members this coming weekend. The expectation is that the group will extend its current production cuts from June through to the end of September. Before then, there’s an update on the Fed’s preferred inflation measure, Core PCE. This has the potential to upset investors if it were to come in above expectations, and thereby reduce the possibility of Fed rate cuts this year.

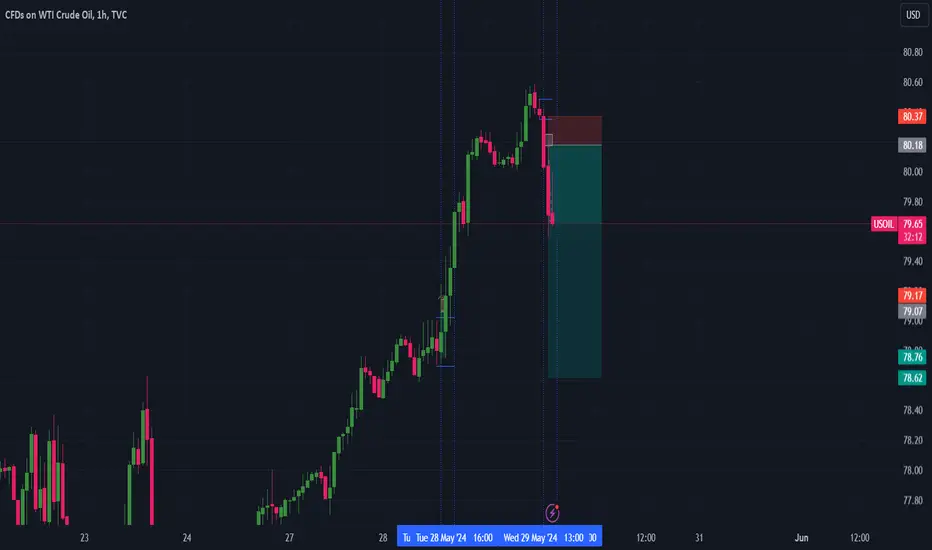
USOIL Downtrend Line Rejection At $78.11 31.05.2024- USOIL downtrend line rejection at $78.11 on 30-minute chart
- If rejection holds, likely drop to $77.44
- Break below $77.44 could lead to $75.53
- If rejection fails, potential rise to $78.63
- Break above $78.63 could push price to $79.00
- Apply Risk Management
_____________________________________________________________________________
Risk Warning: Trading in CFDs is highly speculative and carries a high level of risk. It is possible to lose all of your invested capital. These products may not be suitable for everyone, and you should ensure that you fully understand the risks taking into consideration your investment objectives, level of experience, personal circumstances as well as personal resources. Speculate only with funds that you can afford to lose. Seek independent advice if necessary. Please refer to our Risk Disclosure.
BDSwiss is a trading name of BDS Markets and BDS Ltd.
BDS Markets is a company incorporated under the laws of the Republic of Mauritius and is authorized and regulated by the Financial Services Commission of Mauritius ( FSC ) under license number C116016172, address: 6th Floor, Tower 1, Nexteracom Building 72201 Ebene.
BDS Ltd is authorized and regulated by the Financial Services Authority Seychelles (FSA) under license number SD047, address: Suite 3, Global Village, Jivan’s Complex, Mont Fleuri, Mahe, Seychelles. Payment transactions are managed by BDS Markets (Registration number: 143350)

Crude oil prices resumed their rise,Yesterday said that as long as yesterday's rising market did not break the starting point of the main fall of 3 waves 83.63 US dollars, it can be regarded as 4 waves rebound, currently is not broken 83.63 US dollars, but broke 80.11 US dollars, that is, broke the starting point of 5 waves of our previous number of waves, but now it can also be looked at as the abc three waves after the main fall of 5 waves. That is, the rise of the market from $76.15 to $80.62 is a wave, and the current pullback is a wave b, then the wave b will be back to $78.20-78.50 this range and then rise to $80.63 in order to walk out of a complete wave c, as long as it does not break $83.63 we can look at 4 waves rising. Breaking $83.63 is abc three waves after five waves, not breaking $83.63 is three sub-waves of four waves.
1, below $78.25 long, stop a loss of 30 points, stop a profit of about $80.25 (more aggressive can be long at $78.70).
2, short above $80.55, stop loss 35 points, stop profit of $78.50.
3, if the strategy 2 short is stopped, go short again at $81.70, stop a loss of 30 points, and stop a profit of $79.70.

Crude oil continues to run in the 77~80 rangeCrude oil continues to run in the 77~80 range, waiting for a breakthrough, continue to sell high and buy low
Crude oil technical analysis
Daily resistance 79-80, lower support 76.8
Four-hour resistance is 79-80, and support below is 77-76.8
Crude oil operation advice: Crude oil was under pressure at the 79.2 mark yesterday and ushered in a weak and volatile downward breakthrough. The Asian and European prices fluctuated sideways and came under pressure near the 79 mark, then fell back and fell rapidly, falling back to a weak rebound near 78.2. NY time was under pressure at the 79 mark and ushered in an accelerated decline. Finally, the price fell to around 77.6 and stabilized.
The overall price appears to be suppressed at the 79 mark. Short-term oil prices continue to show a daily red-green cycle rhythm. Today, the lower support focuses on 77.2-77, and the upper pressure focuses on 79.5-80. The day will continue to rely on this range to maintain a wide range of long and short shocks. The watershed between short-term long and short strength still focuses on the 80 integer mark. Before the daily level reaches 80, it will continue to maintain long and short shocks between 77 and 80.
BUY:77.0 near SL:76.70
BUY:76.8 near SL:76.40
BUY:79.6 near SL:79.30
Technical analysis only provides trading direction!

Maybe you could use this analysis and advice!Hello, guys
WTI Crude Oil turned bearish on its 1D technical outlook (RSI = 39.681, MACD = -1.020, ADX = 30.568) but remains neutral on 1W (RSI = 46.231) as it is approaching again the 1W MA200. That is a critical Support as not only it is untouched since February 5th but is the long term level that Oil has been bouncing aggressively on since March 2023. We look towards a Rectangle consolidation-accumulation as the last two times that the 1W MA200 was tested. We will buy on S1 and target the R1 level (TP = 80.60). Until we close over the 1D MA50, our strategy is to scalp this range.
Happy trading


Clean up on Isle 6All ideas are strictly my interpretation of price action. I am not a professional trader nor is this
professional advice.

Crude Oil (WTI) may rise to 80.90 - 81.35Pivot
79.35
Our preference
Long positions above 79.35 with targets at 80.90 & 81.35 in extension.
Alternative scenario
Below 79.35 look for further downside with 78.95 & 78.50 as targets.
Comment
The RSI advocates for further upside.
Supports and resistances
81.90
81.35
80.90
80.23 Last
79.35
78.95
78.50
Number of asterisks represents the strength of support and resistance levels.

WTI TO GO BULLISH!Price may go bullish if we can get a price offer at 78.450. Following the upcoming U.S. pce news coming up, price surged higher today & made 0.25% increase. A buy opportunity is envisaged when price drops to 78.450
Target is 79.00

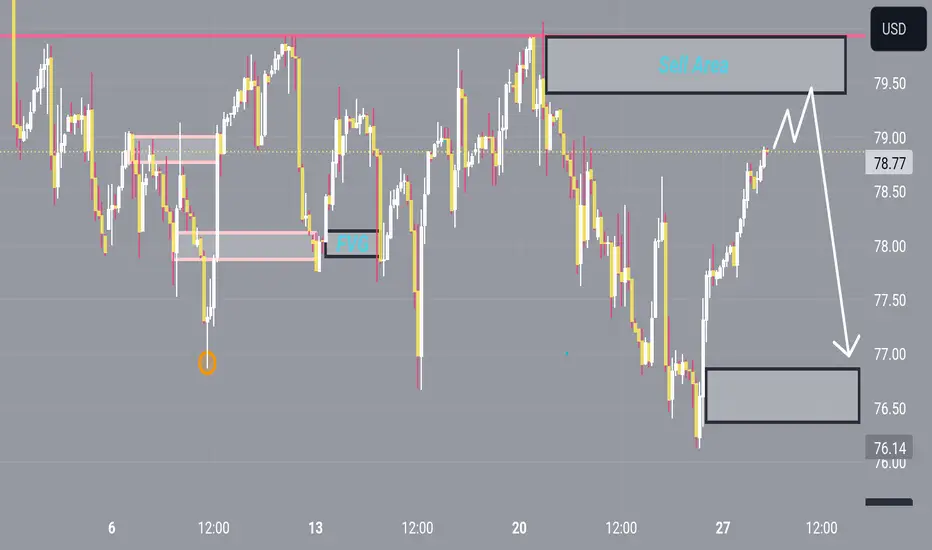
USOIL sell side Hey there on 2hTF the USOIL has looking today sell scenario can be retest from 79.00
79.50 can there again slip downside continue will looks for next support 77.50
Wti ( UsOil ) thats my idea about Wti
up trend first , then going to down trend
but if price break 95.5
its going to need an update ..

USOIL BEST PLACE TO BUY FROM|LONG
Hello,Friends!
Bullish trend on USOIL, defined by the green colour of the last week candle combined with the fact the pair is oversold based on the BB lower band proximity, makes me expect a bullish rebound from the support line below and a retest of the local target above at 78.53.
✅LIKE AND COMMENT MY IDEAS✅

Crude Oil: Long Position Amidst Support and SeasonalityWe are considering a long position on crude oil, given that the price has reached a significant support area. This support level is reinforced by a divergence observed on the Relative Strength Index (RSI), suggesting a potential reversal in the current trend. Additionally, seasonality data supports the likelihood of a bullish movement during this period.
The convergence of these technical indicators and historical trends strengthens our conviction for a long setup. The RSI divergence indicates that the recent downward momentum may be waning, while the support area provides a strong foundation for a potential price rebound. Furthermore, seasonality data, which highlights recurring patterns in price behavior during specific times of the year, suggests that crude oil prices are poised for an upward movement.
In light of these factors, we are looking to establish a long position on crude oil, capitalizing on the technical setup and historical data that align to suggest a favorable entry point for a bullish trade.

Crude Oil (WTI) may rise to 78.30 - 78.70Pivot
77.50
Our preference
Long positions above 77.50 with targets at 78.30 & 78.70 in extension.
Alternative scenario
Below 77.50 look for further downside with 77.15 & 76.60 as targets.
Comment
The RSI is bullish and calls for further advance.
Supports and resistances
79.00
78.70
78.30
78.02 Last
77.50
77.15
76.60
Number of asterisks represents the strength of support and resistance levels.

USOIL DROP CONTINUE Hey there on 4hTF the USOIL has Looks After Reach Out 78
Then We Can Also set our Mind in Sell Area
So If you are looking for again short then entry 78 and hold 73
USOIL Set To Grow! BUY!
My dear followers,
This is my opinion on the USOIL next move:
The asset is approaching an important pivot point 77.12
Bias - Bullish
Safe Stop Loss - 76.27
Technical Indicators: Supper Trend generates a clear long signal while Pivot Point HL is currently determining the overall Bullish trend of the market.
Goal - 78.52
About Used Indicators:
For more efficient signals, super-trend is used in combination with other indicators like Pivot Points.
———————————
WISH YOU ALL LUCK

USOIL (Continuation falling)Oil prices increased early as we mentioned, recovering from a six-week low after a significant 4.3% fall the previous day, which was the lowest point since mid-March. This drop was attributed to an unexpected surge in U.S. stockpiles, indicating softer demand than anticipated.
At the same time, market observers have pointed out that the Federal Reserve has kept interest rates steady, diminishing earlier expectations for a rate cut. PVM Oil Associates commented, "The reduction in borrowing costs may not occur as soon or as quickly as previously thought. It is similar to peak oil demand—consistently anticipated yet never realized."
Technically:
The price has stabilized within the bearish zone, having already breached the pivotal range between 80.73 and 82.24. This suggests a continuation of the bearish trend, with potential targets at 76.80 and 75.35. A further break below 75.35 could lead the price down to 69.78.
Conversely, if the price stabilizes above 82.24, it may indicate a bullish trend, potentially reaching up to 86.86.
Pivot line: 78.00
Support lines: 76.80, 75.35, 69.78
Resistance lines: 80.73, 82.24, 86.86

WTIWTI analysis
1 hour time frame
The price can fluctuate between the ceiling and the floor of the specified areas

USOIL nearly looking for target Hey there on 1hTF the USOIL has looking for all target completed target
So we can observe the oil look for upside and then will drop continue

WTIOIL SELLUsoil looking for more sell side momentum let's short oil 🛢
Fix your Stop-loss and TP anytime spikes will I've the results trail your SL every 30 pips
Survive safely

XAUAUDThe Chart is printing HH and HL with no divergence so the trend is Bullish
The Entry Point will be 80.66 and the stop Loss will be 78.84
