GBPJPY for bearishLooking bearish for this pair after so long in bullrun mode. Hopefully. Trade with your own risk. Any idea please put on your comment. Tq
Forex market

EURJPY: AFTE BOJ Comments- The uptrend is still intactEURJPY: AFTE BOJ Comments- The uptrend is still intact
After BOJ comments we can see that all XXXJPY pairs moved down aggressively.
They said that may increase the interest rates...
Will that happened?
They have lied about this topic several times and nothing has happened and that is why all XXXJPY pairs will not give up their uptrend easily.
You may find more details in the chart!
Thank you and Good Luck!
❤️PS: Please support with a like or comment if you find this analysis useful for your trading day❤️

"AUDCAD Analysis: Engulfing Pattern and Potential Trend Reversa"💹 Let's dive into the analysis of this favorite forex pair of mine! We'll update our previous analysis and check our triggers together for the upcoming week.
⏳ Higher Time Frame Analysis:
In higher time frames like the weekly, similar to most forex pairs, AUD/CAD is oscillating within a long-term box. We observe the fluctuations and trends more clearly in lower time frames.
📅 Daily Time Frame Insights:
On the daily time frame, after finding support at the 0.85918 level, we have reached the top of the box. The candles are erratic, with shadows indicating weakening buyers and potential sellers' presence.
🔍 In our previous analysis, we aimed to open positions in the direction of the ongoing trend, waiting for the trigger and break of the 0.90549 resistance. After breaking it, lower time frames allowed for position openings, reaching the 0.91245 resistance.
💡 After hitting this resistance, buyers showed little interest in opening positions, and currently, the pair is oscillating between the 0.90878 and 0.90549 box.
⏳ Four-Hour Time Frame Analysis:
In the 4-hour time frame, the latest candle displayed significant seller strength, engulfing the previous candles and increasing the likelihood of a decline. If we break the 0.90549 support, we will have formed a lower high and broken a lower low.
📉 Short Position Trigger:
We need to break the 0.90549 support for a short position. This will indicate a new trend, though we don't necessarily need a trend change since the higher time frames are still ranging.
If you receive this analysis early, you can use the current 4-hour engulfing candle with a stop loss around the 0.90878 level.
📈 Long Position Trigger:
For a long position, if we fake out the support, we can move to lower time frames. Breaking the 0.90878 trigger can open a long position, but it is more logical to wait for a break of 0.91245 for confirmation.
🛡️ Future Additions:
Soon, we will add a new section to this channel about bullish crypto coins. We will analyze and review this data thoroughly for you! :)))
🔻 Key Support Levels:
0.90173 , 0.89702 , 0.88951
🔺 Key Resistance Levels:
0.91245 , 0.92073 , 0.93288
🌟 I hope you have a great weekend and can utilize this analysis for a profitable week ahead! :))

GBPCHF: Bulls to continue pulling upwards! OANDA:GBPCHF
GBP has been bullish since last few months especially from the beginning of the year 2024, it is also notable to see how bearish is chf. Going forward, we expect price to continue bullish and it hitting our target is almost certain. Please wait for price to come to our area once it does, please take the trade with accurate risk management.
**If you like our work then please like, comment and follow which will encourage us to bring more educational ideas**
Team Setupsfx_

Gbpusd (H4) PredictionsGBP/USD is on the defensive below 1.2700 in the European morning on Thursday. A broadly stronger US Dollar amid waning Fed rate cut expectations and risk-aversion, keeps the pair undermined ahead of US data and Fedspeak.

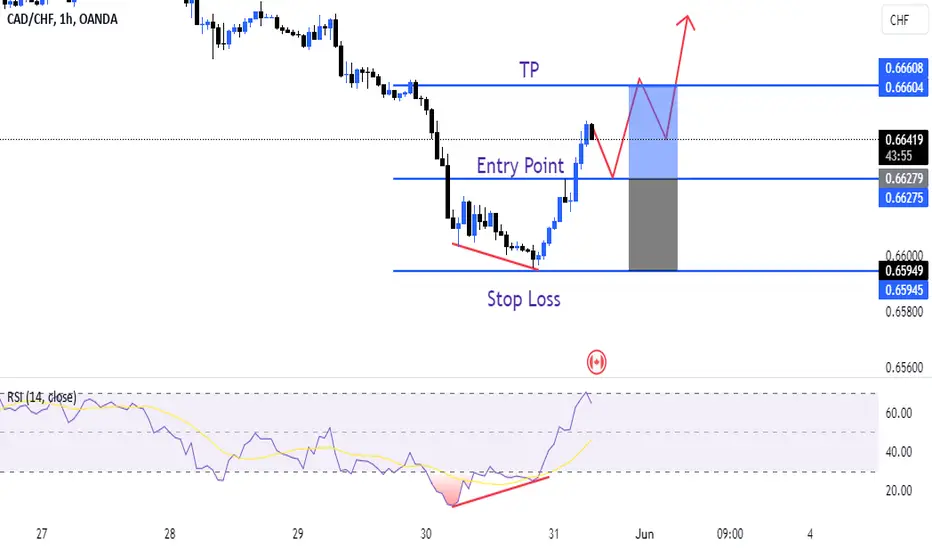
CADCHF IS IN BULLISH TRENDCADCHF is in bullish trend because bullish divergence printing on 1H & 4H time frame buy at retracement of fib level 0.38 or 0.50 complete trade plane is mentioned in chart
NZDJPY Approaching the top of 3.5 years Channel Up. Strong sell.The NZDJPY pair is trading on the 4th straight green 1W candle and is approaching the top (Higher Highs trend-line) of the Channel Up pattern that started on November 2020. Even though it may extend to a +9.30% rise (the smallest long-term it had within the pattern), selling now offers excellent Risk/ Reward conditions. Our target is 92.000 (Higher Lows trend-line).
-------------------------------------------------------------------------------
** Please LIKE 👍, FOLLOW ✅, SHARE 🙌 and COMMENT ✍ if you enjoy this idea! Also share your ideas and charts in the comments section below! This is best way to keep it relevant, support us, keep the content here free and allow the idea to reach as many people as possible. **
-------------------------------------------------------------------------------
💸💸💸💸💸💸
👇 👇 👇 👇 👇 👇

EUR USD - PRICE HAS TO TAKE A SUPPORT AT 0.5 FIB LEVELEUR USD small sell entry to the 0.5 level fib marked price on chart, price will be take support, follow for more live updates...

EURUSD - 8 Hrly Chart - Weekly Forecast - 03 June 2024The two potential bullish and bearish options for the week ahead
I wouldn't trade till we reach one of these two areas

USD/JPY Loses Ground Despite Strong Economic Data but..The Japanese Yen continued to weaken on Thursday, even as economic data showed a positive trend. The Tokyo Consumer Price Index (CPI) increased to 2.2% year-over-year in May, up from April's 1.8%, which marked a 26-month low. In addition, Japan’s Retail Sales (YoY) grew 2.4% in April, accelerating from a downwardly revised 1.1% rise in March and surpassing market forecasts of 1.9% growth. This marks the 26th consecutive month of expansion, indicating a sustained period of healthy consumption in Japan.
Monetary Policy Implications
The Bank of Japan (BoJ) has maintained its deeply entrenched monetary policy stance. Should nationwide inflation in Japan decline, it would prevent the central bank from raising interest rates. The significant rate differential between Japan and other countries continues to exert pressure on the Japanese Yen, underpinning the USD/JPY pair.
US Dollar Rebound
The US Dollar (USD) rebounded ahead of the Federal Reserve's preferred inflation gauge, the Core Personal Consumption Expenditures (PCE) Price Index, which is due to be released today. However, the decline in US Treasury yields could limit the advance of the US Dollar.
Technical Analysis
From a technical perspective, we are anticipating a rebound for the Yen, particularly if the US Core PCE Price Index shows a negative impact. The footprint analysis reveals several areas of demand on the daily timeframe chart, where the value could find support for a possible reversal.
Investors should monitor the upcoming Core PCE data closely, as it will likely influence the near-term direction of both the USD and JPY.

EURUSD continues to target 1.1000Dear traders! On the demand timeframe we see EURUSD trading on an uptrend basis after it previously broke out of downtrend resistance. The technical outlook is optimistic and the Uptrend will certainly be supported by buyers higher and we would expect a local price increase targeting the medium to long term near the 1.1000 mark.

EURUSD downtrend continuesDear traders! EURUSD continues to remain within a medium to long-term downtrend channel despite some mild recovery yesterday, but overall still unable to overcome 1.0850 resistance amid shifting sentiment from That pulled the EU down sharply to near the 1.0800 support level as of now. Accordingly, Resistance at 1.0850 continues to hold prices amid correction and sell-off. I expect that after a recovery and testing the liquidity of the market, the price will decrease. This decrease is expected to reach 1.0790 and 1.0755 at least.

EURGBP Bearish Trading IdeaDisclaimer, these ideas are for my records of what I see in the market after taking a trade. It will help me document the reason of why I took the trade so I can have a track record. And as such, this is not a financial advice.
On the weakly timeframe, the pair was going lower steadily without leaving any supply zone unmitigated. The only imbalance the market left was at the start of 2024, which was later mitigated on May.
On the daily timeframe, we are bearish, shown by the recently created change of character (CHoCH).
On the 4 hour timeframe, we made a new CHoCH leaving an imbalance to be mitigated.
On the 1 hour timeframe, I've highlighted a demand zone to be mitigated, I'll be buying in this area up until the highlighted area of interest above, from which I'll be looking for sells.

CADJPY relentlessly bullish - going towards multi-year highsIchimoku Kinko Hyo is a complete trading system and I will be using it a lot more than I have been. Here are my reasons for continuing to be bullish on this pair:
Tenkan sen (Conversion Line) thick blue crossed over Kijun sen (Base line) red line.
Price – holding above the Kumo cloud
Chikou Span (Lagging Span) black line is holding above price and the cloud.
Kumo Cloud now – green color indicating bullish bias.
Kumo Cloud future – green color indicating bullish bias.
Thursday candle - hammer
For stop, I will be trailing it below the Kijun sen.
Target should initially be just below the recent (spike) multi-year high at 117.330.
My trade idea is 1 day late, should have taken a long trade on Fri after the hammer candle but I did not see it. Pull backs usually happen and a nice big pull back would be very welcome as it would give a better entry.
This is not a trade recommendation.
Trading carries a high level of risk, so only trade with money you can afford to lose. Anything can happen in the markets at any time. Please use sound money and risk management in all your trades.
If you like my idea, please give a “boost” and follow me to get even more.
Please comment and share your thoughts too!!

SHORT EURUSDAs we are seeing in the chart,
1. from the left in 1h, liq has been sweept
2. after the price have cleared the the liq it droped.
3. price went to retest the liq zone
4. from retesting the zone, it droped and left the gap
5. zoom to 15TF, wait the price to fill
6. short it.
This is not a financial advice.

EUR_CHF WILL GO DOWN|SHORT
✅EUR_CHF made a retest
Of the broken support level
Of 0.9842 which is now a
Resistance so we are bearish
Biased and we will be
Expecting a further move down
SHORT🔥
✅Like and subscribe to never miss a new idea!✅

USD-CHF Bullish Bias! Buy!
Hello,Traders!
USD-CHF is going down
Towards the horizontal
Support level of 0.9000
From where we will be
Expecting a bullish rebound
From the level below
Buy!
Like, comment and subscribe to help us grow!
Check out other forecasts below too!

GBPCHF: Potential Bullish Continuation 🇬🇧🇨🇭
GBPCHF is trading in a strong bullish trend on a daily.
After the price updated a higher high, the market started a correctional movement.
The pair is currently approaching a significant support cluster.
I believe that probabilities are high that the next bullish wave will initiate from that.
We can expect a growth at least to 1.16
❤️Please, support my work with like, thank you!❤️

correction Considering the behavior of the price in the current support range, it is expected that the continuation of the downward trend will be formed according to the specified paths

GBPCAD Money Heist Plan in Bearish DirectionMy Dear Robbers / Traders,
This is our master plan to Heist GBP/CAD Bank based on Thief Trading style Technical Analysis.. kindly please follow the plan I have mentioned in the chart. Our target is Green Zone that is High risk Dangerous level MA act as a Dynamic Support & Order Block, So the Market is oversold / Consolidation / Trend Reversal at the level Bullish Robbers / Traders gain the strength. Be safe and be careful and Be rich.
Note: If you've got a lot of money you can get out right away otherwise you can join with a swing trade robbers and continue the heist plan,
Loot and escape on the target 🎯 Swing Traders Plz Book the partial sum of money Use Trailing Stop To Protect Looted Money and wait for next breakout of dynamic level / Order Block, Once it is cleared we can continue our heist plan to next new target it will update after the Breakouts.
support our robbery plan we can easily make money & take money 💰💵 Join your hands with US. Loot Everything in this market everyday.

USDCAD: First red day in the backside moveHi everyone and welcome to my channel, please don’t forget to support all my work subscribing and liking my post, and for any question leave me a comment, I will be more than happy to help you!
“Trade setups, not movements”
1. DAY OF THE WEEK (Failed Breakout, False Break, Range Expansion)
Monday DAY 1 Opening Range
Tuesday DAY 2 Initial Balance
Wednesday DAY 3 (reset DAY 1) Mid Point Week
Thursday DAY 2
Friday DAY 3 Closing Range ✅ Day 2 cycle
2. SIGNAL DAY
First Red Day ✅
First Green Day
3 Days Long Breakout
3 Days Short Breakout
Inside Day
3. WEEKLY TEMPLATE
Pump&Dump ✅
Dump&Pump
Frontside
Backside
4. THESIS:
Long: secondary, I saw many times monday placing the high low of the week (opening range), and market coming back into that level for a breakout, pullback, continuation into the original trend, however, considering the market overall in the backside move, counter trending (as a scalp), will be my second option if a buy low opportunity is presented.
Short: primary, first red day, yesterday the HOW failed and started dropping down with interesting bearish momentum. Waiting the news release before looking for a sell high opportunity, going to stop traders long from Tuesday.
Please note that the purpose of my analysis is to help me and you hunting the best trade setup for the day, none of my technical aspects are a way to forecast any directional market movement.
Gianni

@@@@@ AUDCAD UNIQUE IDEA $$$$$#AUDCAD
UPDATE
Hey team hope you all are enjoying our ideas and analysis now we are here to discuss about AUDCAD. AUDCAD almost breakout done. After this breakout we can see drop upto 100Pips+ soon ✍

EURCHF: Long Trading Opportunity
EURCHF
- Classic bullish pattern
- Our team expects retracement
SUGGESTED TRADE:
Swing Trade
Buy EURCHF
Entry - 0.9798
Stop - 0.9756
Take - 0.9859
Our Risk - 1%
Start protection of your profits from lower levels
❤️ Please, support our work with like & comment! ❤️
