PLTR: Buy ideaOn PLTR as you see on the chart we could have a hight probability to have an uptrend if only if we have the breakout with force the vwap and the resistance line by a big green candle follow by a large green volume! Thanks!

$NVDA to 1150 by May.. Look back at THEE NVDA call.. #BullflagAfter multiple retests of 61.8 fib, I think JPOW just gave clearance past 1k. I implore you to look at what AVGO did when it broke 1,000 critical level as well as look back at TSLA in 2020 pre/post stonk split. NVDA is now a STONK, and those only go up. AMEX:SPY trend line was regained today, classic shake out before next leg up, thought we'd get a better dip honestly, jobless claims tomorrow probably priced in,,, kind of hard not to long this bull flag setup with the trend on your back, look for cheap 1050c for a couple weeks out is my target. Will post position in AM.

GMEWith the new issue sold out in one week and $2 billion now on the balance sheet things are looking up. Non performing store closures should begin to show up in the bottom line in the near future. The question has been raised as to how much shadow short interest actually exists on this security… how is that a thing/is it really a thing?
The chart has a trading range which once broken should result in a big move in either direction. With Apes holding strong…
I’m in for the potential short squeeze moonshot!

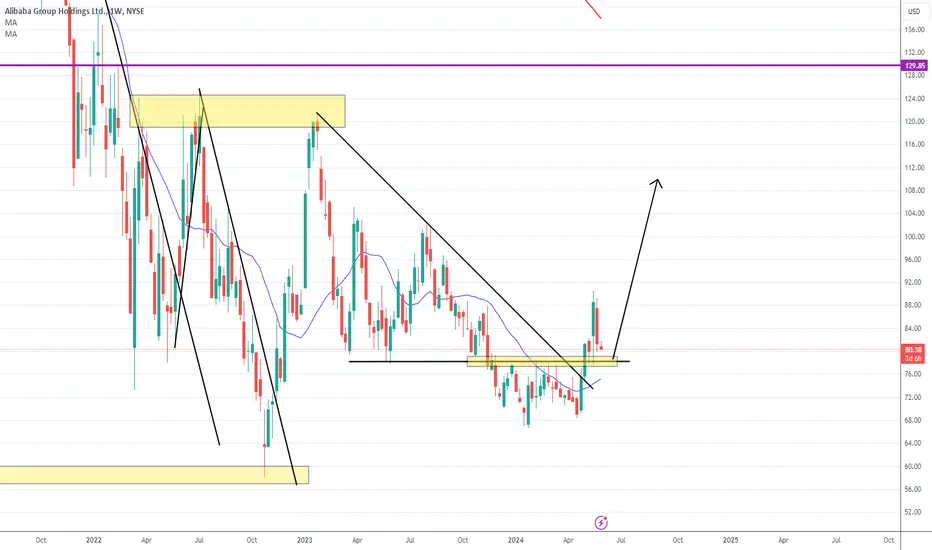
longCan we see a big move up on alibaba? We should watch if this can do a retest to the support zone
RIOT Platforms - Corsicana 2024! 🍿🤗🕺Been buying shares of RIOT, and will continue to add shares anytime this gets in the 9s. After a couple bad years of production, RIOT's new Corsicana facility is energizing and the new miners will boost hashrate and increase efficiency. Oh, and lets not forget the 8500 Bitcoin on the balance sheet and positive earnings. RIOT has been undervalued for too long!
As for the technicals, everything looks golden imo. Macro trend from 2020 retested. 618 held, .50 held. Not seeing anyway bears get this back to the 7s.
LFG!

AMC pumps price and volume into fair value zone LONGAMC is on a 4H chart with a set of VWAP bands overlaid In the past two trading sessions price
and volume have pumps and so also the PV Trend indicator. There is no fundamental
footprint on this move. it is a pure meme much like a similar move of GME. I will go long
here hoping to ride the momentum and capture profit. I will set a stop loss fo 10% n
recognition of the volatilit The final target is the $ 120 range pivots of April and
August 202. The initial target is the $35 range of the ranging zone of August 2023. Upon
reaching the first target I will cut the position to 50% for the leg higher. I will cut the position
if momentum fades especially if the volume fades with it. This will be interesting at the least
and highly profitable at the very most.

COIN - COINBASE LongDear traders,
Id like to share this idea in order to take long positions, basically the price is within a bullish trend correction (flag bullish pattern), it look likes a quite healthy uptrend so we look at buying opportunities.
The idea to open new positions now is acceptable (230 Dollars), we might see Coinbase in 400 dollars. it might be pushed up with the potential ETH ETF approval.
best,

Pfizer implements $1.5bn cost-cutting initiative. Idea 27/05/24Pfizer Inc. (PFE) has announced a new multi-year plan to reduce operational costs by approximately 1.5 billion USD by the end of 2027. This initiative is in addition to a previously announced 4 billion USD cost reduction strategy in response to decreased investments and a sharp decline in sales from its COVID-19 vaccine. Amid these challenges, Pfizer has actively restructured its operations, including acquiring cancer drug manufacturer Seagen for 43 billion USD, aiming to diversify and strengthen its product portfolio.
Despite these financial adjustments, Pfizer has raised its full-year earnings forecast following better-than-expected earnings in Q1. These results were partly attributed to the successful implementation of cost-saving measures. To bolster its financial standing, the company focuses on operational efficiency, restructuring its network, and enhancing its product portfolio.
Given this backdrop, let's examine the potential trading opportunities for Pfizer Inc. (NYSE: PFE):
On the Daily (D1) timeframe, Pfizer's stock shows a resistance level at 29.65 USD and support at 28.45 USD. The resistance line of the ongoing downtrend has been breached, suggesting a potential shift in market sentiment. If the trend reverses downward, a possible target might be 25.30 USD.
If the current uptrend persists, a short-term target is 31.90 USD upon rebounding from the 29.65 USD resistance level. For a medium-term strategy, the stock price could reach 34.10 USD if the upward momentum continues.
—
Ideas and other content presented on this page should not be considered as guidance for trading or an investment advice. RoboMarkets bears no responsibility for trading results based on trading opinions described in these analytical reviews.
The material presented and the information contained herein is for information purposes only and in no way should be considered as the provision of investment advice for the purposes of Investment Firms Law L. 87(I)/2017 of the Republic of Cyprus or any other form of personal advice or recommendation, which relates to certain types of transactions with certain types of financial instruments.
Risk Warning: CFDs are complex instruments and come with a high risk of losing money rapidly due to leverage. 69.88% of retail investor accounts lose money when trading CFDs with this provider. You should consider whether you understand how CFDs work and whether you can afford to take the high risk of losing your money.

MSFT Bullish Continuation out of a Cup and Handle LONGMSFT on the daily chart shows the price action in the bull run out of the Covid lows then a
cup and handle pattern is printed and finally bullish continuation above the level of the cup.
Since the cup has a height of $145 and the level of the lip of the cup is $345, the pattern
forecasts bullish continuation for $ 145 above the cup's lip at $ 345 and so targeting $ 480.
I will continue to add to my MSFT position while watching for pivot lows on the 120-240 minute
charts. MSFT is a major player in the AI space and could even launch its own semi-conductor
division to compete with NVDA and the others. It has a healthy balance sheet and free flowing
cash from which to grow without dependence on interest rates coming down. The RSI indicator
shows consistent strength without signs of being overbought.

COIN setting up long after a pullbackCOIN has a big jump July 13 after some good news on SEC litigation against crypto
and a court ruling was issued. It is shown here on a 15 minute chart.
Since a double top it went sideways for a week and then down trended. The anchored VWAP
bands serve to give context and serve to show dynamic support and resistance price was at the
mean VWAP on July 13th when it popped. In the price action since price did a VWAP breakout
and then a breakdown to bounce off the same mean VWAP black line and is now a bit above it.
As I believe COIN is now trending up with the relative strengths of the low and high time frames
at about the 50 level. I have set a stop loss below the VWAP line and targets as TP1 -105
TP2- 107 and TP3 -109 although the price could reach the highs of 7/13 especially if
there are legal or regulatory updates favorable to the cryptocurrency sector. I will also take
a look at RIOT and MARA.

Bitcoin Miner Riot Platforms Set to Acquire Bitfarms for $950M Bitcoin mining giant Riot Platforms ( NASDAQ:RIOT ) plans to acquire Bitfarms Ltd. for $950 million, signaling a significant consolidation trend in the sector after the Bitcoin halving event. Riot aims to take over Bitfarms after acquiring a 9.25% stake, offering $950 million in cash and stock, marking a pivotal moment in the industry's evolution. The proposed acquisition underscores the ongoing consolidation in the Bitcoin mining sector, spurred by the recent Bitcoin halving event.
Riot's bid for Bitfarms, valued at $950 million, positions the combined entity as a dominant force in Bitcoin mining globally. This consolidation trend mirrors the larger shifts in the cryptocurrency market, as companies seek strategic alliances to navigate evolving market dynamics. Riot's offer to Bitfarms comes amid management upheaval within the latter, with Bitfarms recently terminating its interim CEO, Geoffrey Morphy, following legal disputes.
Despite Bitfarms' rejection of the initial offer, Riot ( NASDAQ:RIOT ) remains steadfast, planning to push for discussions and propose new directors to enhance corporate governance. Bitcoin mining faces challenges post-halving, impacting profitability for miners. Riot, with its extensive mining facilities in Texas, aims to capitalize on market opportunities, while Bitfarms expands its global footprint, particularly in South America, leveraging cheaper electricity costs for mining operations.
Both NASDAQ:RIOT and NASDAQ:BITF stocks surged post-announcement, reflecting investor interest in the Bitcoin mining sector, but sharply retraced to new support level currently trading down by 0.72%.

🔥🚀 **NVDA Update 27 May Gap Up Mania or Brief Correction! ** On Thursday, NVDA skyrocketed, smashing through the roof with a new high of 1063.13! By Friday, it closed above the last swing high at 1064.89, signalling a strong continuation of the bullish trend.
Investors are eagerly gearing up for a thrilling Tuesday, anticipating powerful moves ahead. Two exciting scenarios could unfold:
1️⃣ **Gap Up Mania!** 🌟 - With market sentiment glowing with positivity, we might see another gap up, potentially pushing the price to a staggering 1134, mirroring the previous exhilarating gap.
2️⃣ **Bullish Correction!** 📉➡️📈 - Alternatively, a brief correction to 1032 could set the stage for an even stronger uptrend.
The RRG analysis is buzzing with optimism, showing the XLK and SMH sectors in the leading quadrant.
Conclusion:
Get ready!! because NVDA is poised for an electrifying ride! 🌟📈💥

$nvda update #Nvidia #NVDA update:
#Wallstreet back online after holidays with a familiar trend.
As major chipmaker stocks significantly outperformed the broader market.
Nvda stocks surged over 6% ->1.128, reaching New ATH.
( #ElonMusk xAI plans to build supercomputer fuel by #nvidea chips )
NVIDIA keeps on producing incredible results. We got ourselves another gap up to the next PPoint(1D). At this point we have adjust frames to continue analysis of the price movement but don't be surprised to see R5 touched, if R4 holds. Would like to see a double b bounce as with previous point for further confirmation.

NVAX pushed to bottom of its channel LONGNVAX powered off its earnings and a news catalyst and is overdue now for a correction. While in
an ascending channel NVAX is now at the bottom of the channel perhaps due to the general
market moves this week. From here it can move up in the channel or breakdown and fall into
a significant correction from the uptrend since May 10th. I am bullish on NVAX and have
a prior perspective of an insider. I have realized profit six figures from my call options for
January 2025 and have a large number remaining in the trade. At this juncture, I will watch
for NVAX to move up in the channel and take a trade of shares and some call options
for 15.00 expiring in June 2025 to take advantage of long term capital gains on the options.
The FDA is currently reviewing some COVID vaccine data which is particularly relevant to
NVAX. The volume profile has a shelf at 14.25 which will be my stop loss on the shares.
The options will have a 20% stop loss. Considering the level from which NVAX has fallen over
a period of some period there is great potential in my opinion.

5/28/24 - $cava - number go up, valuation irrelevant for now...5/28/24 - vrockstar - NYSE:CAVA - taking a look at google trends... clearly we've not hit peak cava so... the market has tended to love these stories in the last 6-12 mo where you can't even see the peak.
so valuation be secondary - even if it's 10x sales. NASDAQ:WING is closer to 20x, right? investing all profits (so no free cash) for cava... into growth?
it's a good concept, fresh, nice. it's not NYSE:CMG , but it occupies a different niche and does it well, i like the margins better than NYSE:SG too.
i'd be tempted to trade this long into the results, just bc of this momentum on the charts, fundamentals, etc. any miss gets bought, any beat/ positive fwd speech (this is impossible to deny/ miss on right? and it matters a lot)... sends this ripping to higher highs. reasonably shorted at 6 dtc as well. wouldn't play short in indices hitting ATH's either esp for marginal winner name in it's industry.
number go up.

AMD correction done. TIME TO RISE! Huge bargain deal.AMD went on a good correction phase after touching a recent peak at 220 area following the market's long term trim action. Profit takers has swept the market even the top guns with the likes of NVDA, TSLA, AMZN, AAPL.
Based on recent data, it looks like the market's correction has more-or-less come to an end -- and net positioning for most blue chip stocks has already commenced.
AMD is one stock which you can't dismissed it's price growth potential after that huge discount drop. You know it's a bargain when a growth company gives it to you -- and not just a growth company, a major chipmaker / tech giant which the world can't live without. with the advent of AI and modern tech revolutions, AMD is one stock you can bet in the next 50-100 years.
Based on recent daily data, we are currently bouncing off a major order block support at 150.0 area -- and a significant shift has been spotted. More series of ascending action is expected from this range -- with a possible breakout of its recent peak at 220 this year.
This one, I won't doubt.
Spotted at 150.0
TAYOR.

MRNA Taking Profit, Watching for a add LONG after a pullback.MRNA has been on fire since the earnings beat 4 weeks ago and has added 60% to its market cap
in the past three months. It compares well with NVAX which as a prior penny stock has more
volatility and upside potential. In general vaccine stocks are performing well as COVID RSV
and influenza vaccines are active in research are Viral Hepatitis vaccine enhancements and
the drive for an HIV vaccine.
MRNA is strong and perhaps becoming overbought. The mass index indicator has topped and
maybe falling to the trigger line. I will take a one- third partial off my position here
and wait for a pullback with reversal to add back into the position at a lower price.
The tandem of MRNA and NVAX has been very profitable for me. Careful in trade management
will help me keep it that way.

GME new bullish momentum LONGGME on a weekly chart has clear the chop zone on that indicator and is now above the POC
line of the long -term volume profile indicating that bullish momentum is greater than bearish
momentum. I will take a long trade here targeting the pivot highs of 2022 for three quarters
of the trade and the base of the high pivots of 2021 for the reminder. 21.7 below the POC
line will be the initial stop loss to be moved to break even upon a price rise of 10% from the
entry and then changed to a trailing loss of 10% upon another 10% price rise. I believe that
GME is heavily shorted; Accordingly, a short squeeze could add to the push higher.

ZURA a med tech microcap with catalysts LONGZURA a penny stock has catalysts- an FDA action is soon upcoming and an insider bought a lot
more shares. The 120-minute chart shows a solid trend up since earnings March 28th. This
pre-revenue company beat earnings with less cash burn than expected. Another earnings
report is about a month away. Price has settled to the support of the longest EMA line.
I see an opportunity here for a long trade toward the earnings in a month. The longer black RSI
line above the 50 level while the shorter green line shows the oversold undervalued condition
for an entry.

IPW - a penny energy stock LONGIPW on the 60 minute chart has went 3X since a big beat on earnings and revenue a couple of
weeks ago Price peaked at the 3.4 area in the post earnings move higher had has now faded to
1.9 in a healthy pullback and Fib retracement. The down trend from the pivot high on 5/17
ended with a bottom and a golden cross of moving averages on May 22nd. The all-time high for
was in the range of 8 back in 2022. I see IPW as having as much as 400% upside. I will take
a swing long trade and likely carry it to the next earnings in about 11 weeks. The entry stop loss
will be 1.7 to be raised as the trade progresses.

AAPL NEN ZONE /PINBALLRectangles are potential support and resistance zones, specifically relevant only in their timeframe of existence on the chart.
Simple project in theory but from a mathematical perspective of probabilities an distribution of events, could be hard to achieve. The goal of the project (/after the simulations of potential pathways and important events projected in time with their relevance) is to "CATCH" 3 major inflection points AT any of the elements in the drawing. Hard to trade such bold scenario or attempts, without a solid background of a system that has been back tested, forward tested, and rigorously scrutinized through statistical analysis and a lot of math, but it can be done and the exist strategy is simple: inflection point means you expect the market to turn around and you go against the recent move, if it goes against the position after 1 trading day, and breaks the low/high of the signal entry day, exit, other wise wait for another inflection point to cash in.
To make things more simple, this is similar to a pinball game where the price is the ball. Inflection point means the ball jumps somewhere else, preferably in the other direction for good.
This idea won't have the usual updates with analysis of Japanese Candlesticks. This is just for show. Hopefully some good pivot points will occur on this one: short and long, and to spice things up a bit, some models might anticipate that one of them could be an absolute doozy. Let's just sit back relax and enjoy the pinball show.

Apple Stock Predicted to Surge Fueled by AI and iPhone 16 HypeApple stock is set for a potential 50% surge, according to Wedbush analyst Dan Ives, who projects a market cap exceeding $4 trillion next year. This optimism is driven by the upcoming WWDC event on June 10, expected to feature significant AI announcements, and the iPhone 16 "supercycle" anticipated in September. Ives has increased his price target to $275, citing AI innovations and a strong iPhone upgrade cycle as key growth factors. Supply chain checks also indicate strong sales, supporting a positive outlook.
* Bullish outlook: Wedbush analyst Dan Ives predicts a significant surge in Apple stock (AAPL) by nearly 50%, potentially reaching a $4 trillion market cap within a year.
* Key catalysts: This growth is driven by the upcoming iPhone 16 "supercycle" featuring advanced AI integrations and a potential partnership with OpenAI.
* WWDC 2024: Apple's Worldwide Developers Conference (WWDC) on June 10th is seen as a pivotal event for unveiling these AI advancements.
* Positive supply chain indicators: Strong April sales exceeding expectations bolster confidence in a successful iPhone 16 launch.
* Investor optimism: Apple's strategic embrace of AI and the iPhone 16's potential position investors for substantial gains.

LCID Anchored VWAP based swing trade LONGLCID on the 15 minute chart is shown with two sets of anchored VWAP lines overlaid being set
at the pivot low of April 22 and the pivot high of May 6th. LCID completed a trend down today
which began on May 6th. Price has reversed and is breaking up through VWAP band lines on the
chart. The faster green RSI line has crossed over the 50 level in the past trading session. Price
is now about to cross over the longer mean black VWAP line. I am taking a long trade here
targeting 2.88 for 25% of the position, 3.10 for 50% of the position and the reminder for a
runner position to extend for the uppermost band lines. The first two targets are based on the
intermediate VWAP lines as well as the upper and lower boundaries of a standard Fibonacci
retracement. The stop loss will be raised incrementally from its initial setting of
2.74 at the top on the EMA cloud. As the trend down took a few weeks. I am expecting a 2-3
week long trade following a projected trend up.
