DOT USDTdot usdt possible inverse head and shoulder on daily timeframe hints a major correction. Although the right shoulder is somewhat dragging but still can count on it if it breaks the neckline in the upcoming weeks
DOTUSDT trade ideas

Polkadot (DOT): Possible Breakdown To HappenPolkadot has been bouncing from one side to another, and now we see pretty strong pressure to lower side of the triangle formation here.
We see that the price touched nicely on the lower side here and yet is showing some weakness after a small attempt to breakout.
We are now looking for a breakdown as mentioned earlier, and as soon as we get it, we should see a nice small drop towards the lower support zone (liquidity grab zone).
Swallow Team

DOT has been consolidating for last 4 weeks!As you can see DOT is in a consolidating phase at the bottom of the trend line, in the next months price can pump to the top range, whitch is 16-20$!

dotusdtCRYPTO:DOTUSD BINANCE:DOTUSDT
time frame daily
technical analysis based supply and demand theory


Polkadot: Is it time to buy?DOT is trading almost 87% lower than its previous ATH and is now about to hit its bottom support again, IMO. The $4.75 level is my buy zone for DOT, with a target of $14 for the midterm and an optimistic target of $128 for the long term in case of a super bullish market.

Long signal for DOT/USDTThis technical analysis is based on the daily chart of DOT/USDT on the Binance exchange. This analysis draws two price channels and evaluates support and resistance levels.
Price Channel Analysis:
The previous bearish channel is broken out, and a bullish channel is formed.
The suggested entry point is around 7.046 USDT.
Entry and Exit Points:
Entry: 7.046 USDT
Take Profit: 8.807 USDT (25.01%)
Stop Loss: 6.607 USDT (6.22%)
R/R Ratio: 4.02
Conclusion:
This analysis suggests that by adhering to the specified take profit and stop loss levels, a successful trade can be achieved. The Reward/Risk Ratio for this trade is approximately 4.02, indicating a highly favorable risk-to-reward scenario. To manage risk effectively, it is recommended to strictly follow the stop loss level.


DOT's last bottom before the new ATHCRYPTOCAP:DOT will be ready to target a new ATH from the $4.90 : $4.25 range in my opinion.

$DOT #Polkadot Trading IdeaDOT/USD (Polkadot) formed a potential ascending triangle pattern on the daily timeframe. Full send after a breakout to my Golden Zon After a clean breakout, my potential target is $8.828-$9.562.

Long idea on DOTok, I need to describe the damn thing, I came in, I just believe in the high season now (I will duplicate the description in coins that I will take)

POLKADOT - UPDATE -$20 INCOMING AFTER THIS POSSIBLE LAST RETRACE
This is an update on $dotusdt. It now seems clear to me that we have completed the primary degree wave 1-yellow and we are in some kind FLAT for wave 2-yellow which we will be ending coming days or weeks at around the 50-70% Fibonacci zone.
The next point of interest or right place to DCA is anywhere withing the box. Remember I warned you about all these huge pullbacks happening and I told you to position yourselves by buying in parts and not diving in all at once.
Also do not forget that we might not see the last leg (wave 5-green) and the whole FLAT might become a combo making it a RUNNING FLAT thereby moving price to the next target at $15 and above. That is why we don't wait for perfect entry instead we DCA in.
OTHER ANALYSIS

DOTUSDT - who is bullish on crypto?Disclaimer: I don't have a fundamental basis to actually believe in this scenario, but what I see on the chart I see on the chart.
With that out of the way, the shown scenario of an impulse followed by a rather big flat correction, which might be done now, would be extremely bullish, since it would suggest new all time highs (that would be a 13x from here at minimum).
Never only consider one way though, even without changing too much of the count, a not so nice mid/long-term alternative would be this:

DOTUSDT: Bullish TrendDOTUSDT is moving in uptrend and currently moving on trend line and also formed bullish divergence with symmetrical triangle pattern, if DOT break this pattern so this is the confirmation of the bullish trend so wait for the breakout of the pattern and take a long ride with proper risk management, SL and TP.

$$$ DOTUSDT, Opportunity to take bullve tradeWelcome, Trader. Welcome to our cryptocurrency community!
We are going to discussing #DOTUSDT 💹
#DOTUSDT 🔥🚀
---------------
Update:
#DOT formed a bullish peanut pattern on the 2 Hr time frame 👉✅.
Breakout confirmation is already done✔😉
We are expecting a minimum of 12% 💰 very soon
Crypto Analyst Hub
#crypto #cryptocurrency #bitcoin #ethereum #blockchain #btc #cryptotrading #cryptonews #eth #cryptocurrencies #nft #bitcoinnews #bitcoins #trading #bitcoinmining #forex #binance #cryptoart #nfts#trading #forex #trader #investing #stocks #forextrader #stockmarket #daytrader #forextrading #invest #bitcoin #daytrading #cryptocurrency #crypto #investor #investment #forexsignals #nse #chartpattern #cedarforex #candlepatterns #learntrading #bseinstitute #shorttermtrade #bankniftytrading #stockmarketph #calloptions #mqlsignal #futuretrader #tradingmemes #chartpatterns #tradingview #tradinglife #tradinglifestyle #tradingstrategy #tradingtips #tradingplan #tradingsignals #tradingaccounts #tradingsignal #tradingforex #tradingsync #tradingroom #litecoin #ethereum #bitcoincash #cryptocurrencies #ripple #btc #bitcoinnews #bitcoinmining #blockchain #eth #bitcoin #bitcoins #coinbase #cryptocurrency #crypto #bitcointrading #dogecoin
BTC
ETH
USDT
PEPE
DOGE
ALT

DOT/USDT No technical analysis neededBuying CRYPTOCAP:DOT below $15 is a long-term fortune. It's still cheap, I'm accumulating in this zone.
DYOR. Not Financial Advise

Polkadot (DOT) to $50On the above 4-day chart price action has corrected over 90% since the sell signal back in March 2021. Now is an excellent long opportunity. The reasons?
1) Price action and RSI resistance breakouts.
2) Regular bullish divergence as printed over a 4 month period.
3) Support and resistance. Look left.
4) The target is defined from the falling wedge.
Is it possible price action falls further? Sure.
Is it probable? no
Ww
Type: trade
Risk: <=6% of portfolio
Timeframe: Long from August.
Return: 1000%

DOTUSDT.PHello Trader BINANCE:DOTUSDT.P
CRYPTOCAP:DOT
There is a slight breakdown in the 30 minute area up to the 4 hour area. This price weakening is also an indication of a rising wedge pattern, positive reject small resistance range area 7,190
entry area : 7,190 - market price
take profit 10%
stop loss 2.5%
Please add a comment and Positive feedback and constructive criticism are important to authors and the community.
Disclamer: Not Financial Advice

DOTUSDT is BullishBullish RSI divergence appeared on 1H time frame, after that a higher low was printed and now previous lower high is breaking, this is a sign that bulls are taking control of the price action, and a bullish rally is on the cards as per Dow theory. Targets are mentioned on the chart.

$DOTUSDTBINANCE:DOTUSDT
LONG
LEVERAGE
TARGET 1 - 7.500
TARGET 2 - 8.500
TARGET 3 - 9.800
DOT formed a potential ascending triangle pattern on the daily timeframe. Full send after a breakout

$DOT Season Is HereHeavy Resistance at $20. If Others.d takes dominance from ETH. I look for Resistance to blow through for a 786 test around $30, MACD Primed Rsi Primed from consolidation. It is CRYPTOCAP:DOT season.

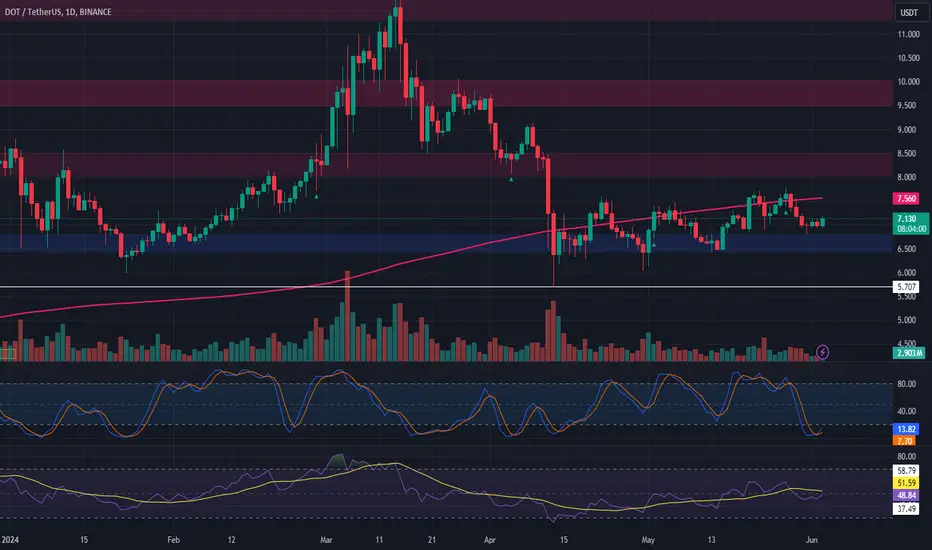
Polkadot (DOT) Daily Chart AnalysisCurrent Situation:
A detailed examination of Polkadot’s (DOT) daily chart reveals a bearish sentiment. The price faced rejection after a period of sideways movement around the critical $7.5 resistance level and the significant 200-day moving average.
Bearish Indicators:
Resistance Rejection: The price was rejected at the $7.5 resistance level, reinforced by the 200-day moving average.
Seller Dominance: Sellers are currently dominating the market, suggesting a bearish retracement towards the $6.5 threshold is increasingly likely.
Key Support and Resistance Levels:
Resistance Level: $7.5
Support Level: $6.5
Market Context:
Despite the bearish sentiment, Polkadot remains confined within a decisive range marked by the $7.5 resistance and $6.5 support. A breakout from this range will likely establish the direction for a sustained trend.
Trade Strategy:
For Bears: Watch for a break below the $6.5 support level for potential short opportunities, targeting lower levels.
For Bulls: A break above the $7.5 resistance could signal bullish momentum, providing opportunities for long trades.
Stay vigilant for a decisive breakout from this range to gauge the next sustained trend direction for Polkadot.
#Crypto #Polkadot #DOT #MarketAnalysis #SupportAndResistance #BearishTrend #200DMA #TradingStrategy #Cryptocurrency #Blockchain
DOT/USDTPolkadot is a sleeping Dragon. After it breaks the resistance from 11.9$ it can quickly go to 23 - 40$. And in the long term, a TOP on Dot somewhere in the 140$ area.
