US30Y headed up back to 5%?US30Y headed ⬆️ to 5%? If it breaks above 4.83%, then most likely it'll explore the further premium areas of the range.
US30Y is currently doing a very methodical climb up, as compared to a very rapid fall post Nov 23. This should be fun to watch! 🤩
US30Y trade ideas

US Bond Yield SMT DivergenceThis chart shows the bullish SMT Divergence happening across the US Treasury Bond yields.
According to the ICT methodologies this could indicate a potential continuation for the DXY Index higher.

US30Y: A Deep Dive into US30Y Bond Swing-Trade OpportunityThe US30Y bond is a type of loan that the United States government takes from investors. It's called a "30-year bond" because it takes 30 years for the government to pay back the loan in full. When you buy a US30Y bond, you're essentially lending money to the government, and in return, they promise to pay you back the amount you lent, plus interest, over the 30-year period.
People trade US30Y bonds because they can buy and sell them before they mature. This means you can potentially make money by selling the bond for more than you paid for it if its value goes up, or you might sell it for less if its value goes down. The value of the bond can change based on factors like interest rates, inflation, and economic conditions.
Most investors often see US30Y bonds as a safer investment compared to stocks because they're backed by the government.
However, they still carry risks, such as changes in interest rates or inflation levels. So, people who trade US30Y bonds need to carefully consider these factors before making investment decisions.
Now let's get into the detailed analysis of this bond
12M:
6M:
3M:
1M:
1D:

Short term yields still weak, longer term reversedWhat a difference 11 hours makes.
The 1 & 2 Yr #Yield are STILL under resistance & are weakening.
10 & 30 Yr completely reversed once markets opened. But this tends to be normal, pretty frequent.
This is why waiting for a CLOSE is of utmost importance. IF we CLOSE here, last night's thinking is NO MORE and the best plan of action is to WAIT.
TVC:TNX

Interest Rates NOT showing cuts...Let's keep looking at #InterestRates. Gives us an idea of what the Fed may do.
The 1 & 2 Year are still under their RESISTANCE level. Struggling a bit, but not breaking down. Trend is still there, weak though.
10 Yr looks like it wants to break the resistance zone.
30 YR looks like it's gone. Does not look like it wants to retrace at the moment.
#FederalReserve TVC:TNX

US30Y yield back to New high (Bearish bond view)On the back of strong prices data which were not really consistent with the temporary relief in inflation but rather calling for a sustained trend.
US30Y is likely to revisit new high, breaking our

US30Don't repeat patterns. Repeat logic. And when you're wrong, dissect the logic. Then you'll realise it's the same logic being used again and again.

CRE & Small Banks coincide with each otherSmall banks account for about 70% of #commercialrealestate.
Small #banks are considered those with assets less than $10B.
We've been bearish CRE for a long time. We believe that this sector will likely not get better anytime soon.
#interestrates are still holding fairly strong. They are at banking crisis levels or higher.
TVC:TNX

Treasury Yields look ripe for further movesCurrent state of the short and long term #Yield.
The 1Yr is underperforming against the 2Yr yield. However, it looks like it wants to push higher.
10Yr vs 30Yr
The 10Yr is performing lil better than 30 but.......
The 30Yr has a BULLISH short term crossing over longer term moving avg, RSI also looks strong. IMO yields are looking good. Seems like there is still treasury selling pressure.

Looking at short & long term yieldsGood Morning Update
Looking at the short & long term Bond Yields.
Short term (3M & 6M) yields are trading above bank crisis levels.
The 1Yr & 2Yr #yield are underneath the crisis levels.
The 10Yr is currently at those levels & 30Yr is above said levels.
Makes one think....... How much longer can #banks support these levels?
CRYPTOCAP:BTC AMEX:GLD AMEX:SLV
------------------------------------
Digesting longer term data = 10 & 30Yr #yield.
Higher lows
Bullish moving average crossover > circles
Moving avgs trending higher
Forming small uptrend
2nd pic = WEEKLY
Back above previous uptrend
Trading under moving avgs
TVC:TNX #Gold #silver #BTC

$DXY, long and short term rates looking betterGood Morning! Let's get it done!
Look at #yield for 1yr - 30Yr. What do you see?
Last week we said they looked 2b bottoming out a bit.
Do any of these look weak to you?
RSI above halfway point, solidifying the possible bottoming process.
Short term
#Interestrates keep testing the top part of the white line. The more something is tested the weaker it becomes and the higher the chance of it breaking through.
Long term
Forming higher lows.
TVC:DXY

US30Y
Currently US30Y is in the selling zone, but if the red average indicated by the blue arrow is broken and we enter the green zone, the market will be in the buying phase.

10 & 30 Year yields are at decent to strong support levelsThe 10 year & 30 Yr #yield are at support levels.
Looking at Daily charts:
The longer term, 30Yr, looks better than TVC:TNX (10Yr)
Looking at Weekly charts:
The 10Yr support level looks strongest @ 3.3%.
All sorts of support levels and trendlines were broken recently.
The 30 Yr trendline is certainly broken & Strong Support is found here.

Requested Update: Bond Yields Complete a 5-wave pattern higherWe have our first indication of a top in bond yields with price overlapping and losing it's impulsivity to the upside. However, a top is not confirmed until yields breach 3.40% which is our wave 4 of one lesser degree.
To do so should confirm the beginning of our wave 2 decline into the target box, and over time.

Anlysis of the 30Y treasury BondHere is my analysis of the 30Y treasury Bond. In fact , for the past weeks , this market has been trading lower. And my point is that it will continue trading lower until we reach the sellside liqudity level. That means that we could continue to witness bullish prices on indices due the invese correlation between the Bond market and the indices market

Interest rates over layThis is 30 year yields with 10 20 and the fed funds rate over laid on top for my purposes:)

Bull Market in Housing to continue till 2027It would surprise many.
So far House prices have been holding up with rates going parabolic
Strong economies can usually handle a few years of stable rates in around 5%
Supercycle's generally last 16-18 years
As we saw in the great Bull run of 1982 to 2000
A repeat of this cycle timeframe: would mean
#Bitcoin top 2025 (2009 inception)
#Stocks 2026 (march 2009)
#property 2027 due to lag and time to make a sale. (End of 2011)

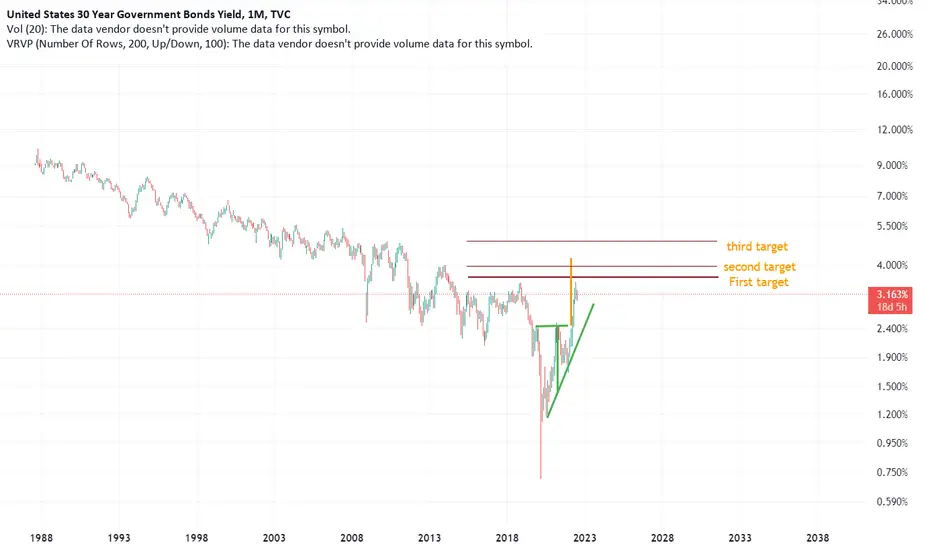
US30Y targets in this analysis , i gave targets for US30Y , based on the macro env , and the W pattern in addition to ichimoku strong resistancec.
not a financial advice
thank you
US 30yr yieldsUpdate on US long end rates view. YCC or not this is what I think could happen over next 2 years. When I was on the fixed income trading desk at Lehman in '88 we had short end paper that yielded double digits....and given the amount of fiat being printed this could be just the start of the back up in yields

Still a secular bull market for yieldsHate to disappoint you fixed income bulls
We are in the early stages of a secular bull market for yields (started 2020) as inflation will prove persistently bad
There may be pullbacks along the way but the path is higher
Long bond yield>10>50>200 ma

30 & 10yr yield short term analysisThe 30 yr #yield Is having a hard time in this area.
We're seeing a severe negative divergence, RSI is losing steam
The 10Yr yield went higher today but it's pulling back a bit, at the moment at least.
It's also shows RSI losing steam.
#Stocks are not doing so bad all things considered.
Will higher rates be the norm again?
TVC:TNX

Long Term Yields catching a bidGood Afternoon!
Long Term #interestrates are PUMPING today!!!
The 10 & 30 Yr have been struggling in this area.
They are currently forming a negative divergence. We'll see how that goes.
3Month - 1Yr haven't moved much.
2Year #yield is also moving. This is "good"! That means that the normalization of yield curve is not happening yet.
#stocks #gold #silver

Harnessing Gains from Yield Curve NormalisationNot too long ago, watching interest rates was as boring as looking at wet paint dry. Not anymore. Interest rates and currencies are as interesting as they get. The US dollar has been clocking moves more akin to an EM currency.
The greenback has been on a rollercoaster ride over the past three months in line with market expectations of Fed’s interest rate policy path. This paper is set in three parts. First, the background to rising rates and spiking yields leads to a brutal bond sell off. Then, the paper evaluates the case for further Fed rate hikes. In the third and final part, it dwells into factors that support a rate pause.
It is not just the rates but also the term structure of rates that’s gone off-the-chart. This paper posits a hypothetical spread trade inspired by the divergence in 30Y and 10Y treasuries with an entry at 13 bps and a target at 40 bps hedged by a stop at 5 bps delivering a reward-to-risk of 1.5x.
RISING RATES AND SPIKING YIELDS
Fed’s commitment to taming inflation with a higher-for-longer stance leads to a surging dollar. Spiking bond yields help reign in inflation through tightening monetary conditions.
The US 10Y Treasury Bond Yields surged to their highest level since 2007, by 20% or 0.8 percentage points since July 17th.
Chart 1: US 10Y and US 2Y Treasury Yields
Yield and Bond prices are inversely related. Surging yields have hammered bond prices lower resulting in a staggering record sell-off. Leveraged funds hold a record net short positioning in US 2-year and 10-year Treasury Futures.
Chart 2: Record Net Short Positioning by Leverage Funds
This brutal selloff has pushed yields to their highest levels in more than 15 years. Among others, portfolio managers and traders can position themselves one of the two ways:
Risk Hedged Yield Harvesting: Harvest risk hedged treasury yield using cash treasury positions and Treasury futures to generate income over a long horizon, or,
Gain from Yield Curve Normalisation: Deploy CME Micro Treasury Futures to engineer a spread trade to realise gains from a normalising yield curve.
In a previous paper , Mint Finance illustrated the first. Distinctly, this paper covers spread trade using CME Micro Treasury Futures.
THE CASE FOR HIKING
The September FOMC meeting re-affirmed a higher-for-longer rate regime. Though there was no rate hike, the updated Fed’s dot plot signalled very different expectations for the rates ahead.
The dot plot was updated to show a final rate hike in 2023 and fewer rate cuts in 2024.
Chart 3: Contrasting US Fed’s Dot Plot between 14/June versus 20/September ( Federal Reserve )
The Fed has adequate grounds to crank up rates even more as highlighted in a previous paper . These include (a) American exceptionalism where the US Economy has been remarkably resilient, (b) Expensive Oil due to geopolitics & receding base level effects, and (c) Brutal Lessons from past on the folly of premature easing.
THE CASE FOR PAUSE
Factors described above have led markets to price another rate hike at Fed meetings later this year. Those views have started to tilt further towards a pause since the start of October as per CME FedWatch tool.
Chart 4: Target Rate Probabilities For 13/Dec Fed Meeting ( CME FedWatch Tool )
Bond yields have surged, helping the Fed with their fight against inflation. Yields on US Treasuries surged to their highest since 2007. As yields are inversely proportional to bond prices, this is the equivalent of a major selloff in the bond market.
Three reasons behind the selloff:
1. Steepening Yield Curve:
Yields are finally catching up to market rates, especially for long-term treasuries; yield curve is steepening
Chart 5: Yield Curve is Steepening
2. Rising Sovereign Risk Premia: The US national debt passed USD 33 trillion and is set to reach USD 52 trillion within the next 10 years. Investors are demanding higher risk premia as compensation for default risk by a heavy borrower.
Chart 6: US Debt to GDP Ratio
3. Higher Yield to Compensate for Scorching Inflation: Investors are demanding higher real rates amid a high-inflation environment.
Chart 7: Real Yields are marginally above zero
Bond yields seem to be peaking. Solita Marcelli of UBS Global Wealth Management opines that the recent upward momentum in yields has been spurred largely by technical factors and is likely to be reversed given the overhang of uncertainty over underlying forces guiding the Treasury market.
Higher bond yields support a case for a Fed pause. This is because rising treasury yields do part of the Fed’s job. Higher treasury yields tighten financial conditions in addition to being a drag on the economy.
The Fed officials shared similar sentiments over the past week:
San Francisco Fed President Daly noted the moves in markets “could be equivalent to another rate hike”.
The Atlanta Fed chief opined that he doesn’t see the need for any more rate hikes.
The Dallas Fed President remarked that such a surge in bond markets may mean less need for additional rate increases.
The Fed has made it amply clear many times that it is data dependent. The data about the economy is positive. And that is concerning. Jobs data last week, and a sticky CPI print raise concerns that the Fed’s hand might be forced to hike despite US inflation being low among G7.
Chart 8: US Inflation is among the lowest within G7s
HYPOTHETICAL TRADE SETUP
Are we witnessing peak rates? In anticipation of the peak, investors can use CME Micro Treasury Futures to harness gains in a margin efficient manner. Micro Treasury Futures are intuitive as they are quoted in yields and are fully cash settled. They are settled daily to BrokerTec US Treasury benchmarks for price integrity and consistency.
As highlighted in a previous paper , each basis point change in yield represents a USD 10 change in notional value across all tenors, making spread trading seamless.
Setting up a position on yield inversion between 2Y and 10Y Treasuries is exposed to significant downside risks from near-term rate uncertainty.
Instead, a prudent alternative is for investors to establish a spread with a short position in 10Y rates and a long position in 30Y rates. The 30Y treasury rates demand a higher term premium due to their longer maturity.
Presently, this premium is just 0.15%. In the past, this premium has reached as high as 1% during periods of monetary policy shifts with yield curve steepening.
Chart 9: US Treasury Inverted Spreads
Furthermore, downside on this spread is limited as the 30Y-10Y premium scarcely falls below 0% unlike the 10Y-2Y premium which has been in deep inversion for the past year. A long position in 30Y Treasury and a short position in 10Y Treasury with:
Entry: 0.130 (13 basis points)
Target: 0.4 (40 basis points)
Stop Loss: -0.05 (5 basis points)
Profit at Target: USD 270 (27 basis points x USD 10)
Loss at Stop: USD 180 (18 basis points x USD 10)
Reward to Risk: 1.5x
Chart 10: Hypothetical Spread (Long 30Y & Short 10Y) Trade Set Up
MARKET DATA
CME Real-time Market Data helps identify trading set-ups and express market views better. If you have futures in your trading portfolio, you can check out on CME Group data plans available that suit your trading needs www.tradingview.com
DISCLAIMER
This case study is for educational purposes only and does not constitute investment recommendations or advice. Nor are they used to promote any specific products, or services.
Trading or investment ideas cited here are for illustration only, as an integral part of a case study to demonstrate the fundamental concepts in risk management or trading under the market scenarios being discussed. Please read the FULL DISCLAIMER the link to which is provided in our profile description.
