$SPY bounced of resistance againLooks like AMEX:SPY will go down after bouncing off the 20 DMA. Bears rejoice!
ETF market


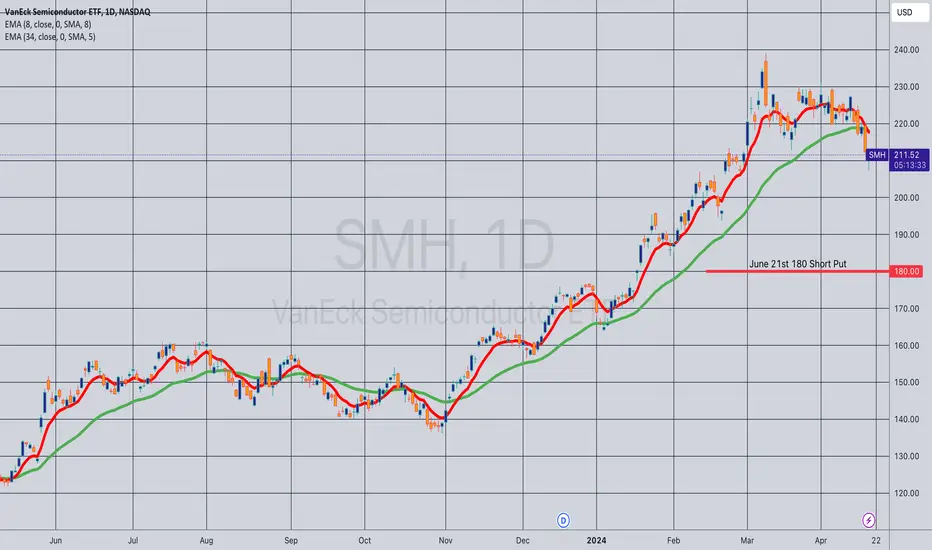
Opening (IRA): SMH June 21st 180 Short Put... for a 2.01 credit.
Comments: High IVR/IV at 75.1/35.1. Targeting the <16 delta strike paying around 1% of the strike price in credit to emulate dollar cost averaging into the semiconductor ETF.
I may look to ladder out at intervals if premium remains decent.
SOXL: Tactical approach to scale in and outStudying recent price action in SOXL (3X ETF on SMH - semiconductor segment). Example of an uptrend that ended (as defined by 34EMA wave), and then a retracement from 200MA back up to the 34. In this scenario, be cautious about buying into the bounce as it can often drop back down after reaching the 34 again from the bottom. Past support becomes current resistance.
Capture gains tactically but exiting a portion of the position once reaching that potential resistance, and again if the breakdown does occur. Determination of what is considered a breakdown, and how much to reduce is suggested as 2 candles showing downtrend, and 50% reduction.

Insights into Market Analysis: SPDR XLK Sector trend analysisThe upward trend of XLK experienced a halt in mid-April, marked by a price breakout below the swing low at $197.3. By retracing the price action from January 2022 to October 13, 2022, a potential pattern emerges, suggesting the formation of a 'Head & Shoulders' reversal pattern.
XLK had been on an upward trajectory from October 2022 until April 2024, largely driven by the robust performance of the tech sector. However, with the application of sector rotation principles, it appears that XLK is exhibiting signs of technical weakness. Currently, other sectors such as XLE and XLU are demonstrating stronger performance compared to the overall market.

heading to 420 looking to short 180 days out to 90 days out i think we will see but see a another touch up to area OF B before going to 420

Software tech sector possible pathI think we are going to have a false break out next week and then a hard pull back to uptrend line. This market loves to set up bears and bulls traps. Be careful.

QQQ Scalping Zones 4/26Scalping zones worked pretty will this morning.
Upside Targets:
*
Downside Targets:
*
Daily Trend Tracker
*DXY - Bullish - *VIX - Bearish - *US10Y - Bullish

Market Direction using SPY historical trend patternsFrom a technical perspective, there hasn't been a definitive signal indicating a trend reversal for the SPY 500. Back in May to October 2023, the SPY exhibited a clear "M" pattern or double top, experiencing a drop of approximately 5%, retracing back, and then dropping around 10%, forming the M pattern.
If we compare this M pattern with the current price action, we observe a striking resemblance in the market behavior, as the price retraces from a similar percentage drop of around 5%. The question arises: Is the market genuinely recovering, or are we merely witnessing the formation of another M-shaped pattern!


Largest Purchases of VIXM Ever since conceptionThe white box I inserted is where a 41 million dollar purchase was made at the price of $16.20 BUT, a second large purchase was made of 8.3 million dollars at the price of $16.00.
After these purchases, the price was able to stay above the purchase price and this is a bullish sign on medium term volatility.
Circled in the volume candles is the exact trades that I mentioned and I will be watching very closely on how this move prior to and at FOMC.
Its pretty obvious the NVIDIA event will be bullish for the markets until FOMC.
Little pop..... and a DROP.

GLD - SHORT POOTSGold prices have been on the decline recently, influenced by several key factors:
1. **Correction from Highs**: Gold had reached a record high last week, trading at $2,413.80 per ounce. Such spikes are often followed by corrections, as seen with the current downward movement.
2. *Rising Dollar and Treasury Yields**: The U.S. dollar and Treasury yields have both increased, which typically makes gold less attractive. As the dollar strengthens, gold, which is priced in dollars, becomes more expensive for investors using other currencies, reducing demand. Higher Treasury yields also make gold less appealing since it does not offer interest or dividends, unlike bonds.
3. **Economic Data Influencing Fed Policy Expectations**: Recent U.S. economic data indicated a 1.6% growth in GDP for the first quarter, which was below expectations. This situation affects market predictions regarding the Federal Reserve's interest rate decisions. Initially, weaker GDP growth might suggest potential rate cuts, which would typically support gold prices as a safe haven and hedge against currency devaluation. However, the current market sentiment suggests that investors are possibly adjusting their expectations about the extent and timing of such cuts.
4. **Geopolitical Tensions**: The easing of tensions between Israel and Iran has also played a role. With fewer concerns about a potential wider conflict in the Middle East, the demand for gold as a safe haven asset has diminished.
5. **Technical Support Levels**: Despite the recent drops, gold prices are still holding above the $2300 mark. Analysts from Saxo Bank noted that there is key support around the $2250-$2260 area, indicating that prices might stabilize if they reach these levels.
Can see easily a demand area at 202 area, longer term.
Puts bought on todays micro double top. good luck!

LONG SDS target 30In my opinion with no cut rates for 2024, stock markets should drop 10-15% from current levels. So the best play will be long SDS.
Regards,

Opening (IRA): SMH July 19th 165 Short Put... for a 1.69 credit.
Comments: High IVR/IV at 78.9/34.5. Adding a rung out in July to my SMH position, targeting the <16 delta strike paying around 1% of the strike price in credit to emulate dollar cost averaging into the semiconductor ETF.
Generally, will look to take profit on the short put at 50% max.

SPY THIS WEEKWe should stay in 502-508 range today, consolidate.
First move in the morning could be down.
508 is a strong resistance.
I am wondering if we do another leg down or do V.
Usually ACB should have another leg, but the move yesterday was strong, so I am 50/50
sitting on the fence.

$SPY should be a big dumpBollinger Bands and Stochastic are suggesting that downward movement in AMEX:SPY

Where will QQQ go from here?Slight correction is expected but long term trend line remains with target price of USD520 by 2025

$SPY April 26, 2024AMEX:SPY April 26, 2024
15 Minutes.
The expected long was nullified by gap down.
But AMEX:SPY managed to close near 502 levels.
Now we have all moving averages consolidated together.
I have Elliott oscillator green, CCI green and stochastics above 75 with no black bar on top.
Now for the rise from 493.86 to 507.37 AMEX:SPY retraced more than 61.8%.
Also, we have multiple resistance around 506 levels in chart as it can be seen.
For the fall from 515.30 to 493.86 we have 61.8% retracement around 507 levels.
I expect AMEX:SPY to be in the range 507 to 510 on upside today, provided it holds 502 levels.
If that happens then we can assume AMEX:SPY managed to hold 100 days in daily and 21 in weekly, there by setting up a buy above 515 levels for next week.
I will go long only above 514 - 515 levels.
For the day as moving averages have converged, if AMEX:SPY opened gap up I will wait for first 15 minutes, and if close of bar is near low I will short for 503-504 as targets provided the gap open is around 507 to 510 levels with SL high of bar or 511.
The reason is for the fall 524 to 493, 512 is approximately 61.8% of retracement for the fall.
Hence I have a buy only above 514 levels.

QQQ rangbound bearish bias SHORTQQQ on the daily chart hit a hpivot high on 3/21 followed by a slight downtrend of 1-1.5 %
overall this past week. Buying volumes are low. The Price Momentum Oscillator has
reversed to bearish and the Raltive Trend Index has entered the chop zone and is heading
bearish. Price is presently one standard deviation above the intermediate-term anchored
VWAP. Reversion to the mean suggests another 1% move downside before VWAP support
exerts itself. Price is compressing in a symmetrical triangle. Accordingly, I am expecting
a move down before a potential reversal in a VWAP bounce from that support.

Utilities setting up?The daily chart on XLU provides rationale to keep a place on our watchlist. Recently it made a golden cross and seems to have broken free of a downdraft in price. Now it looks like the RSI could be searching for overbought.
One option is a momentum trade targeting the $71+ price. Personally I'd like to see it hit overbought, then that a position of it pulls back down around the 50 & 200 day MSAs. Looks like with some patience there could be 15% out there depending on how things develop.

Dead cat bounce....?I see the bulls in the market attempting to cause us bears to panic. I believe this will be a short term "rally" that will only be the continuation of the downside trend.

QQQ Dancing on a High Wire $422.93: Golden Genesis fib and top?=QQQ is dancing on a high wire, a Golden Genesis fib at $422.93
Failure here could indicate top is in, so this is a key level here.
Just below is a fib confluence at $418, last stop before SERIOUS dip.
It is PROBABLE that we orbit this fib for a while.
It is POSSIBLE to bounce here and keep going up.
It is PLAUSIBLE a bull trap / distribution is done.
Here is a snapshot of the Genesis Sequence for the Q's:
=================================================================================================

$SPY 4hr double bottom could push it to trend/monthly resistancePossible double bottom here. Watching for a continued push to the trend line and major monthly resistance.
