Real Estate Crash $IYRReal estate has completed an abc correction to the first down leg of 2022 and will be followed by a C leg down for resolution through the end of 2024.
IYR trade ideas

REAL ESTATE MARKET CRASHwrote a long axe description but my screen refreshed wiping it away (dont feel like re writing)
long story OB market
mortgage rates will create inflationary pressure
-7% less homes sold yoy
86% of americans looking to buy homes had to put it on hold (low demand)
migration
buying homes still out of reach for millions regardless of decrease in mortgage rates
dont let the outliers fool you
lastly economy will crash dont buy the BS bullruns

A real estate market trading strategy for the end of the yearGood morning everyone. Today's analysis focuses on the Real Estate equity sector, which has shown a bearish trend for an extended period. We will try to explain the causes of the negative performances and why the sector could represent a good investment opportunity for the end of the year.
Happy reading to all!
1. TECHNICAL ANALYSIS ISHARES US REAL ESTATE ETF
We start the article by analyzing the iShares US Real Estate ETF, an American ETF that replicates an index of US real estate stocks (with the ticker IYR). As you can see in the chart below, the ETF has shown a downward trend since February 2, 2023. In particular, from that peak, the price has formed a bearish technical figure known as a "descending triangle". From the peak of July 27, 2023, the price has suffered a sharp fall, culminating in the low reached on October 30, after breaking the triangle's support. Between July 27 and October 30, the ETF recorded a negative performance of -18.90%. However, on October 30, we observed a brief rebound, with an increase of +8.49%.
Technical Analysis IYR. Daily Chart
In the following figure, the ETF's exposure breakdown and the top 10 holdings are illustrated.
Holdings and exposure breakdowns. Source: iShares
2. WHAT ARE REITs?
The companies that are part of the ETF are known as "REITs", an acronym for "Real Estate Investment Trust". There are three types of REITs:
• Equity REITs: These REITs buy and manage real estate properties
• Mortgage REITs: These REITs invest in mortgages and/or mortgage-backed securities
• Hybrid REITs: These REITs invest in both real estate properties and mortgages
Equity REITs generate their earnings mainly through lease rents, while Mortgage REITs profit from the interest derived from the mortgages they provide to real estate operators.
The companies that are part of the IYR ETF belong to the category of equity REITs. These can invest and manage different types of properties:
• Telecommunication Tower REITs: They manage structures that support antennas for telecommunications. An example is American Tower (AMT)
• Industrial REITs: They manage industrial properties such as warehouses and logistics centers. An example is Prologis (PLD)
• Retail REITs: They manage retail properties such as shopping centers and outlets. An example is Realty Income Corporation (O)
• Data Center REITs: They manage data centers that are generally rented to tech sector companies. An example is Equinix (EQIX)
• Self Storage REITs: They manage storage spaces. An example is Public Storage (PSA)
• Residential REITs: They manage apartments and residential properties. An example is Camden Property Trust (CPT)
• Healthcare REITs: They manage healthcare facilities, including hospitals. An example is Omega Healthcare (OHI)
• Office REITs: They manage office spaces. An example is Boston Properties (BXP)
• Real Estate Services: These REITs provide various services, including real estate consulting
3. THE IMPACT OF INTEREST RATES ON REITs
The following graph highlights an important aspect: the real estate sector ranks second to last in terms of performance since the beginning of the year. In particular, it has recorded a negative performance of -8.46%.
The performances of the 11 equity sectors of the S&P500 since the beginning of the year. Source: Finviz
The following graph reveals a significant fact: since January 2022, the real estate sector has continuously recorded a performance lower than its benchmark index, the S&P500.
The IYR ETF, since January 2022, has recorded a negative performance of -29.13%; better the S&P500, with a -6.6%. Daily Chart
The real estate sector has recorded disappointing performances due to the increase in interest rates. In general, the IYR ETF tends to suffer from an increase in expectations of a tightening of monetary policy, while it benefits in the opposite case. To illustrate this point, it is useful to create a bond sentiment index that reflects monetary policy expectations: LDQH/LQD. LQDH is an ETF that replicates the movement of US investment grade corporate bonds covered by the “interest rate” risk, while LQD represents the movement of the same bonds, but without coverage from that risk. The logic suggests that: • If there are expectations of a restrictive monetary policy, the bonds covered by the “rates” risk will perform better than those not covered. In the opposite case, the opposite will happen. This logic is confirmed by the following chart, which shows the correlation between LQDH/LQD and the Federal Reserve’s interest rates.
The positive correlation between LQDH/LQD and interest rates. Daily Chart
The following chart clearly illustrates how the REITs ETF, IYR, has performed negatively following the increase in expectations of restrictive monetary policy. In fact, every time LQDH/LQD has recorded an increase, the IYR ETF has shown a decrease.
The negative correlation between IYR and LQDH/LQD since 2022. Daily Chart
Moreover, the IYR ETF has continuously underperformed compared to its benchmark, the S&P500, every time monetary policy expectations have shown an upward trend.
LQDH/LQD and S&P500/IYR since 2022. Daily Chart
There are various factors that explain why REITs tend to suffer when interest rates rise. It is well known that a rise in interest rates tends to curb the investments and consumption of households and companies. This phenomenon has a negative impact on economic growth, as it causes a slowdown in industrial production and retail sales, both important data that impact GDP.
In a period of economic slowdown, companies reduce the demand for new properties for production and retail outlets due to contracting production and consumption. This translates into lower profits for industrial and retail REITs, which are among the most sensitive to changes in the economic cycle.
Even data center REITs, which are linked to tech companies, can feel the impact of rising interest rates. In fact, with higher rates, these companies may be less inclined to go into debt to expand, thus reducing the demand for data center spaces.
Office REITs could suffer from an increase in the unemployment rate related to the economic slowdown, and this could lead to a decrease in the demand for office spaces.
Residential REITs also suffer the negative impact of rising interest rates. In fact, in a context of higher rates, many tenants may find themselves in default, especially due to the increase in the unemployment rate, which leads to a reduction in household income.
In addition to the aspects already mentioned, there is another important element to consider: the REITs sector offers high dividends to shareholders, making the sector particularly attractive. However, an increase in interest rates also entails an increase in government bond yields. Consequently, many investors may choose to invest their capital in government bonds, which offer attractive coupons and are at the same time safer than stocks.
Another aspect to consider is that the dividend is a part of the company's profit. Therefore, if profits slow down, one can expect dividends to decrease as well; this provides a further incentive for investors to orient their investments towards government bonds.
Another aspect that can influence REITs when interest rates rise is related to their typical recourse to debt for the purchase of income-generating properties. If interest rates rise, the cost of debt (especially variable debt) becomes more burdensome, negatively affecting the balance sheets of companies. Moreover, with the increase in interest on debt, REITs may be less incentivized to expand, which means that an increase in interest rates can have a negative impact on the very growth of companies.
4. YEAR-END RALLY: WHY THE REAL ESTATE SECTOR COULD PROVE TO BE A GOOD CHOICE
If the much-anticipated year-end rally were to occur, the real estate sector could emerge as one of the best performers. The reason is simple: if the rally were to occur, it would probably be triggered by the statements of the Federal Reserve Chairman, Jerome Powell, during the last meeting on November 1, which were positively received by the markets.
As can be seen in the following chart, the LQDH/LQD strength index recorded a bearish breakout of its bullish trendline after the last meeting. During the same period, IYR recorded a performance close to +10%.
The bearish breakout of the LQDH/LQD index trendline, accompanied by a rise in IYR. Daily Chart
If, in the coming weeks, LQDH/LQD were to continue to fall, IYR should benefit from it, thanks to expectations of a less restrictive monetary policy. A possible strategy, as illustrated in the following chart, could consider LQDH/LQD as a benchmark indicator and IYR as an asset on which to apply the strategy:
1. Wait for a retracement of LQDH/LQD on the bullish trendline, which could become a dynamic resistance, and then wait for a new bearish movement.
2. Enter the market on IYR, waiting for a bounce on the bearish trendline, which could become a dynamic support.
All of this, of course, assumes that the correlation coefficient remains in negative territory.
Operational hypothesis; this is not to be understood as financial advice. Daily Chart.
We conclude the analysis by emphasizing that the catalyst that pushed the real estate sector into bearish territory could now become the engine of a possible rise. But will it really be so? It is important to consider one more element: the meeting on November 1 was not the last one of the FED. The last meeting of the year will be held on December 13 and, as shown in the following chart, the forecasts indicate a maintenance of rates between 525 and 550 basis points (with a probability of 90.2%).
Target rate probabilities for 12 dec
This last meeting could determine the fate of the stock market for the end of 2023, influencing the famous Christmas rally. For any questions, please feel free to comment. See you soon!

$IYR Double Bottom Pierce Weekly Chart The Double Bottom Pierce pattern on the AMEX:IYR weekly chart suggests potential bullish action in the real estate sector, making it a point of interest for traders and investors alike. As always, prudent risk management and due diligence are advised.

HOUSING MARKET BOTTOMED ??? :)I will continue to update on this as price approaches my vibrant resistances
but for now I definetley see that it has bottomed out
SENNA SEASON

IYR [Real Estate ] Down By -1.07%The real estate market represents the global economy
If this market is in a downturn it shows
that things are not okay
--
People around the world are suffering
and this is what causes war
--
If you want to learn more
rocket boost this post
--
Disclaimer:
Do your own research before you trade this is not financial advice

MACRO Real Estate: Does this look familiar?Should I short the US real estate market? AMEX:IYR AMEX:DRV
I've been watching AMEX:IYR for some time and I can't help but see similarities to the build-up in the housing market crash of 2008. It's mostly just technical analysis, but you can see 3 moves down to about -30% with a weak wedging formation/upsidedown cup & handle. The entire moves also took place around 85 bars or 600 days. So proportionally the moves are almost identical in time and distance traveled.
The chart just seems very weak to me. It took 280 days to travel down 35%, but only recovered 5% of that in the following 300 days --- this is still a downtrend.
Additionally if you incorporate the story: home prices had record gains in the years after the pandemic, commercial real estate fighting vacancies, Airbnb oversaturation, and all followed by the fastest interest rate increases in FED history....... you might have a good environment for a crash.
IDK these are just thoughts, but this is the week after Chinese Real estate company Evergrande declared bankruptcy and I just feel the chart telling a story. Who knows, maybe history repeats itself.
www.tradingview.com AMEX:IYR
/Users/seanryan/Desktop/Screen Shot 2023-08-21 at 12.54.34 PM.png

Monitoring Real Estate & The Syndications Doing some research, I came across some info on Real Estate Syndications and how they could be responsible for the upcoming crises in Commerical Real Estate and Apartment Complexes.
A Real Estate Syndication, pools money from High Income Individuals and upper middle class. That pool of money, is then used to purchase a piece of Real Estate. But its not just money taking from Investors, its often combined with money borrowed from Banks. However, these aren't traditional loans like fixed rates, va loan, fha.. They were purchased w/ Bridge Loans. With the idea of the loans being short term in nature mainly for home renovations. As many of these properties were Distress aka fixer uppers.
These Bridge Loans have a special feature called Floating Interest Rates. With Floating Interest Rates/Debt, the interest rate moves around whatever the current interest rate is. Which brings back to Powell and the constant rate hikes. The Feds have to see this chart, and know just 1-2 more significant hikes will not only crash the Housing Sector, but potentially the entire USA Economy.
Currently I see an Apex forming around July 2023. There's also a resistances level from March 2023 that hasnt been cleared. For now this just a watch/monitor. No position on shorting real estate here just yet.
look up some of these Syndications ran by guys like Jay Gajavelli, and Grant Cardone

vastgoed crisis 2.0 Interest rates going up = inability to sell real estate = inability to pay debts = banking crisis = collapse of the financial bubble!
Stijgende rentetarieven = onvermogen om vastgoed te verkopen = onvermogen om schulden te betalen = bankencrisis = ineenstorting van de financiële bubbel!
Het is belangrijk om te begrijpen dat de vastgoedmarkt net als elke andere markt cyclisch is en gevoelig kan zijn voor veranderingen in de economie en andere factoren. Als er een economische recessie optreedt, kan de vastgoedmarkt bijvoorbeeld dalen.
Met dat gezegd hebbende, het is moeilijk om precies te voorspellen hoeveel de vastgoedmarkt zal crashen. Een daling van 30% is een aanzienlijke daling en zou grote gevolgen hebben voor vastgoedeigenaren en investeerders.
Als de vastgoedmarkt daadwerkelijk met 30% daalt, kan het moeilijk zijn om leningen terug te betalen en hypotheken af te lossen. Vastgoedeigenaren en investeerders kunnen dan geconfronteerd worden met faillissementen, gedwongen verkopen en verlies van kapitaal.
Voor potentiële vastgoedinvesteerders kan het verstandig zijn om hun risico's te diversifiëren en hun portefeuilles te spreiden over verschillende soorten vastgoed en locaties. Het kan ook verstandig zijn om te investeren in vastgoedfondsen in plaats van direct in vastgoed, omdat fondsen vaak meer diversificatie bieden en minder gevoelig zijn voor individuele marktfluctuaties.
In elk geval is het belangrijk om goed onderzoek te doen en te begrijpen wat de mogelijke risico's en beloningen zijn bij het investeren in vastgoed, vooral als de markt onstabiel lijkt te worden. Het is altijd beter om voorzichtig te zijn en uw investeringen zorgvuldig te plannen om uw kapitaal te beschermen en uw kansen op succes te vergroten.
It is important to understand that the real estate market, like any other market, is cyclical and can be sensitive to changes in the economy and other factors. For example, during an economic recession, the real estate market may decline.
That being said, it is difficult to predict exactly how much the real estate market will crash. A 30% decline is a significant drop and would have major consequences for real estate owners and investors.
If the real estate market does indeed decline by 30%, it may be difficult to repay loans and mortgages. Real estate owners and investors may then face bankruptcies, forced sales, and loss of capital.
For potential real estate investors, it may be wise to diversify their risks and spread their portfolios across different types of real estate and locations. It may also be wise to invest in real estate funds instead of directly in real estate, as funds often offer more diversification and are less sensitive to individual market fluctuations.
In any case, it is important to do thorough research and understand what the possible risks and rewards are when investing in real estate, especially if the market seems to be becoming unstable. It is always better to be cautious and carefully plan your investments to protect your capital and increase your chances of success.

IYR, or the iShares U.S. Real Estate ETF (Bullish)IYR, or the iShares U.S. Real Estate ETF, is an investment fund that seeks to track the performance of the Dow Jones U.S. Real Estate Index. The fund is designed to provide exposure to the real estate sector in the United States by investing in companies that own and manage real estate, such as real estate investment trusts (REITs) and other real estate companies.
IYR was launched on June 12, 2000, and is managed by BlackRock Fund Advisors. It is traded on the NYSE Arca exchange under the ticker symbol IYR.
Investment Objective and Strategy:
The investment objective of IYR is to seek investment results that correspond generally to the price and yield performance, before fees and expenses, of the Dow Jones U.S. Real Estate Index. The index is comprised of companies that are primarily engaged in the ownership, development, and management of real estate located in the United States.
IYR seeks to achieve its investment objective by investing at least 90% of its assets in the securities included in the Dow Jones U.S. Real Estate Index. The fund may also invest in futures contracts, options on futures contracts, and other derivatives, as well as in cash and cash equivalents.
Index Composition and Rebalancing:
The Dow Jones U.S. Real Estate Index consists of companies that are classified as real estate companies according to the Global Industry Classification Standard (GICS). The index is weighted based on market capitalization, with larger companies representing a higher percentage of the index.
The index is reviewed annually in September, with any changes taking effect at the end of that month. The index is also rebalanced quarterly to ensure that it continues to accurately represent the real estate sector.
Fees and Expenses:
IYR charges an expense ratio of 0.41%, which is relatively low compared to other real estate ETFs. This means that investors will pay $4.10 in fees for every $1,000 invested in the fund.
Risks and Considerations:
As with any investment, there are risks associated with investing in IYR. These risks include market risk, interest rate risk, and liquidity risk. Additionally, because IYR is a passively managed fund, it may not perform as well as actively managed funds that have the ability to make investment decisions based on market conditions and other factors.
Investors should carefully consider these risks before investing in IYR, and should consult with a financial advisor if they have any questions or concerns.
Conclusion:
IYR is an investment fund that seeks to provide exposure to the real estate sector in the United States. It invests in companies that own and manage real estate, and seeks to track the performance of the Dow Jones U.S. Real Estate Index. Investors should carefully consider the risks and expenses associated with IYR before investing, and should consult with a financial advisor if they have any questions or concerns.

short IYRliving under 50MA, rejected
stop above vol POC, and above the downward trend line
risk/reward: 1:2

IYRNot very good just bored but I do expect upside, the fractals wont be accurate just to give you an idea. If we break new lows then we crashing

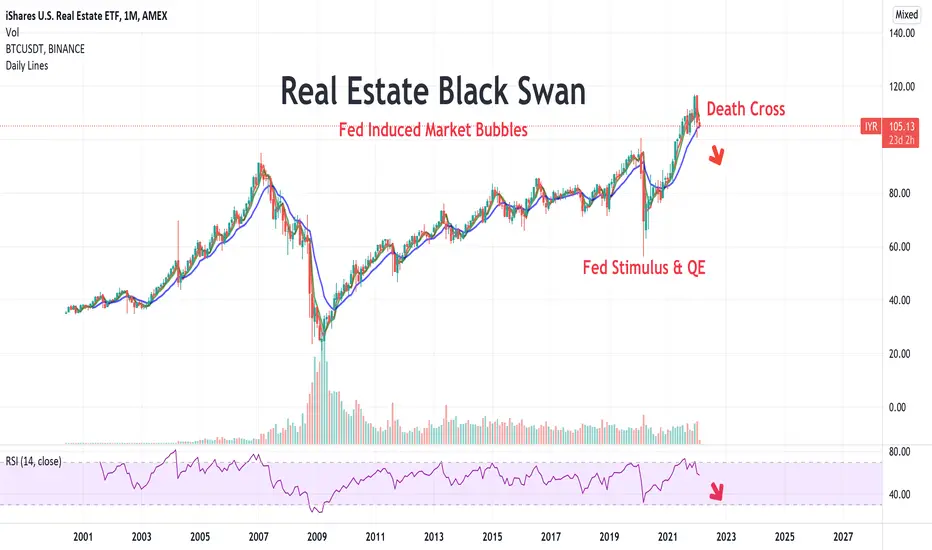
IYR Housing Market - Imminent Death Cross - A Black Swan EventFed induced market bubbles abundant. Buyer Beware. A financial crisis of biblical proportions is coming. Avoid the "easy money" investments that seemingly "always go up".
The masses will be left for dead. Volatility continues to surge.
Buy #UVXY
Lotto play --$IYR callExpires tomorrow.
Bought $107.5 call for $0.08. $IYR can move $0.5--$1 in a day.

IYR - HousingLooking rather Poor as large Put Buyers have enetered the Homies Turf.
This group of traders is ahead, they will close quickly once their Pirce Objective is met.
It would "appear" there is a large Institutional Group whois in Liquiadation Mode.
Sectors that have out-performed are being SOLD.
FInancials, Health Care, REITs and Utilities... Sellers present.

REITS - will outperformance continue?S&P500 ($SPY) has continued to print new all-time highs throughout this year, albeit lately on continually narrowing breadth. Potentially lost in the fray is the fact that real estate has actually been outperforming SPY throughout 2021 (as have commodities). This graph shows the relative strength of $IYR, an ETF representing the Real Estate sector via RE companies and Real Estate Investment Trusts (REITS) plotted against SPY. Notice the upward trajectory of the outperformance thus far in 2021, and be sure to stay alert for changes in economic or interest rate conditions that may impact this relationship.

Housing Market Crash - Coming Soon - No Volume - COGS ATHs#EpicEconomics #houseofcards #poof
Cost of Goods Sold... lumber, etc. inlflat(ed). *past tense
Rent not extended anymore. Pandemic tenants & landlords fallout.


AGNC When in doubt look at the respective sectors of your stocks to ascertain the general trend of the market. Trust your patterns!

Breakout out setup #stocksBreakout setup to the upside
Reward/Risk: 2/1
Entry: 87.81 or at a lower price
Stop: 84.00
Target: 94.00

REIT etf year in review: O $92.57 H $100.75 L $56.27 C <=> $84REIT etf year in review:
O $92.57
H $100.75
L $56.27
C <=> $84
Do your own due diligence, your risk is 100% your responsibility. You win some or you learn some. Consider being charitable with some of your profit to help humankind. Small incremental steps work : If you double a penny a day for a month it = $5,368,709. Good luck and happy trading friends...
*3x lucky 7s of trading*
7pt Trading compass:
Price action, entry/exit
Volume average/direction
Trend, patterns, momentum
Newsworthy current events
Revenue
Earnings
Balance sheet
7 Common mistakes:
+5% portfolio trades, risk management
Beware of analysts motives
Emotions & Opinions
FOMO : bad timing
Lack of planning & discipline
Forgetting restraint
Obdurate repetitive errors, no adaptation
7 Important tools:
Trading View app!, Brokerage UI
Accurate indicators & settings
Wide screen monitor/s
Trading log (pencil & graph paper)
Big organized desk
Reading books, playing chess
Sorted watch-list
Checkout my indicators:
Fibonacci VIP - volume
Fibonacci MA7 - price
pi RSI - trend momentum
TTC - trend channel
www.tradingview.com

Real estate has to go up because of HyperinflationBeside Gold, Real Estate has been a good hedging tool for a Hyperinflation period like 2009.

Real Estate crash coming?It has been a long time since our last ETFs discussion. Today I have something to share. IYR (US Real Estate) is getting ready for a new decline. COVID is a real disaster for an offline business. Thousands of restaurants and other retail businesses have already closed and this number will be increasing. It is a dangerous sign. With that in mind, we can experience the start of a new decline in the USA commercial real estate in the coming 2 – 3 months. Once the destruction of earning levels reflects into the economic cycles, banks will tighten lending opportunities. That means the number of capable buyers will decrease at a time when home inventories may begin to skyrocket. Does it remind you of something? – It is very similar to what happened before the 2008-09 credit crisis.
Pay attention to the Case-Shiller data. It is showing home price levels had already exceeded 2006-07 levels. So, what do we have? – Extremely high price levels, combined with the uncertainty of future earnings, unemployment, a big number of closed retail businesses, falling consumer confidence, layoffs, etc. What result can we expect? Real Estate ETFs can decline another 30 – 50%. So, if you deal with USA commercial real estate, it makes perfect sense to hedge your risks. And active traders have another pending opportunity to get substantial gains.
