Notice!
This is documentation for v5, which is no longer
actively maintained.
For up-to-date documentation, see the latest version.
Backgrounds
The
bgcolor()
function changes the color of the script’s background. If the script is
running in overlay = true mode, then it will color the chart’s
background.
The function’s signature is:
bgcolor(color, offset, editable, show_last, title, force_overlay) → voidIts color parameter allows a “series color” to be used for its
argument, so it can be dynamically calculated in an expression.
If the correct transparency is not part of the color to be used, it can be be generated using the color.new() function.
Here is a script that colors the background of trading sessions (try it on 30min EURUSD, for example):
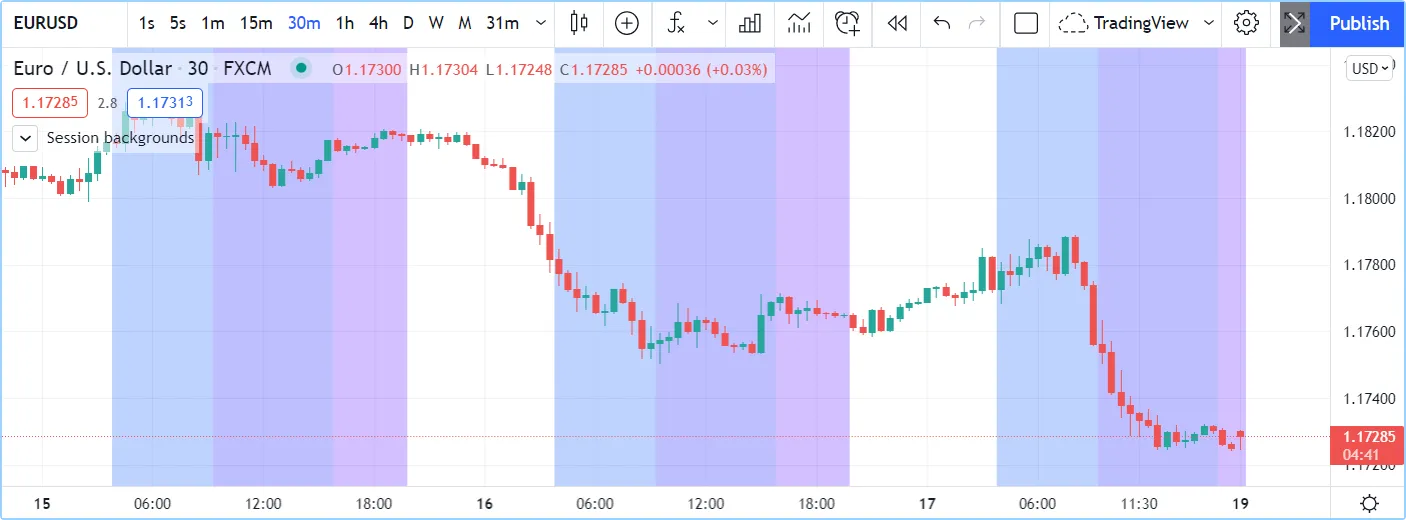
Note that:
- The script only works on chart timeframes of 30min or less. It prints an error message when the chart’s timeframe is higher than 30min.
- When the
if
structure’s
elsebranch is used because the chart’s timeframe is incorrect, the local block returns theNO_COLORcolor so that no background is displayed in that case. - We first initialize constants using our base colors, which include
the
40transparency in hex notation at the end. 40 in the hexadecimal notation on the reversed 00-FF scale for transparency corresponds to 75 in Pine Script®‘s 0-100 decimal scale for transparency. - We provide color inputs allowing script users to change the default colors we propose.
In our next example, we generate a gradient for the background of a CCI line:
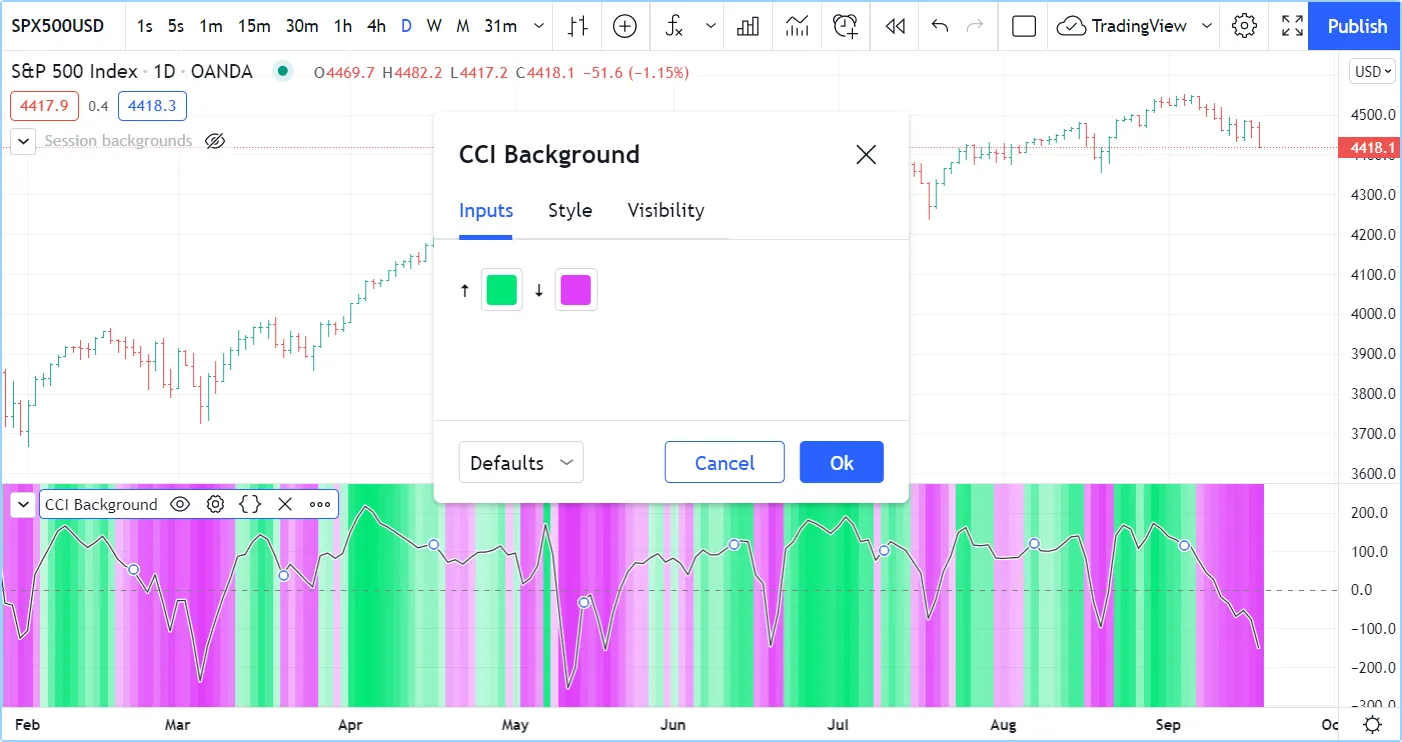
Note that:
- We use the ta.cci() built-in function to calculate the indicator value.
- We use the
ta.percentrank()
built-in function to calculate
myCCIPosition, i.e., the percentage of pastmyCCIvalues in the last 100 bars that are below the current value ofmyCCI. - To calculate the gradient, we use two different calls of the
color.from_gradient()
built-in: one for the bull gradient when
myCCIPositionis in the 50-100% range, which means that more past values are below its current value, and another for the bear gradient whenmyCCIPositionis in the 0-49.99% range, which means that more past values are above it. - We provide inputs so the user can change the bull/bear colors, and
we place both color input widgets on the same line using
inline = "1"in both input.color() calls. - We plot the CCI signal using two plot() calls to achieve the best contrast over the busy background: the first plot is a 3-pixel wide white background, the second plot() call plots the thin, 1-pixel wide black line.
See the Colors page for more examples of backgrounds.