watch datestrtucutire isnt right for this timeframe but oiverall strucutre will happen. just now extenedend as i made it on the chart..
june first sell
2-3 days buy and go long
june 6th-7th sell and add more postions on june 14-15th
ETF market


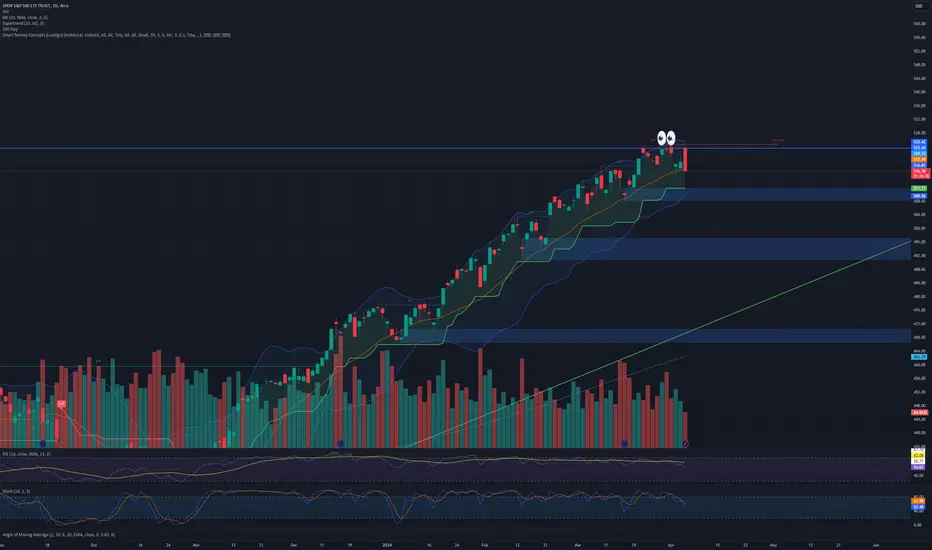
S&P Tug of War Continues as Market Seeks ClarityLast week marked some of the most unclear price action we've seen. Starting on Tuesday, sellers gradually took control from buyers, but most of the action occurred during extended hours (meaning on VERY low volume). On Friday, sellers finally acted during regular trading hours and attacked the market right from the open. However, it seems buyers were only waiting for this, as the price suddenly pivoted, and the day ended with a spectacular bull run.
At this moment, the market is sending very confusing signals, and the best strategy for a swing trader is to simply stay away for some time. Here's a formal summary of the current situation:
1. Long-term Bullish . The price is in an uptrend on both weekly and monthly timeframes. May closed above April’s high
2. Short-term Bearish . Weekly consolidation is in progress, and despite the bull show-off on Friday, the market is still consolidating on the weekly timeframe. Moreover, the week closed with a bearish "hanging man" candle.
3. Respect Friday’s Bull Run . It was unusually strong for bearish context and could easily develop into something significant.
To develop a convincing thesis, we need to see some clarity on the daily chart. Either bears will confirm a daily lower high, signaling the continuation of the weekly consolidation, or bulls will set a daily higher low, signaling the continuation of the uptrend. Until this happens, we can expect more unexpected moves in both directions without much follow-through.
Disclaimer
I don't give trading or investing advice, just sharing my thoughts.

$SPY Powerful OUTSIDE Bar Swing TradeFREE #OPTIONS Ideas
Scale out when above 25% Profit
AMEX:SPY 527C>526.59 | 519P<519.27
NASDAQ:INTC 31C>30.86 | 30P<30.04
NASDAQ:AAPL 195C>192.30 | 190P<190.18
NASDAQ:AMD 170C>168.56 | 160P<161.01
LIKE IF YOU WANT MY FREE PICKS DAILY!

SPY Short 3-8% Correction I Don't Think So Goo Long Bull RunThe correction??? In my opinion and chart theory suggest its time to go long and find the proper to stocks to be in
Subscribe for update stock pick and the best sectors to be in so your not left behind!!
as for todays daily chart set up I suggest calls at least a week out as chart indicates
Goodluck traders like and subscribe
as for members that listened
and got in Baba ,3m, Pltr, & Tesla congratulations
I woke up this morning up 10k took profit!! not that many industries where u make 10k over the weekend

QQQ still confined to the trading channel since 2010The blue trading channel has been a very reliable resistance since 2010. You can see the many times that it has confined price action, only being broken during the COVID bubble. My guess is that it will continue to be resistance. We will likely see a repeat of the action from 2015 and 2018 where price will slowly work sideways but ever so slightly higher with numerous pullbacks until we see a large pullback to the support side of the channel.
Here is what the action looks like on the 1D. You can really see the price trying to break out, but as we saw back in April, it ultimately lost and we had a nice pullback to buy into.

BIG MOVE! SHORTS TRAPPED! What's next?Based on the chart analysis, the rising wedge pattern signals a likely bearish correction in the short term, with the price potentially testing the 0.618 Fibonacci retracement level around $518.36 as a key support. However, the Elliott Wave projection suggests a bullish reversal toward point (C) if support holds, indicating a medium-term upward move. Traders should watch for confirmation of support at the 0.618 level and look for signs of reversal to enter long positions, targeting the previous high around $532.99 and beyond. We must stay above $524.71 to escape this wedge channel and maintain the potential for an upward breakout. Maintain vigilance for a break below the 0.618 retracement, which could signal further downside risk.
Leave a comment of what you think about where the market is heading!

This will be the last rally SPY.SPY holding that 520 like god. They gonna rally test highs 533 it past that then we go 550 maybe. After that we should head down this time longer deeper. watch daily stoch turn up see how far it goes before turning. Why sell off
1. Rates are going higher u hear Bernstein saying inflation down 60% and 2% looks good target. WTF that why I play charts
2. Banks baby in trouble especially regionals other banks will fall also why debt man banks broke why they rally stock buy backs u understand that correct not productivity money to buy OWN shares back
3. Housing look XHB PHM housing about drop
4. IWM IWM has not yet and will not get to old highs that is bad bad.
5 breadth in market terrible
6 Watch fund managers sell into this rally get clients out.
so lets see next week we have SMH QQQ selling off to why inflation high rates
1 more high rates why banks dropping defaults not lending Jamie diamond announce no stock buy back may 23 look we dropped hard no stock buy back to expensive. National debt crazy. Lets see how next week goes. I am long SPXL 127.85
Thanks taking time read. Comments welcome.

SPY Under Pressure! SELL!
My dear subscribers,
EUR/USD looks like it will make a good move, and here are the details:
The market is trading on 529.51 pivot level.
Bias - Bearish
My Stop Loss -536.17
Technical Indicators: Both Super Trend & Pivot HL indicate a highly probable Bearish continuation.
Target - 519.29
About Used Indicators:
The average true range ATR plays an important role in 'Supertrend' as the indicator uses ATR to calculate its value. The ATR indicator signals the degree of price volatility.
———————————
WISH YOU ALL LUCK

$SPY Triple Top...AMEX:SPY getting spicy here, looks like a triple top for now headed into a lot of world news, ie Iran/Israel/Biden ... I think we've been overdue for a correction, this is a VERY solid base to start a downtrend and fill some gaps before heading back up for Trump Presidency... Buy the rumor stuff...
No positions, will look for continuation tomorrow...
- Prof
CONY: A Very Speculative Buy w/ Chart Pattern w/Bitcoin&CoinbaseFundamentals:
CONY is a covered call strategy. If bitcoin collapses again, the CONY will go bust. It could turn into a dividend trap. It is highly speculative. However, if bitcoin propels forward or goes sideways, then these two scenarios will be best for CONY.
Technicals:
Plan: To trade CONY buy observing health signals from bitcoin (BTCUSD).
Theory: Reading the tape is the same as identifying chart patterns with transaction volume.
BTCUSD is retesting its all time highs and consolidating.
BTCUSD has given two buy signals after re-testing all time highs: two morning stars on the daily chart.
BTCUSD daily uHd with extreme buy indicator.
Note: CONY today has issued a dividend of $2.7944 per share today; hence, the drop in the chart on CONY. Meanwhile, bitcoin has given a buy signal today. It is worth the risk.
Here is a daily chart of bitcoin with the buy signal:
CONY, itself, is within the 23.8% - 38% buy zone area of a large cup-with-handle pattern, after a minor successful cup-with-handle pattern within it that appear in February 2024.
If bitcoin does not collapse, then this could be the beginning of "wave b" or "wave 2" and end of minor 4th wave.
Comment:
I speculate that CONY will reach around $38 buy July or August 2024. The plan is to re-invest dividends along the way. I am treating the money invested as though all of it is gone, for now.

Opened (IRA): BITO June 28th 31 Covered Call... for a 27.55 debit.
Comments: Not the weakness I was looking for, but setting myself up to grab the early June dividend.
Generally, I'll look to roll out the short call at 50% max ... .

QQQ Will Collapse! SELL!
My dear subscribers,
This is my opinion on the QQQ next move:
The instrument tests an important psychological level 458.03
Bias - Bearish
Technical Indicators: Supper Trend gives a precise Bearish signal, while Pivot Point HL predicts price changes and potential reversals in the market.
Target - 442.80
My Stop Loss - 467.33
About Used Indicators:
On the subsequent day, trading above the pivot point is thought to indicate ongoing bullish sentiment, while trading below the pivot point indicates bearish sentiment.
———————————
WISH YOU ALL LUCK

Did you lose faith in the Bitcoin Miners??? WAGMI #WGMIThe Bitcoin miners ETF WGMI
has a lovely setup
you could be picking up cheap miners
slurping that blood!
For summertime profits... If you have the b@lls (& capital of course)
#CupandHandle
Clear as day
for all to see --- Yet sentiment is in the toilet.
Marvelous!
#CLSK
#WULF
#BITF #BITF.TO
#HIVE #HIVE.V
#MARA
#MIGI
#RIOT
#HUT
#GREE
#ARBK
#BTBT
#BTDR
#BTCM
#CORZ
#NILE
#IREN
#DMGI
#CIFR

The Runaway MarketThis is a post I have been meaning to do for a while, and now seems like the right time. If any of you wavers out there are having trouble discerning even a diagonal out of this junk, this is my real theory and my actual count on the S&P index, futures, and SPY. I posted this picture a in a couple of rooms on discord, and figured, hey, why not publish. Here is what I wrote in response to the third friend mentioning how "beast(ly)" is SPY?:
"SPY & ES ... Equity indices in general are propped up, heavily manipulated, irrationally worshiped, thus they appear "beast(ly)," but the crash is coming. We been off track since someone stole the market in 2013/14...basically, where we should have gotten a much more complex market correction, we got a Minuette (a)(b)(c)...Not soapboxing, but the past few months have me thinking about it again. Made up this chart if you guys want to take a look. Basically, for the past 10 years, instead of correcting DOWN...we have corrected UP, which makes no sense, and we see a series of runaway b-waves that all reconcile with a brutal 5 wave move to the downside. We are due a brutal 5 wave move of Cyclical proportion, right now. After that, I assume the market will resume like normal and rip higher in impulsive fashion for 40-50 years in its super cycle wave (V).
The chart shows what should have happened, the Red SuperCycle Wave and Cyclical correction drawn in white, and then what did happen, that same correction expressed to the upside in nearly undiscernable patterns. Annotated major reference points for context and magnitude comparison.
This is my real count. Based on everything I have learned not only about EW, but also markets in general and our ever more corrupt society, this is what I see when I look at the chart. Cycle C commeth."
I will add that I did not originally extend the Cycle c down to meet with SuperCycle (IV), but, hey, if this is what I think it is, maybe we do actually reconcile to a reasonable price location and get back on track, because with one more 5 wave move (needs to be of Cyclical Magnitude) regardless of where price is, it will be time to embark on a supercycle motive wave to the upside. No better place to start than the region where it SHOULD start.
Enjoy! -Cuz


SPY primed for a pullback on the WeeklyI recently found this parallel channel on the SPY. The 2 lines and the midpoint all act as strong S/R giving me confidence in this channel.
On this second recent hit of the upper end the RSI (with 7 period moving average for smoothed results), MACD, and Chaikin Oscillator are all putting in major divergences. This group of 3 indicators is my favorite because it shows relative strength, momentum, and volume trends. This leads me to believe a rejection of the upper end of the channel is happening right now.
Additionally, this recent ATH tagged the 1.382 extension from the 2022 bear market which acts as natural resistance for breakouts.
1st downside target would be the recent low, with the 2nd target being the previous ATH
This is my first ever post,
Enjoy :)

SPY FORECAST PRICE AND TIME I did this by my eye.. so not saying this 100% going on but in its area...ive put a lot a work to this. LUNAR CYCLE>>> with other cycles with wycoff and cosnidering where price is at in this cycle all of this is recent information i have posted pior to this... check out my yt for audio and my pov.... Trader Cw1ss... here to help and conquner our worries... Fear is a make belive emtion that the devil makes you belive... remmber who "i am" and the powers that come wit it... theres nothing new under the sun.. hint into what i belive the lord is the sun.. the lord must rise and fall... then theres a light that rules the day and night... for more info trader cw1ss on yt

XLF To RallyXLF normally moves quite slowly, but we may may be at a moment in which that accelerates substantially, even improving on what has been a phenomenal year.
Weekly -
Daily -
The EW path drawn is what may be expected most commonly - we're looking for that or better.

Russel 2000 ETF (IWM): cup-with-handle formingDAILY Russel 2000 ETF (IWM) cup-with-handle pattern
A break above 210.60 in June will send it flying to 232 by August 2024.
Weekly:
Weekly stage three Ichimoku crown pattern
Daily:
cup-with-handle pattern
first pb of new trend
5emas-macd pb
Ichimoku stage 3 with "FLY" bounce off cloud pattern

June 5th date wrong strucuter rightlok at previous data i have posted..dates are wrong price is right
june 6th should be last time selling buy on that day or change of bias

$TLT: $92-100 before $85-$75I'm not sure what's going to happen in the immediate term (1-2 weeks), but after that I think we'll see a bond rally from middle of June into July up above $92 and the possibility of going as high as $100. My base case is that we get a move up to $97ish level, but not ruling out the possibility of retesting the highs of the recent move.
However, after July, things don't look great for bonds, I think we'll see a new low in bonds and a new high in rates that will catch many people off guard.
I think we reject somewhere in the $92-100 level and then start our next move down to new lows somewhere in the $85-75 range between August and October.
Let's see how it plays out.

Rolling (IRA): TLT Feb 21st 100 Calls to the 95 Calls... for a 1.09 credit.
Comments: Looked at all my options here for the rolling of the short call aspect of my covered calls -- rolling down, rolling down and out, rolling out as is, rolling to shorter duration and down ... . Going with rolling down in the same expiry for a 1.09 credit.
Resulting cost basis: 89.11.
It still remains a bet that the Fed will cut rates at some point, just with lower max profit potential.
