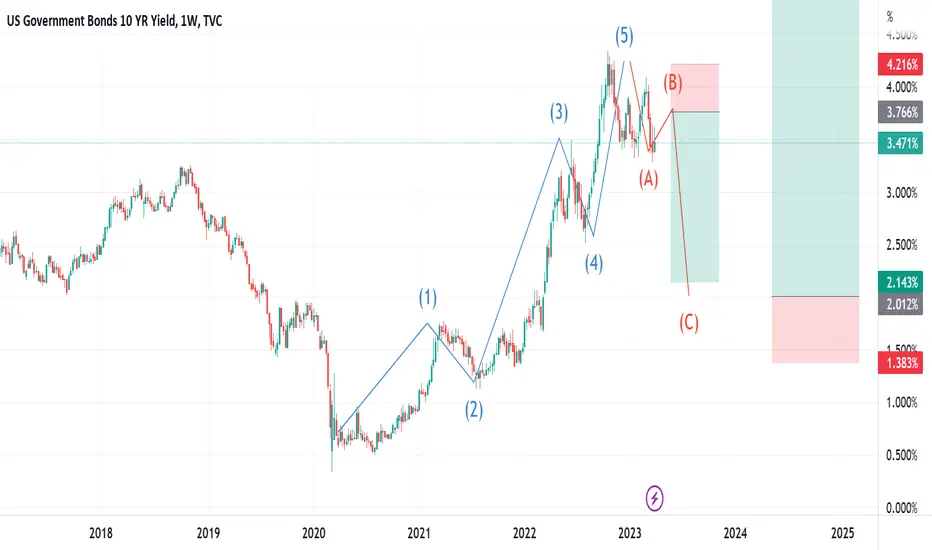
10 Year Yields Topping Out5 wave high completed at 4.25% and now showing potential to see 2.75% on wave C lower in Q2
Government bonds

That may have been the first break.Update to:
All lines original. No update the analysis/charting, just a follow up to say if this thesis was in play we'd now have held the wave "B" retrace/failed new high and be heading into the corrective C leg. Which would present itself as a capitulation in bonds yields over following big price swings.
Usd 30y bond AND DXY Bearish pressure analysis30 years bond shows weakness on the chart while Dollars index is showing a green bar daily divergence,
Most assets are having a green bars the 31st March will that stay the same till we all go in march
Or take profit and first quarter profit taking will occurr?
Most assets are above their 50% from last bottom
only the Indexes are currently sitting on a +15% from last bottom
This is not a trading advice
DYOR

US10Y: Rising short term inside its Channel DownThe US10Y is trading inside a Channel Down on the 1D timeframe with the 1D technicals neutral (RSI = 46.172, MACD = -0.046, ADX = 31.478). With the 1D RSI coming off an accumulation that we've seen on the December and January bottoms, we expect the price to rise and approach at least the 0.618 Fibonacci. Our TP = 3.750.
## If you like our free content follow our profile to get more daily ideas. ##
## Comments and likes are greatly appreciated. ##

US10Y has not broken the support yet, all eyes on monthly close.It might appear on daily and shorter time frames that US10Y has broken the trend, dating back to 2020.
Weekly at key support level.
it will save the regionals (yield dives due to massive QE, HTM portfolio's MTM improves) or will destroy them (KRE).


✅US30 BEARISH BREAKOUT|SHORT🔥
✅US30 broke the local rising
Support line and the breakout
Is confirmed because the
4H candle closed below the line
So I am locally expecting a
Move down(after potential
pullback and retest of the broken support)
Towards the target below
Around the 96'16'0 area
SHORT🔥
✅Like and subscribe to never miss a new idea!✅

EMA Crossing and Breakout of Support in EUBUND (15 Min Time)Hello Traders,
The EUBUND has been showing signs of bearish momentum in the 15 min time frame as indicated by the EMA (Exponential Moving Average) crossing and the breakout of the support level. This suggests that there may be a potential trading opportunity for sellers in the short term.

What’s next for Gold & S&P 500?Having covered Gold & the Equity Index last week, this week we will look at how we could leverage both to trade on the move we’re watching!
Quite a happening market we first covered Gold two weeks ago.
Firstly, the interest rates market had a sizeable correction, with the 10Y-2Y yield now trading at close to -0.45% instead of the -1% range just 3 weeks ago.
Secondly, with FOMC out of the way, we have some clarity on what the Fed thinks of the current bank contagion episode as well as how markets reacted to the Fed’s statement.
With all these in mind, one thing we want to point out is the relationship between yield curve inversions across the different tenures of the curve. Comparing the past 2 episodes of yield curve inversion on the shorter and longer end of the curve, we note a few things here.
Firstly, the 10Y-2Y inversion generally leads the 2Y-3M inversion. Secondly, the past 2 times when both sections of the curve were inverted, we saw a significant sell-off in equities happening soon after. Thirdly, the inversions also marked the start of the next leg up for gold.
With peak inversion likely to pass for the 10Y-2Y curve and 2Y-3M inversion at the all-time low now, we see some potential to buy Gold and sell Equity Indices, as we’re raised over the past 2 articles!
When we use the S&P500 Futures Contract and the Gold Futures contract to view the ratio of the S&P500 / Gold, this ‘Selling’ point becomes clearer!
With the past 2 periods falling 59% and 69% respectively and lasting more than 700 days, this trade could take a while to play out, but the risk to reward seems attractive.
As to the hypotheses of why this relationship might exist, it could reside in the idea that abrupt rate cuts likely merely take place in a time of financial distress, hence the selloff in equities and flight to safe-haven assets like gold. When rates fall off, the non-yielding assets like Gold would start to look more attractive to yield-hunting investors, which could have added fuel to the Gold rally, too.
Taking a conservative target of 35% lower from the current ratio level of 2, we position a short in the S&P 500 / Gold ratio by selling 1 S&P 500 Futures and buying 1 Gold Futures, at the current price of 1980 for CME April 2023Gold Futures (GCJ3) and 4010 for the CME June 2023 (ESM3 ) S&P 500 Futures, the notional value of the position for the long & short leg is almost equal at;
Long GCJ3: 1980*100 = 198,000
Short ESM3: 4010 * 50 = 200,500
Setting up such a spread trade requires some monitoring of the difference in notional value to ensure that the position is properly hedged. Each 0.25-point move in the ESM3 contract is equal to 12.5 USD while a 0.1-point move in the GCJ3 contract is equal to 10 USD. Trading this spread would be eligible for a margin offset of up to 70%, meaning that the capital required to set up this trade is much lower.
The charts above were generated using CME’s Real-Time data available on TradingView. Inspirante Trading Solutions is subscribed to both TradingView Premium and CME Real-time Market Data which allows us to identify trading set-ups in real-time and express our market opinions. If you have futures in your trading portfolio, you can check out on CME Group data plans available that suit your trading needs www.tradingview.com
Disclaimer:
The contents in this Idea are intended for information purpose only and do not constitute investment recommendation or advice. Nor are they used to promote any specific products or services. They serve as an integral part of a case study to demonstrate fundamental concepts in risk management under given market scenarios. A full version of the disclaimer is available in our profile description.
Reference:
www.cmegroup.com
www.cmegroup.com

03/27Sun 03/27 ~
Got the rejection we were looking for off the “key” support and mkts pumped. Saw a HH into LL @ gfib; a setup for reversal. Next wave should form LH
Us govt reversed 2/3 of QT recently so could see weakness in 2yr over coming months
Rmb Bonds down, mkt up and vice versa

10 Yr Bonds - Yields Close to an Intermediate Low10 Year bond yields closing in on a wave 4 low.
I would expect some sort of base building price action before the next leg up. This will provide clarity on the projected completion of this 5 wave pattern.
Yields have recently dropped in a flight to safety surrounding the bank failure panic. Does the stabilization of yields signal that crisis easing? Will the rise in yields negatively or positively impact stocks? What about the dollar, crude oil, gold.... All of these markets are at a transition point. This is a common phenomenon in March... history repeating?

Rates Potentially Peaking in Q220Year Yield looks like an ABC pattern down to 3.25% coming up next quarter


Us rates trend down Us short term rates are heading lower and markets are telling you that. Follow the trend


US 10 YEAR TREASURY YIELD WAVE ANALYSIS (FULL PICTURE)Well well well. If this wave hypothesis is right, then the 10-year treasury yield will be bullish and that the banking crisis may not be over as treasury price is inverse to the yield. Seems very bullish dollar is underway and the 10-yield may catch up with the rate rises. This could also be bearish for gold and the US equities too especially the NASDAQ.
If you like my analysis or they are helpful to you in anyway, please like and follow me.

EMA Crossing and Breakout of Resistance in EUBUND (15 Min Time)The EUBUND has been showing signs of bullish momentum in the 15 min time frame as indicated by the EMA (Exponential Moving Average) crossing and the breakout of the resistance level. This suggests that there may be a potential trading opportunity for buyers in the short term.

10 Year Yield Simple Short SetRegarding the charting aspect, this presents a straightforward short setup that offers an excellent risk/reward ratio.
However, from an economic standpoint, there are several factors to consider.
1. Headline inflation for food and energy, when measured from the start of the war, which caused substantial price increases, will likely fall YOY.
2. As the economy continues to slow down, there is a real possibility of a recession, not the "Transitory" "FED pivot nonsense" that "Experts" have been discussing for over two years.
3. Until now, the private sector has managed to maintain its revenue and profits reasonably well, given the circumstances.
Going forward, this will become increasingly challenging as we have already reached maximum employment with weak wage growth.
Therefore, the critical question becomes: how quickly will bond yields or EPS decline relative to each other? The answer points to what Stocks and Cryptos will do.

Long wicks on 10YYThe last few days have seen several candles with long lower wicks on them at a key support level of 3.4%. It looks like yields may rise in the near future (ie bonds sell off).

Assuming that the US02Y has peaked......Fed rate cuts should be dead ahead. This shows how the US02Y leads the Fed Funds Rate. Based upon this, should the Fed hike 25BPS this week - as it is (currently) expected to do - that hike should be the last unless the US02Y rises again.

It's Topped...Only bull traps will follow here ultimately - next one should be an easy short if it comes - Overall this is going down like a stinking bag of bonds over the mid-long term so don't get stuck in it.


US1OY | DXY | DECRYPTERSHi people Welcome to Team Decrypters
Bonds Yield going Down Causing Bond prices Go Down
Which causes Banks to get Liquidated
Investors Moving money from Bonds in to
BTC & Gold
We Expecting 25 BPS
