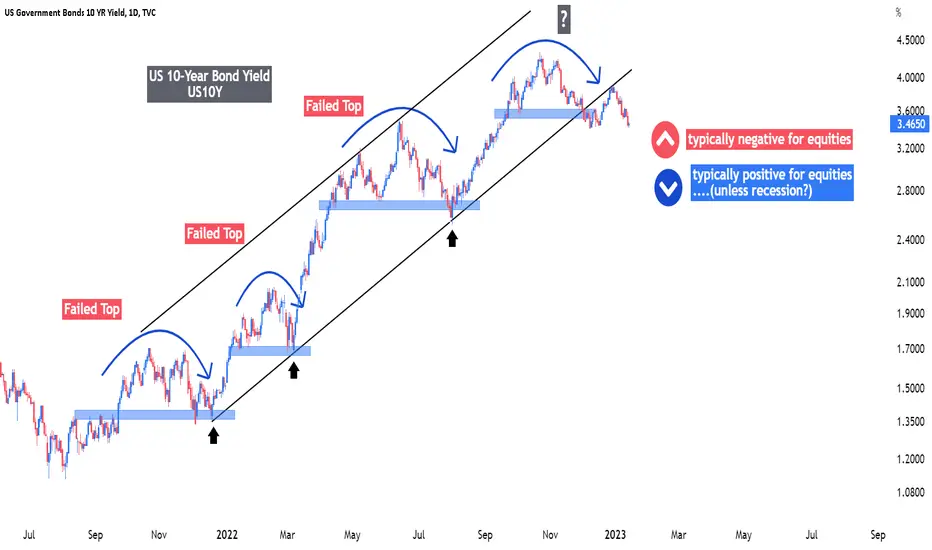
US10YYields can explode from here as earning on US equities disappoint on earnings and job losses set in job losses
Government bonds

How will markets react to rising yield and dollar?Moving averages can be applied to many things, from stocks and currencies to fitness measures and crop harvests. Here, the candles show US10Y is finding support off the 200ma, after making a significant decline. The 20ma (blue) and 50ma (dark blue) will indicate the yield's next trend as they separate.
The green line graph shows a serious decline in the U.S. dollar. As the orange short-term trendline shows, it may be ready to move a little higher.
The yield and dollar may not rise back to the highs, but they definitely can move up for a bounce in the near term. If the recent relationship continues, then this would create selling pressure for global and tech stocks while giving another lift to defensive sectors.
Here's a little-known fact to watch out for:
Starting in January, a new formula is being used to calculate CPI (consumer price index) data. The first release of this will be in February and the numbers are expected to increase relative to Dec. data. The new calculation will update spending weights annually (using one year's data) instead of biennally. Thus be alert to the possibility that markets react negatively to a high Jan. CPI, as the majority now think prices are coming down. On the flip side if CPI is in-line or lower even with the new formula, then markets will get quite a lift.
www.federalregister.gov

US 10 YR YIELD - ObservationThe US10YR has now retraced to the 200dma and close to the yearly pivot point.

US 2/10 yield spread in a for a massive reversalUS 2/10 yield spread approaching macro support. TA bottom might be slowly forming too (need confirmation)
Expecting the spread to reach 0 before the summer while the rest will be history
buckle up

Looking for #us10y to find Higher LowsLooking for #us10y to find Higher Lows and continuation to the upside as new highs were made. #us10y moves opposite to the #crypto market.

bombs awayAre #gold shorts paying attention to anything?
All support is lost on #us10y, and now even closing below weekly EMA30 (shown in blue)!

Looking to Short 10's On a breakdown on the daily, ill be shorting 10 year bonds.
High on all the higher timeframes.

S&P500 may be on the verge of a mega rally based on the US02YThe chart represents the US02Y on the 1W time-frame against the S&P500 index (green trend-line). The phase that the US02Y has entered is similar to that in entered in December 1994. As you see shortly after a Golden Cross, it made a Lower High on the RSI, flashing a Bearish Divergence, while the MACD Double Topped. This is exactly the same sequence of events in the exact same order since the June 2022 Golden Cross.
The US02Y fall of December 1994 practically started S&P's mega rally of mid-late 90s that led to the 2000 Dotcom Bubble. If history is repeated, instead of a continuation of the Bear Market that most expect, S&P500 my be on the verge of a new multi-year Bull Cycle.
-------------------------------------------------------------------------------
** Please LIKE 👍, FOLLOW ✅, SHARE 🙌 and COMMENT ✍ if you enjoy this idea! Also share your ideas and charts in the comments section below! **
-------------------------------------------------------------------------------
💸💸💸💸💸💸
👇 👇 👇 👇 👇 👇

WILD VOLATILITY IN JAPAN - YIELDS FALLJGB's have collapsed from the highs. Falling over 22% tonight. If this weakness in the Japan yield market continues we should see the DXY eat that up.
this is a weekly chart of the JP10Y. It demonstrates a multi year trendline of resistance for Japanese debt. This chart data only goes back to 2006 however we still have to respect a major trend until proven otherwise.
Perhaps if this reversal completes on the weekly & monthly timeframe, Japan economy could be signaling some risk if a deflationary event were to happen rapidly.
Since BOJ owns most of the Japanese debt (bonds) analyzing this market can be tricky since its theoretically rigged since the buyer is the seller & the seller is the buyer.

US yields looking for another move upLooks to have formed +ve divergence on RSI.
FED are NOT going to pause/pivot in coming weeks. Data still ok as a whole and until much softer yields have to go/stay higher for longer than people think.

US02Y : Market speaks out!It seems that the front end of the curve is starting to 'speak out'. Unlike in the past, it is NOT moving up despite the recent 50% rate hike. This is significant because whenever the FRONT starts acting up, we can expect something BIG and SIGNIFICANT coming up.
As we can see, a BIG portion of market participants disagree with the recent Fed decision. In fact they are now betting against the Fed. This is a lot of money involved here. We are not talking day traders like you and me; or even big speculators. The Bond Market involves much bigger players and their opinion matters.
There may be two reasons. One is that they see the recent 'slow down' in rate hike might soon turn into a freeze and pivot, with a 'soft landing'. The second is more important. They might sense that the economy is nearing a RECESSION when everything grinds to a halt. Some are forecasting a deep and long lasting recession. For this, we look at the US10Y and see how much it will drop. But whatever it is, 2023 will not be a good year.
Three days ago, I heard someone talking that GOLD will reach $3,000 in 2023! And so says Saxo Bank. Perhaps you should be aware what will happen just by looking at Bond yield which is saying 'future growth looks 'bleak'. Gold, Oil and stocks will be at RISK with the coming recession. Whether it is a BIG one is still debatable. But if the Fed insist on hiking again, chances are it is going to be a BIG one. Money supply, at least in the US, is FALLING. If you look at M2 and do a simple extrapolation, to get gold at $3,000, there needs to be a really HUGE increase in MONEY SUPPLY (note that inflation do not determine Gold price. It has always been money supply. Whether money supply leads to inflation is another thing. But if market participants think that inflation is going to high in the future, would they continue to drive yield lower?) .
USDJPY would be a nice to trade. It is just a matter of looking for the right time/place.
EURUSD is a bit risky with the ongoing war in Ukraine.
Have a nice weekend.
P/S : As always, do not just believe what I say. Use your common sense.

Long US 5s30 Yield CurveThe US Government Treasury 5Y vs the US Government Treasury 30Y is now back above inverted levels and will continue this path as the FOMC hawkish rhetoric and major policy error will drive the US into a recession this year. It is in our opinion that this trade will move from inversion to +100bp as the FOMC pivots, equity markets falter and the FOMC stops their QT and stops Mortgage Back Securities and US Treasury roll offs. In a fiat fractional reserve system the current set up requires continued fiat printing or QE in order to keep asset prices higher. Also inflation is transitory and stemmed from the fiscal direct payment stimulus post Covid. We will see wage pressure come down, debt service go up and a tighter economic environment. All of this is telegraphed already in leading economic indicators. We believe this trade has a better than 5 to 1 payoff structure, risking -25bp to make 125bp.
PAST PERFORMANCE IS NOT INDICATIVE OF FUTURE RESULTS- Trading is risky and may involve leverage, Magnelibra or any of its affiliates are not suggesting in any way to guarantee any profits or against any future losses. Trading should be done by well capitalized and individuals well versed in quantifying risk.

Martin Luther King Jr. Day - Market AnalysisKey events:
US – Martin Luther King, Jr. Day
UK – BoE Gov Bailey Speaks
The recently released CPI is prompting investors to question the Fed's plans to raise the overnight rate above 5%. The market doesn't seem to care, and after this data coincides with the forecast, yields are falling across the curve. Thus, 2-year Treasury yields have fallen to their lowest level since October, with room to fall substantially.
If the Fed really does intend to raise rates that much and maintain tight financial conditions, then it appears that the market is not listening to the central bank and not paying attention to what it wants.
This only suggests that the Fed's forward guidance is no longer working. The Fed will have to dig into its toolbox to convince the market that it is serious. The central bank may have to talk about accelerating the pace of balance sheet reduction or outright sales of treasuries and mortgage-backed securities.
The market indicates that the Fed's interest rate hike cycle is coming to an end, with the belief that the central bank will be forced to cut rates as soon as 2023. However, the Fed continues to insist that it plans to raise rates above 5% and leave them high and financial conditions tight for a long time.
The 2-year Treasury yields fell to their lowest level since early October. This is the first weakening in months. Apparently, the rate cut is now embedded in the quotes of not only the federal funds rate futures market.
As a consequence, the Fed will be forced to use balance sheet talk as a last resort to ensure that rates remain elevated and the dollar remains strong enough to prevent a stronger-than-acceptable Fed easing of financial conditions.
The market, on the other hand, is trying to figure out how much pressure it can put on the Fed to maintain tight financial conditions. If the central bank is serious, sooner or later it will try to fight back. Otherwise, the Fed will lose control of the public discourse and won't be able to tell the markets what direction it thinks they should go.
Talk of a higher overnight rate is no longer having the desired effect, so the next option for the Fed is balance.
If it doesn't use that option, the markets will take it as a signal that the Fed is okay with easing financial conditions and thus gives the markets permission to continue the rally.

US2YR SFP M1With the 2YR printing a M1 SFP we can expect a sharp reversal on yields shortly - this may be confluence for the bias of a FED pivot and return to risk.

Big Four Macro Outlook: 10 Year RatesI begin each year reviewing the long term technical positions of the "Big Four." 10 Year rates, SPX, Commodities, and the US Dollar. Since by profession I am a rates/credit portfolio manager and trader, I always start with rates. Granted, macro doesn’t typically impact shorter term (swing, daily and weekly) trading, but having a framework for markets and for recognizing change is important. Last year’s thoughts, including extensive fundamental background, are linked.
In this piece I will recap my views on the monthly chart and follow next week with my view on the weekly chart and conclusions.
A reminder that falling bond yields are synonymous with higher bond prices. In other words, a downtrend in yield = a bull market in bonds.
Over the last four decades bonds had consistently and reliably made lower highs and lower lows. The entire bull market was defined by a broad declining channel (A-B, C-D). The A-B downtrend line represented the "stride of demand" or the zone where buyers consistently emerged and the C-D line represented the "overbought line" or the zone where supply consistently emerged.
From 2012 forward there were growing signs that the long downtrend was aging. Four things stood out. 1) The repeated failure to push to the oversold line (C-D). 2) The flattening out of the decline where each push to a new yield low only covered around 100 bps. 3) The 2018 spike to 3.25% that weakened the primary A-B downtrend. 4) In March of 2020 bonds pushed to the area around the center of the channel, and again failed to push into the overbought line (C-D), suggesting that demand was tiring. These very visible change of behavior strongly suggested that the 40 year downtrend was in danger.
Now, the clear break and acceleration above the A-B downtrend has moved the long trend from bullish to neutral. While it’s likely that the move above November 2018 pivot @ 3.25% coupled with the changes of behavior mark the beginning of a long term bear market, a higher low (perhaps forming over the first half of 2023) is needed to complete/confirm that change.
Note the additional changes in behavior. The 400 bps move from 0.33% to 4.33% represents the single largest bearish move since the inception of the bull market in September 1981 and the current MACD oscillator level has far exceeded the levels that marked yield highs over the course of the entire bull market.
Triple Screen: Daily, Weekly, Monthly:
There are several key fundamental points around rates:
-The defining macro characteristic of the 40 year bull market has been the continual fall in the inflation rate. If that is changing, the secular bond trend is likely to also change.
-If the trend in inflation is changing, the negative correlation between bonds and equity that drives 60/40 allocation and risk parity investing is likely to flip and become positive. In other words, bonds and equity would, outside of periods of panic, rise and fall together destroying the diversification benefit. This has been the historical norm and I expect that the market will gradually move in that direction.
-The caveat being this: Quantitative easing removed the value proposition from bonds, when equities began to decline this year bonds COULDN'T provide a safe haven… they were already far too expensive, particularly in context of a Federal Reserve that was aggressively tightening monetary policy, that is no longer the case. Bonds, while still expensive can again provide a tactical hedge should risk assets weaken dramatically.
-At first glance, this seems at odds with the with the change in correlation discussed above, but it is a difference between the secular tide verses the intermediate wave.
-Most substantive bond rallies have been the result of a crisis that created a flight to quality. In an economy that is overly financialized and levered, rising rates often break the weakest link in the economic chain, creating a new crisis and a subsequent flight to quality rally. While so far, there is little evidence of a systemic crisis, the lagged effect of the rapid increase in rates in an overly financialized system demands attention.
Bottom Line: While there is still more work to be done to confirm the trend change, I believe the bond trend is finally changing as the world moves from the deflationary backdrop of the last several decades to an inflationary backdrop. I will be a much better seller of rallies and bearish technical setups in the weekly/intermediate perspective.
Good Trading:
Stewart Taylor, CMT
Chartered Market Technician
Shared content and posted charts are intended to be used for informational and educational purposes only. The CMT Association does not offer, and this information shall not be understood or construed as, financial advice or investment recommendations. The information provided is not a substitute for advice from an investment professional. The CMT Association does not accept liability for any financial loss or damage our audience may incur.

US2YR Bond Yield Topping OutUS 2 Year Yield seems to have confirmed a reversal on the weekly which in turn seems to have given stocks and crypto some cause to rally. Too early to say yet if it will be sustained. Lets see if we get a continuation.

2 Year Trutheries Claims Fed Pivot Soon!Fed claiming to continue rate increases. 2-year treasuries calling, "Bluff"! One of them is lying.

US10YUS 10-Year Bond Yield | Chart #1 | The rejection of the re-test of the channel breakdown is seeing further downside follow-through. The yield is trading near the early-December lows of 3.4% of which a downside breach would create a further short term technical tailwind for bonds (i.e. yields down, bond prices up).
US 10-Year Bond Yield | Chart #2 (not shown) | Note that the yield is close to it's first re-test of it's rising 200-day moving average since 29 December 2021. Usually, the 1st test after a prolonged absense is met with support, possible an overshoot to the downside followed by a rebound. Let's see how it acts if and when it gets there.
35. A lesson on INFLATIONFolks,
This is the hottest topic nowadays. Everyone is talking about it. How high will it go? When will it end? The obvious reason being solely to predict when the Fed will pivot.
Lets look at the MARKET reaction to date. When 2Q GDP was announced, US02Y drop below the 50MA. This is the market saying the pivot is near. The Fed will stop hiking rates because the economy is contracting and in recession. Since then, the market has sobered up and is now anticipating a 50bps hike next month (current = 2.50% + 0.50 = 3.00%) and is hovering around 3.00%. We can see from this that the MARKET is indeed VERY OPTIMISTIC and is somewhat ignoring the recent DOT PLOT.
But for us, it is best to really understand the situation correctly. This is often not found/mentioned by the MSM. Inflation is a topic best covered in mystery and not easily predictable. Or is it?
Lets use some logic and common sense.
INFLATION WILL END 13 MONTHS FROM THE DATE WHEN THE HIGHEST PRICE WAS RECORDED. And when we talk about price, the easiest would be to use the single most important commodity - OIL. USOIL traded at the high of $129.416 on 8 March 2022 . So regardless of what the Fed do or not do, inflation will start to normalize sometime in March 2023.
Get it? For example, you may be paying $2/gallon. But because of inflation, price suddenly jump up to $5/gallon. Even if price continue to stay at $5/gallon, 13 months later, there would be no inflation as price remain the same y-o-y.
It is just some statistical shitfuckery used by the policy maker to justify that things are back to normal.
That is why the stock market is so 'RESILIENT' - they are just waiting for the coming happy time just a few months away.
That is why the market is so bold to even ignore the DOT PLOT.
Lets continue to monitor the US02Y. And when it really drops below the 50MA and below the FFR, then we might see the Fed finally capitulate to Market Demand.
Good luck.
P/S : As always, do not just believe what I say. Use your common sense.
1) Do not forget beside the FFR, there is also a Balance Sheet Reduction going on. This will impact liquidity and based on latest Fed talk, they are indeed serious about this this time around.
2) There is still a war going on in Ukraine and this has direct impact to EURUSD we are trading. Regardless of pivot or not, the situation in Euro Zone is quite dire. Germany is collapsing and without GAS, they are looking at a DEEP and LONG recession in the coming months.

US02Y: Falling Wedge, Sign of Stronger Dollar Ahead?Hello Fellow Trader/Investor!
Price Action Analysis
US Government Bonds 2 Years Yield is moving above EMA90, indicating a bullish trend. The Falling Wedge Pattern is a bullish continuation pattern confirmed by the recent breakout. The MACD Indicator made a golden cross, signifying a possible upside movement to the target area.
Fundamental Drives
1. The Fed does not reach the 2% Inflation Target Yet
2. Hawkish Fed Position usually makes the bond yields potentially increase, which will cause a bullish dollar outlook.
All other explanations are presented on the chart.
The roadmap will be invalid after reaching the target/ support area.
"Disclaimer: The outlook is only for educational purposes, not a recommendation to put a long or short position on the US02Y"

US10Y Hit a 9month support. Critical moment for the market.The US10Y hit today, in the aftermath of the 6.5% U.S. CPI, the Higher Lows (HL) Support line that has been in effect for 9 months (started on March 7th 2022). With 1D technicals bearish but not heavily (RSI = 42.655, MACD = -0.035, ADX = 36.284), the trend is undecided at the moment, at least on the short-term.
Though we see a clear Channel Down since the October 21st 2022 Top, the price can give a short-term bounce back to (and above) the 1D MA50 and the top of the Channel. Eventually, with the macro-economic outlook on the bond market changing, we believe the bearish trend will prevail on the long-term, with our immediate target being the 1D MA200.
## If you like our free content follow our profile to get more daily ideas. ##
## Comments and likes are greatly appreciated. ##
## Also DONATIONS through TradingView coins help our cause of increasing the daily ideas put here for free and reach out more traders like you. ##

US 10Y Yield at key inflection pointMarket looks fragile, and has potential for a sharp reversal lower.

US10YTesting the waters here- as i have taken a long break from TA and want to experiment with new ideas.
