USOIL nearly looking for target Hey there on 1hTF the USOIL has looking for all target completed target
So we can observe the oil look for upside and then will drop continue
Futures market

Today's trading strategy, sell XAUUSDWorld gold prices increased slightly with spot gold increasing by 5.7 USD to 2,342.6 USD/ounce. Gold futures last traded at 2,364.5 USD/ounce, up 27.6 USD compared to yesterday morning.
Gold prices reversed to increase after the latest published data showed that economic growth in the US has slowed down from the beginning of the year until now. According to preliminary data on first quarter GDP released by the US Bureau of Economic Analysis on May 30 (US time), the US economy achieved growth of 1.3% in the first 3 months of the year, lower than the previous quarter. The previous forecast was 1.6% and down from 3.4% reported in the fourth quarter of 2023. Both the dollar and Treasury yields fell on expectations the US Federal Reserve (Fed) will cut interest rates this year increased after the report.
ActivTrades senior analyst Ricardo Evangelista said that recently, traders' views have increasingly favored the scenario that the Fed will keep interest rates higher for longer, increasing the opportunity cost of holdings of the yellow metal and creating strong price resistance.
However, this expert said that gold has benefited from strong safe-haven demand due to fears of geopolitical instability and economic instability, as well as large state purchases. He hopes that these factors will likely continue in the near future.

NQ Power Range Report with FIB Ext - 5/31/2024 SessionCME_MINI:NQM2024
- PR High: 18592.75
- PR Low: 18557.75
- NZ Spread: 78.5
Key economic calendar events
08:30 | Core PCE Price Index
09:45 | Chicago PMI
Value decline back into May 17 lows
- Extending from 19000 pivot
- Near daily Keltner 20 avg
Evening Stats (As of 1:05 AM)
- Weekend Gap: N/A
- Gap 10/30/23 +0.47% (open < 14272)
- Session Open ATR: 226.73
- Volume: 36K
- Open Int: 253K
- Trend Grade: Bull
- From BA ATH: -2.4% (Rounded)
Key Levels (Rounded - Think of these as ranges)
- Long: 19246
- Mid: 18106
- Short: 17533
Keep in mind this is not speculation or a prediction. Only a report of the Power Range with Fib extensions for target hunting. Do your DD! You determine your risk tolerance. You are fully capable of making your own decisions.
BA: Back Adjusted
BuZ/BeZ: Bull Zone / Bear Zone
NZ: Neutral Zone

Gold Prices Edge Up SlightlyHi guys, this is my overview for XAUUSD.
Gold prices are exhibiting a slight upward trend this morning. Global gold prices have increased by 0.16% compared to yesterday, reaching $2,342.52/ounce. The primary drivers behind this price increase are concerns over high inflation and geopolitical tensions. However, the upward momentum of gold prices could be restricted by the pressure from interest rate hikes by the US Federal Reserve (Fed).
What are your thoughts? Let's discuss and share your opinions in the comments section below!

GOLD H2 route mapIn this analysis, we'll be focusing on the H2 timeframe for XAUUSD, with key levels at 2331.00 and 2320.00 If the price breaks above 2331.00, the target is set at 2348.00, indicating a potential upward movement.
Conversely, if it breaks below 2320.00, the sell target is identified at 2306, suggesting a bearish trend. Let's delve deeper into these levels and potential outcomes.

SUPPLY AND DEMAND / PARALLEL CHANNELIn this analysis we are focusing on M30 time frame. Here we have parallel channel, which shows market internally structure was bullish. If market price come back and retrace the (2406 - 2400) key level zone than after confirmation we look for buy. And the target is set at 2430. If there is no retracement and market will directly move upside then we will wait, when market will touch our POI zone then we look for sell. let's delve deeper into these level and potential outcome.
KEY LEVEL OF POI ZONE: 2428 - 2432
RETRACEMENT AREA KEY LEVEL: 2406 - 2400

SUPPLY AND DEMAND / SMC CONCEPTIn daily timeframe we have POI zone and inside the daily POI zone we have two supply zone. Recently market break the previous high so BOS was formed. once the BOS was formed market will come back to take the inducement. after taking the inducement market will make another higher high which indicate that market is in bullish trend.
In this analysis, we'll be focusing on the H1 timeframe for XAUUSD. We are looking for SELL opportunity from supply zone area (2392 - 2400). If the market price reject (2392 - 2400) supply zone area, than we go for sell and the target is set at 2380.00. But if market price break the area of supply zone toward upside than market price will go further in upward direction and we have another supply zone area at (2410 - 2416). Let's delve deeper into these levels and potential outcomes . Without any confirmation we can not execute our trade.
IN DAILY POI ZONE WE HAVE TWO SUPPLY ZONE:
Supply zone(1) key level: 2392 - 2400
Supply zone(2) key level: 2410 - 2416
----------------------------------------------------------
BREAKER BLOCK KEY LEVEL:2380 -2375

SUPPORT AND RESISTANCE / PRICE ACTION✅Gold managed to create a New All-Time High(ATH) at the beginning of the week.
🏃♂️Currently, Gold is moving near the 🔴PDL previous day low 🔴.
🌊According to the SMC / ICT concept, when market price sweep the liquidity, once the sell side liquidity has been swept completely then market will move further according to the direction of the trend.
💡Also, we can see Bearish momentum is very strong.
🔔I expect Gold to continue falling to at least the 🟢SUPPORT AREA🟢.
Gold Analyze ( XAUUSD ), 4-hour time frame ⏰.
Do not forget to put Stop loss for your positions.

TRENDLINE SUPPORT / PRICE ACTIONIn this analysis, we'll be focusing on the H1 timeframe for XAUUSD, In this analysis we have trendline support and also we have ( S1,S2 / R1,R2 ) levels. If trendline breakout is real than price goes toward the S1 level. Conversely if it break below the S1 level than the price will reach at least S2 level. If trendline breakout was not real than after confirmation we look for buy. Let's delve deeper into these levels and potential outcomes.

XAUUSD POTENTIAL SHORTXAUUSD has pulled back to the 61.8 zone with bearish rejection indicating a sell off. I am expecting price to fall below 2320.00. Use proper risk management while taking this trade and do your own analysis before taking this trade.

5.31 GOLD strategyBased on the information you provided, here is the translation:
Yesterday, we exited our short position at the profit-taking point based on the support level given by the 1-hour chart. Now, as the gold price continues to consolidate at a high level, the resistance levels on the 1-hour and 2-hour charts remain valid. We need to wait for the price to rebound to the resistance level before entering a new short position. If there is an effective breakout, we should switch to a long position.
1-hour resistance: 2352
2-hour resistance: 2360
4-hour resistance: around 2373
As for the monthly chart mentioned a few days ago, today is the closing day. If there is no significant surge in the last trading day, it will form two long wicks, which indicates a potential for a larger price correction in the later period. This needs to be noted.

GOLDThis Weekly FORECAST
Opportunity for GOLD. This setup trading idea is for swing. >> TAYOR
Risk Factors:
1. Market conditions, unexpected news, or external events could impact the trade.
2. Always use risk management strategies to protect your capital.

Analysis of XAUUSD intraday, ranging market today👋Hello Traders,
Our 🖥️ AI system detected that there is an H4 timeframe is in ranging market right now and move between the supply zone and demand zone today before news.
For more ideas, you are welcome to visit our profile in tradingview.
Have a good day!
Please give this post a like if you like this kind of simple idea, your feedback will bring our signal to next better level, thanks for support!

Gold Xau usd broken bullish momentum opens much deeper targets Following my successful today's trade on FOREXCOM:XAUUSD , price action overpassed the bottom of the zigzag structure.
I am expecting a limited pullback to the 2329 price area before going further south

*Investors, Heads Up| XAUUSD Breakout Alert*📣 Traders, take note! 🚀 XAUUSD is soaring, hitting new peaks with accuracy! 💫 Check this out:
🔍 XAUUSD Analysis: 📈 Battling within the 2341 to 2348,7 range. 🤔 Will it break through?
🔻 Bearish Alert: 🔻 Watch for potential declines if it falls below this level! 🎯 Targets: 2337, 2335.
🔺 Bullish Alert: 🔺 Look for buying opportunities if it breaks above! 🎯 Targets: 2353, 2355.
💡 Join the Conversation: 💡 Share your insights as we explore this dynamic market! 🎤 Let’s reach new milestones together! 🌟🚀

NQ1! - SELL
Looking very weak
Return to Previous Level Pattern clean Support
RSI Multi Indicator all Down
Ultra Metre All Red
Quick Scalp

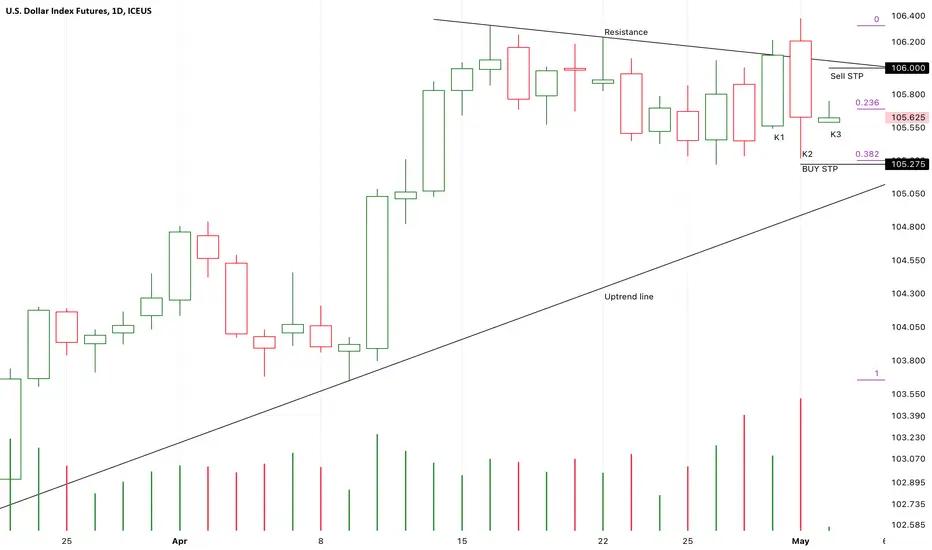
Chart Pattern Analysis Of DX1!
K1 and K2 is a strong bearish dark cloud cover pattern,
If the following candles couldn’t close below K2 to verify the strong momentum.
It will be a good place to buy here.
If the following candles close upon the resistance,
It is a second good place to buy in.
K2 is also a potential right top of a large scale bearish double top pattern.
If K3 rebound under low volume,
It will be a good place to sell it there.
Buy-105.5/Stop-105.3/-Target-110
SILVERI can see silver is up trend. Maybe it will take a week or more than that. Only for technical analysis. Note not yet fundamental analysis

ZM1! INTRADAY IDEAafter big bearish momentum last candle retracement will happen. Trading plan intraday looking for long around $363.8 and take profit about 40tick (green zone) or set break even SL. after that looking for short at zone (red box) to fullfill the imbalance/FVG candle TP at the swing low. TAYOR

gold possible H&S pattern?Hello traders once again. we see gold created an all time new high! for that being said we can see it 2 different scenarios playing out. We can see it as price made a new higher high and now we are looking for a higher low. Or its creating a H&S pattern where we still need the right shoulder to confirm this. I know this is the 6 month timeframe so this is long term analysis. drop a like if you agree. follow for more ideas. drop a comment if you see it playing out differently.

long on nas100Looking for a lower high to be made noting it went down a bit Im still thinking its gonna retrace and then keep going

Natural Gas Run To Continue?
Natural Gas futures have had a tremedous run from the basing action ending in a final test of the recently lowest sequence number 9. From here, prices have climbed significanly. Prices overextended recenty and now there is a consolidation, if not small pullback in progress.
A sequence count down of 6 might be such an entry point. Let's watch this unfold. There could be an interesting short-term bottom next week.

Gold has a strong bearish momentum, could it fall further?The Gold (XAU/USD) is rising towards the pivot which acts as a pullback resistance and could reverse from this level to the 1st support.
Pivot: 2,360.43
1st Support: 2,325.31
1st Resistance: 2,373.40
Risk Warning:
Trading Forex and CFDs carries a high level of risk to your capital and you should only trade with money you can afford to lose. Trading Forex and CFDs may not be suitable for all investors, so please ensure that you fully understand the risks involved and seek independent advice if necessary.
Disclaimer:
The above opinions given constitute general market commentary, and do not constitute the opinion or advice of IC Markets or any form of personal or investment advice.
Any opinions, news, research, analyses, prices, other information, or links to third-party sites contained on this website are provided on an "as-is" basis, are intended only to be informative, is not an advice nor a recommendation, nor research, or a record of our trading prices, or an offer of, or solicitation for a transaction in any financial instrument and thus should not be treated as such. The information provided does not involve any specific investment objectives, financial situation and needs of any specific person who may receive it. Please be aware, that past performance is not a reliable indicator of future performance and/or results. Past Performance or Forward-looking scenarios based upon the reasonable beliefs of the third-party provider are not a guarantee of future performance. Actual results may differ materially from those anticipated in forward-looking or past performance statements. IC Markets makes no representation or warranty and assumes no liability as to the accuracy or completeness of the information provided, nor any loss arising from any investment based on a recommendation, forecast or any information supplied by any third-party.
