Sold Nifty Below 23390 and Bought Above 23400-13th June '24Below mentioned points are discussed in my post analysis video(Fast forward to 0:39 for Hindi Audio)
-No Trades in the morning
-No Volumes in the Morning
-Sold Below 23390 and Bought Above 23400
-How will i trade when market opens tom
Futures market

GOLD ( PPI ) (INTIAL JOBLESS CLAIMS )XAUUSD
HELLO TRADERS
Tendency the price is under bullish pressure at 2,304 $
Turning level : The turning 2,304 $ , so as long as the price above this level, there will be a bullish trend
resistance level : the trading above the turning level 2,304 $ , the price will rise to 2,342 $ , price stabilize this level , there will be reach to 2,360 $ and 2,388 $
support level : The trading stabilizing below 2,304 $ , the price will reach the support level of 2,278 $ and 2,259 $
corrective level : price will attempt 2,304 $ , correct itself before rising
* today , we have some news PPI and INTIAL JOBLESS CLAIMS , In my opinion negative
for USD
I WISH YOU A PROFITABLE DAY

Gold price "like never before changed" after CPIWorld gold fee at the night time of June 12 is set 12.eight% higher (265 USD/ounce) in comparison to the give up of 2023. World gold fee transformed via way of means of financial institution USD fee is at 72.1 million VND/tael, along with taxes and fees, approximately four.eight million VND/tael decrease than the home gold fee as of overdue afternoon on June 12.
World gold charges soared because the USD plummeted after the United States introduced anticipated monetary information.
The USD opened the buying and selling consultation on June 12 at the US New York marketplace (at the night time of June 12, Vietnam time) losing very sharply. The DXY index (which measures the dollar`s fluctuations in opposition to six foremost currencies) at the start of the consultation fell to 104.four points, from the preceding degree of above one zero five points.
The USD dropped after the United States introduced that the patron fee index (CPI) in May cooled quicker than economists predicted. Accordingly, the United States CPI index remained unchanged after growing via way of means of 0.3% withinside the preceding April. Economists had formerly forecast an boom of 0.1%.
The falling dollar reasons gold charges to boom sharply.
Compared to the identical period, CPI accelerated via way of means of 3.3%. This continues to be excessive in comparison to the 2% goal of the United States Federal Reserve (Fed). However, it makes buyers much less concerned approximately the opportunity of fee inflation escalating again. The 3.3% degree is likewise a lot decrease than 6.5% on the give up of 2022 and 9.1% in June 2022.
In May, US center inflation (except meals and strength charges) accelerated via way of means of 0.2%, decrease than the forecast of 0.3%.
Gold fee forecast
On Kitco, Michael Brown, an professional from forex brokerage Pepperstone, stated the contemporary inflation information may want to alternate psychology on the Fed in advance of the agency's financial coverage decision.
Adam Button, head of foreign money approach at Forexlive, stated that once the inflation information, alerts from the marketplace confirmed that the Fed could have hobby fee cuts this year, with an 80% chance. The first cuts will take region in September.
This additionally approach that because the USD depreciates, gold will benefit.

Gold's alt view. 13/June/24XAUUSD possible wave counts. There will be more floor than ceiling so Shorting from swing high is better idea.

After CPI - Gold price returns to starting pointLast night time Gold had robust information however there wasn`t an excessive amount of movement. With Today's Price Trend and Model, I assume Gold will retain to Buy underneath the 231x Zone in line with the accrued factors of the Buyers. And Canh Sell Above the 233x quarter in line with the Trend Line in H4 and D1
> Please confer with modern-day buying and selling rate plan. Buy Gold round 2308>2312
SL 2300
TP 2325>233x
Watch Sell Gold withinside the location 2337>2340
SL 2342
TP 2330>232x
These are the rate stages I will look ahead to transactions. You can confer with and observe this framework to trade.

Gold Bullish MoveLiquidity grabbed, momemtum shifted bullish, price got to the support, bullish move started.
Got in early, but you can still look for buy setups.

Buy Gold Buy limit 2312
tp 2332
Sl2307
That’s my order for the day.
Good luck and trade with own caution!

Buy Gold Buy limit 2312
tp 2332
Sl2307
That’s my order for the day.
Good luck and trade with own caution!

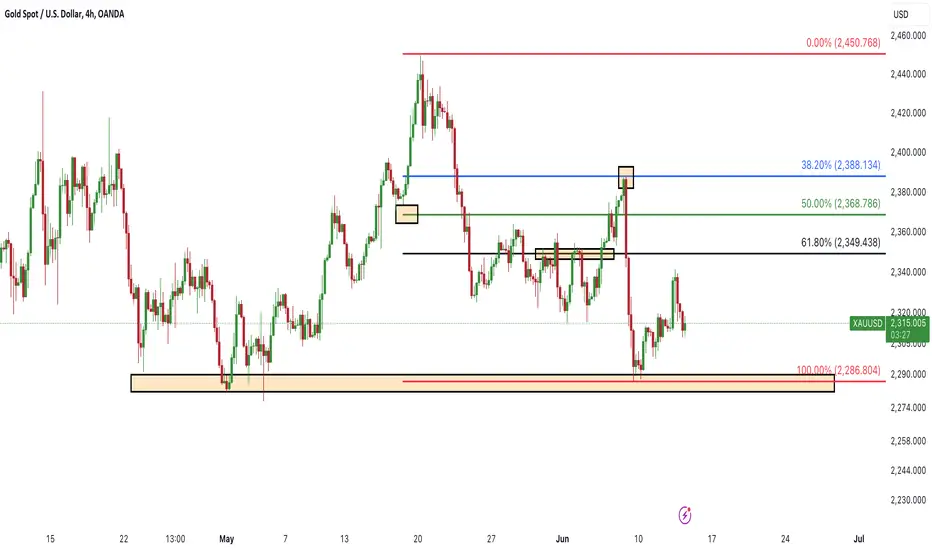
XAUUSDAll movements in the market are in harmony. Sometimes we see chaos in the market; maybe emotions cause this chaos, but this is not always the case. Look at the three golden Fibonacci zones in this chart, and the price reactions are like this: Note that the points are moving in beautiful harmony. The price and the range of 2390 are good support, and we saw the price hit this range several times, then we saw the price return and the failure of this area. I have nothing special to say about gold at the moment. Except that we have to wait for the next moves and news so that we can find a good place for trading. This is where we need to be patient.
USOIL Uptrend Line Breakout At $78.33 13.06.2024USOIL Uptrend Line Breakout: At $78.33
Bearish Scenario:
Target 1: $77.80
Target 2: $76.66 (if $77.80 breaks)
Bullish Scenario:
Target 1: $79.24
Target 2: $81.08 (if $79.24 breaks)
Apply Risk Management
Risk Warning: Trading in CFDs is highly speculative and carries a high level of risk. It is possible to lose all of your invested capital. These products may not be suitable for everyone, and you should ensure that you fully understand the risks taking into consideration your investment objectives, level of experience, personal circumstances as well as personal resources. Speculate only with funds that you can afford to lose. Seek independent advice if necessary. Please refer to our Risk Disclosure.
BDSwiss is a trading name of BDS Markets and BDS Ltd.
BDS Markets is a company incorporated under the laws of the Republic of Mauritius and is authorized and regulated by the Financial Services Commission of Mauritius ( FSC ) under license number C116016172, address: 6th Floor, Tower 1, Nexteracom Building 72201 Ebene.
BDS Ltd is authorized and regulated by the Financial Services Authority Seychelles (FSA) under license number SD047, address: Suite 3, Global Village, Jivan’s Complex, Mont Fleuri, Mahe, Seychelles. Payment transactions are managed by BDS Markets (Registration number: 143350)
Disclaimer

Platinum In a Bearish BAT PatternPlatinum In a Bearish BAT Pattern
The price completed a big bearish BAT Pattern signaling a bigger correlation
during the coming days.
The Bat pattern is a harmonic pattern which indicates the possibility for a correction after the bullish trend.
The first support zone is found near 1006 and the second zone near 940
You may find more details in the chart!
Thank you and Good Luck!
❤️PS: Please support with a like or comment if you find this analysis useful for your trading day❤️

XAUUSD SELL Looking to sell gold after the massive rise yesterday and the steady increase last few days we are looking for a sell off back down to fill the empty gaps

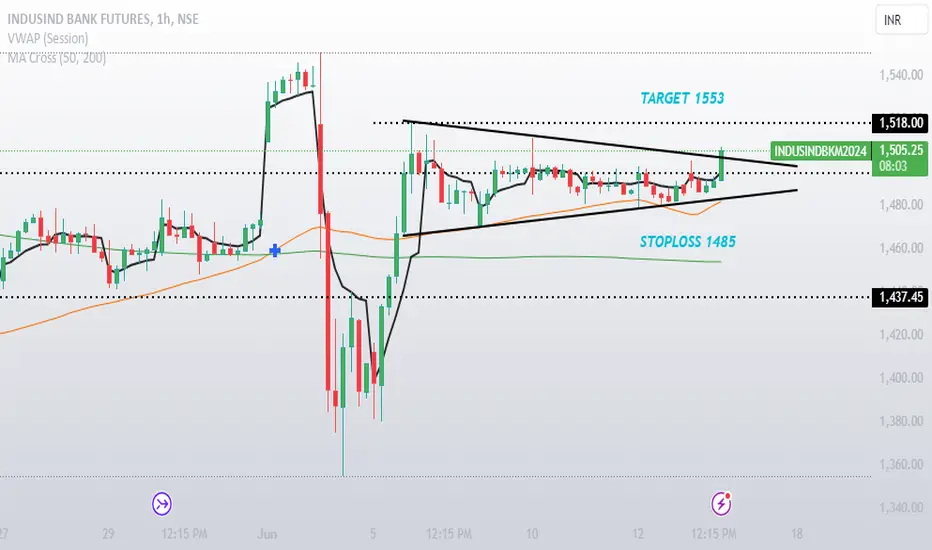
INDUSINDBANKINDUSIND bank fut broke out of triangle pattern on an hourly chart with good OI build up.
Risk:Reward = 1:3
Could be bought with mentioned stoploss & target.
Gold fell after the FED kept interest rates unchanged in June💥Gold prices (XAU/USD) gained positive traction for the third straight day on Wednesday and touched a new weekly high, around the $2,341-$2,342 region as US consumer inflation figures softened slightly.
💥Gold then fell sharply after data from the US Federal Reserve (FED) signaled there would only be one interest rate cut this year. in a context where inflation is still far from target.
💥The change in the Fed's forecast led to a slight increase in US Treasury yields, supporting the US Dollar (USD) after its overnight bounce from multi-day lows and further weakening prices. Yellow
💥Gold support is approaching at 2282. Gold prices could accelerate the decline after the $2,285 horizontal support is broken. That said, any further decline is likely to find some Support near the $2,300 mark before the $2,285 horizontal zone. Some further selling activity will be seen as fresh trigger for bearish traders and leave XAU/USD vulnerable to accelerating the decline towards the next relevant support near the $2,254-2,253 region. If gold trades above 2325 today, it will soon find higher levels such as yesterday's peak resistance area at 2340 and higher at 2355.

Demand for gold storage increases despite gold being at its peakHeadline inflation rose 3.3%. At the same time, core CPI, which excludes volatile food and energy prices, rose 0.2%, also below expectations; according to consensus forecasts, economists are expecting a 0.3% increase.
The report said annual core inflation rose 3.4%. While inflation remained above the Federal Reserve's 2% target, it fell from last month's 3.6% annual increase. Economists had expected an unchanged result...
The US Bureau of Labor Statistics said on Wednesday that the consumer price index (CPI) was unchanged last month after rising 0.3% in April. The latest inflation data was weaker than expected due to the Economists predict a 0.1% increase.

GOLD (XAUUSD): Classic Bearish Pattern
I spotted a strong bearish pattern on Gold on an hourly time frame.
After a strong bearish rally that initiated on Friday last week,
the market started a correctional movement within a rising channel - a bearish flag pattern.
A breakout of the support of the flag is a reliable bearish signal.
Probabilities are high that Gold will drop at least to 2295
❤️Please, support my work with like, thank you!❤️

XAUUSD:12/6 Today’s Analysis and StrategyGold technical analysis
Daily resistance 2340-70, support 2277
Four-hour resistance 2328-2340, support 2307-2277
Gold operation suggestions: Gold will continue to pay attention to the pressure near 2340 and 2370 during the day. As long as the market continues to run below this price, the overall structural trend will still be weak. Pay attention to the competition between long and short positions near 2277 during the day. Subjectively, we still expect gold to break this support again under the influence of fundamentals, bringing a new round of mid-line downward trend, but it is not easy to judge whether it can be established from a technical point of view. This requires attention to the impact of today's US CPI data and the Fed's interest rate decision.
Today, the lower support continues to focus on 2305-2307. If it falls back during the day, we will continue to be bullish. The upper pressure will be around 2328. Today, we will rely on this range to maintain high selling and low buying. In the short term, the gold price is expected to continue to exchange time for space to maintain the rhythm of wide range of fluctuations between bulls and bears. Before further breaking through the 2270 mark, we will maintain the range fluctuation approach.
SELL:2328 near SL:2331
SELL:2340 near SL:2345
BUY:2277 near SL:2274
Technical analysis only provides trading direction!

Bearish Gold Clear break of trendline with a reversal pattern double top at a key level leads us to believe that a day trade sell is possible as long as price retests and rejects the key level marked out then we can sell looking for the usual 1:1

Gold under Selling pressure as expectedFundamental analysis: Gold is on a decline following the absence of Fundamental non-stop Buying pressure and is seen Trading near #2,300.80 benchmark on a Daily chart’s Harami Bearish candle. This has given me a new Selling entry with the #2,338.80 entry point after yesterday's session Stop-loss hit. It is important to observe the market sentiment in general, if one is interested in Long-term Gold direction. Fed left the Rate unchanged as expected however CPI missed the estimate by wide margin. On the other hand, DX is and will remain my main point of interest, and strongest correlation asset regarding Gold market. Regarding Bond Yields traditionally, Gold was benefiting on Low Rates and every strong Bullish rally on Gold was followed by Low rates on Yields (remember All Time Low on Bond Yields at #1.09% in #2020 Year, Gold was Trading above #2,000.80 per ounce). However, as Low Rates times are most likely gone and matter of the past, I have been announcing strong Bearish cycle on Gold ahead which can test even #1,800.80 barrier on the Long-term.
My position: My yesterday's pre-CPI Selling order hit #10-point Stop-loss as CPI missed the estimates (downside surprise) however I have engaged two new Selling orders, one with #2,336.80 entry point and second with #2,329.80 entry point, both running in excellent Profit currently. I will close both orders as near as #2,300.80 benchmark and will re-Sell Gold below / when #2,300.80 gets invalidated. As I announced lately, no more non-stop over extended rises on Gold without firm explanation. Bear cycle has started which is perfect development I am utilizing for us (and will continue to do so).

Gold possible sellYesterday we took a swing trade for a sell and we're still holding, for this trade it will be taken on another account because of risk management, let's see how price goes today, always remember investing in the future requires one to think in probability, waited for liquidity to be created and cleared, now our entry limit have been activated

WTI Oil H4 | Potential bullish bounceWTI oil (USOIL) is falling towards a pullback support and could potentially bounce off this level to climb higher.
Buy entry is at 77.52 which is a pullback support.
Stop loss is at 76.30 which is a level that lies underneath a pullback support and the 38.2% Fibonacci retracement level.
Take profit is at 80.37 which is a multi-swing-high resistance that aligns close to the 50.0% Fibonacci retracement level.
High Risk Investment Warning
Trading Forex/CFDs on margin carries a high level of risk and may not be suitable for all investors. Leverage can work against you.
Stratos Markets Limited (www.fxcm.com):
CFDs are complex instruments and come with a high risk of losing money rapidly due to leverage. 68% of retail investor accounts lose money when trading CFDs with this provider. You should consider whether you understand how CFDs work and whether you can afford to take the high risk of losing your money.
Stratos Europe Ltd, previously FXCM EU Ltd (www.fxcm.com):
CFDs are complex instruments and come with a high risk of losing money rapidly due to leverage. 73% of retail investor accounts lose money when trading CFDs with this provider. You should consider whether you understand how CFDs work and whether you can afford to take the high risk of losing your money.
Stratos Trading Pty. Limited (www.fxcm.com):
Trading FX/CFDs carries significant risks. FXCM AU (AFSL 309763), please read the Financial Services Guide, Product Disclosure Statement, Target Market Determination and Terms of Business at www.fxcm.com
Stratos Global LLC (www.fxcm.com):
Losses can exceed deposits.
Please be advised that the information presented on TradingView is provided to FXCM (‘Company’, ‘we’) by a third-party provider (‘TFA Global Pte Ltd’). Please be reminded that you are solely responsible for the trading decisions on your account. There is a very high degree of risk involved in trading. Any information and/or content is intended entirely for research, educational and informational purposes only and does not constitute investment or consultation advice or investment strategy. The information is not tailored to the investment needs of any specific person and therefore does not involve a consideration of any of the investment objectives, financial situation or needs of any viewer that may receive it. Kindly also note that past performance is not a reliable indicator of future results. Actual results may differ materially from those anticipated in forward-looking or past performance statements. We assume no liability as to the accuracy or completeness of any of the information and/or content provided herein and the Company cannot be held responsible for any omission, mistake nor for any loss or damage including without limitation to any loss of profit which may arise from reliance on any information supplied by TFA Global Pte Ltd.
The speaker(s) is neither an employee, agent nor representative of FXCM and is therefore acting independently. The opinions given are their own, constitute general market commentary, and do not constitute the opinion or advice of FXCM or any form of personal or investment advice. FXCM neither endorses nor guarantees offerings of third-party speakers, nor is FXCM responsible for the content, veracity or opinions of third-party speakers, presenters or participants.

S&P500 correction loomsThe Fed has left us air on this year's rate cuts, and a weak majority of the Open Markets Committee is leaning toward a single cut, when in March there was a consensus for two. Powell has warned of the high level of uncertainty in the market to get carried away with the dot plot, a collection of economic, inflation, employment and interest rate forecasts obtained from the 12 Fed regions. The Fed remains uncertain about rates, but fortunately has not touched the current levels between 5.25% and 5.5%. And while they have agreed to a first rate cut, a second has not yet been fully ruled out. Basically, JPow is not getting wet and where he said I say, Diego says, since the institution is not sure of the current market situation, to take steps too far ahead. Although the Fed acknowledges modest progress towards the 2% inflation target, they continue to insist on the need for confidence to move to further cuts. Unemployment data and production indexes are not expected to be too positive, although the monthly production index is expected to be higher than the previous one.
S&P500 (Ticker AT: USA500) yesterday closed the session for the first time above 5400 points despite the Fed's expected policies. The S&P500 closed up +0.8% at 5,420 points after touching an intraday high of 5447.02. Nasdaq Composite closed up +1.5% and the Dow Jones Industrial Average closed down 35 points, -0.1%. Of note Oracle (NYSE:ORCL) rose +13% on the back of its partnership announcement with OpenAI and Google (NASDAQ:GOOGL) Cloud in its bid to extend its AI infrastructure, as well as showing a profit forecast for 2025. Rubrik (NYSE:RBRK) fell -8% despite the cloud data company showing an earnings beat. APPLE (NASDAQ:AAPL), meanwhile, continued its bullishness as it surpassed Microsoft (NASDAQ: MSFT) as the company with the highest market capitalization valuation after climbing +7% as it unveiled plans to delve deeper into AI.
On the other hand Bitcoin and the crypto sector have provided some gains causing shares of Coinbase (NASDAQ:COIN) , MicroStrategy Inc (NASDAQ:MSTR) and Marathon Digital Holdings Inc (NASDAQ:MARA) to close higher.
On the chart, the shape of the bell is very dispersed in three sub-bells, if we look at the current control point coincides with the current average zone is around 5,333 points. The RSI indicates that it is highly overbought at 72.65% and provides sell signals. The first support zone is located at 5,205 points and its second zone is located in the low zone at 4,963 points. It is not unusual for a correction to occur even though the market continues in its upward euphoria.
Ion Jauregui - ActivTrades Analyst
*******************************************************************************************
The information provided does not constitute investment research. The material has not been prepared in accordance with the legal requirements designed to promote the independence of investment research and such should be considered a marketing communication.
All information has been prepared by ActivTrades ("AT"). The information does not contain a record of AT's prices, or an offer of or solicitation for a transaction in any financial instrument. No representation or warranty is given as to the accuracy or completeness of this information.
Any material provided does not have regard to the specific investment objective and financial situation of any person who may receive it. Past performance is not reliable indicator of future performance. AT provides an execution-only service. Consequently, any person acing on the information provided does so at their own risk.
