GOLD (XAUUSD): Support & Resistance Levels For Next Week
Here is my latest structure analysis
and important support & resistance levels/zones
to watch and trade on Gold next week.
Consider these structures for pullback/breakout trading.
❤️Please, support my work with like, thank you!❤️
Futures market

USOil moving lower**Monthly Chart**
Last month candle closed bearish after testing the low of key reversal candle of the previous month and started moving lower. The next target on monthly is around 71 level and then 63 level respectively.
**Weekly Chart**
Last week's candle closed as a bearish key reversal suggesting a continuation of the downtrend move.
**Daily Chart**
USOil broke the relative equal high of the range with the creation of manipulation candles at around 80 levels. The next target is to break the soft level of supports around 75.50 level and move aggressively lower. A corrective move around 78.00 level is required to push the price lower. The next target is around the 72 to 70 level.

Corn,Price actions didnt hold up last week..Hello fellow traders , my regular and new friends!
Welcome and thanks for dropping by my post.
Turning bearish on this one..wheat could be as well..it seems like trying to push lower with the toppish pattern that you are seeing on h4...
Do check out my recorded video (in trading ideas) for the week to have more explanation in place.
Do Like and Boost if you have learnt something and enjoyed the content, thank you!
-- Get the right tools and an experienced Guide, you WILL navigate your way out of this "Dangerous Jungle"! --
*********************************************************************
Disclaimers:
The analysis shared through this channel are purely for educational and entertainment purposes only. They are by no means professional advice for individual/s to enter trades for investment or trading purposes.
*********************************************************************

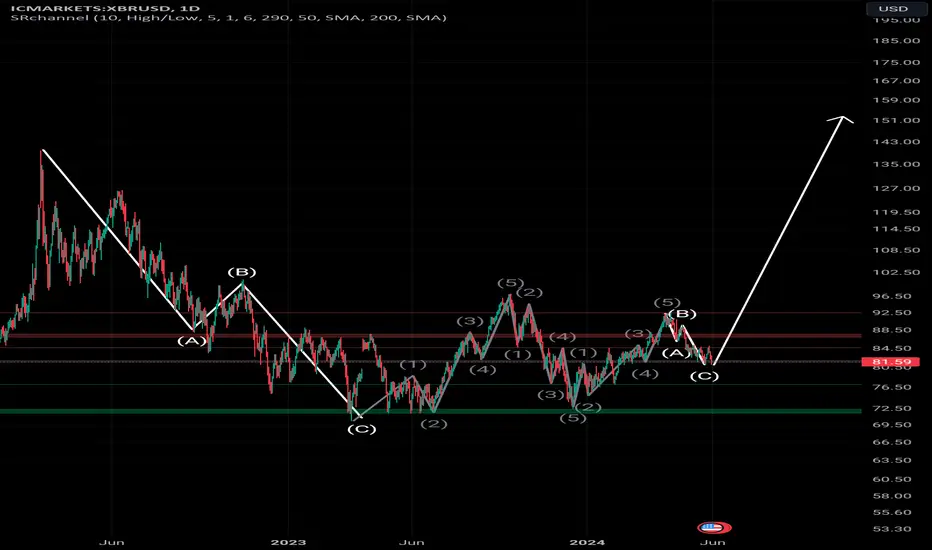
XBR USD SWING LONG ENTRYCrude oil has completed a 3 wave correction on the daily and also corrected on the h4. And will be seeing a higher highs from here breaking the resistance. It's important to note that this trade is high rr with small risk. I will be taking this trade few hours market open.
Let me know if you have any questions agree disagree I will be listening :)
Trade safe!
XAUUSD AnalysisPrice is now at the daily order block. Price will either continue holding support or break structure to start long term sell. Watch for liquidity in the zone.

ES1! big picture updateMy bullish count for ES1!. I have us in wave 3 of (5) of ((3)) of V.
It looks like wave 2 has completed. I expect ES1! to grind up the rest of the spring and summer, with target of ~6000 and the median line of the pitchfork drawn from COVID-19 low, January 2022 high and October 2022 low.


XAUUSD SHORT This is my analysis for GOLD. If you want to follow, strictly follow stop loss and secure profits.
Trade at your own risk!

Nasdaq $NQ EoM ReviewSimilar to ES, NQ has printed highs @ $19,023 before a minor retracement occurred.
Buystops in question: $19,023.25
Sellstops in question: $18,241.25

$XAUUSD - Monday Jun 03 - Range Filling Idea - 2300 TappingGold got to tap 2300.
Gold just tapped 2449 on the monthly and was mirroring the move from April.
Monthly Closed Bullish as Weekly and Daily closed Bearish.
The Daily Range We are at is 2327-2361, as we just tapped 2361 before Friday drawdown.
We got big news on Monday which should make a high volume price action.
That`s why i think we must see range breakout bullish nor bearish.
If we will break bearish we will definitely will tap at least 2300 before heading somewhere else.
If we will break bullish, we must have a liquidity grab before (tapping at lease 2300) before moving somewhere else.
That`s my i think both directions are pointing at 2300 tapping bullish or bearish.
This is Monday Sells for me - GL!

my bias for the upcoming weekFor me the market is bullish but it gonna retrace first then make the real move


USOIL: Bullish Forecast & Outlook
Remember that we can not, and should not impose our will on the market but rather listen to its whims and make profit by following it. And thus shall be done today on the USOIL pair which is likely to be pushed up by the bulls so we will buy!
❤️ Please, support our work with like & comment! ❤️

GOLD: Will Start Growing! Here is Why:
Balance of buyers and sellers on the GOLD pair, that is best felt when all the timeframes are analyzed properly is shifting in favor of the buyers, therefore is it only natural that we go long on the pair.
❤️ Please, support our work with like & comment! ❤️

Gold SilverNew Week - New 2 Week - New Month Range...
If the 180-90-45 doesn't give you a good answer one of the other 3 will

USOIL BEST PLACE TO BUY FROM|LONG
Hello,Friends!
Bullish trend on USOIL, defined by the green colour of the last week candle combined with the fact the pair is oversold based on the BB lower band proximity, makes me expect a bullish rebound from the support line below and a retest of the local target above at 78.53.
✅LIKE AND COMMENT MY IDEAS✅

NQ1 & SP1 W BLACKSWANNNNNN!!!!!!! GG USA & DOLARCME_MINI:ES1! TVC:DXY CME_MINI:NQ1!
This is my own opinion, for better or worse. God knows. From what I see, Nasdaq and S&P 500 are facing a very serious collapse. Keep this in mind if you want to open a big short position. You can see an example of a black swan pattern and my concept intersecting on the chart. If you ask me, the problem is significant, and the end of the dollar has come maybe ww3.

XAGUSD. Weekly trading levels 3 - 7.06.2024During the week you can trade from these price levels. Finding the entry point into a transaction and its support is up to you, depending on your trading style and the development of the situation. Zones show preferred price ranges WHERE to look for an entry point into a trade.
If you expect any medium-term price movements, then most likely they will start from one of the zones.
Levels are valid for a week, the date is in the title. Next week I will adjust the levels based on new data and publish a new post.
! Please note that brokers have a difference in quotes, take this into account when trading.
The history of level development can be seen in my previous posts. They cannot be edited or deleted. Everything is fair. :)
----------------------------------------------
I don’t play guess the direction (that’s why there are no directional arrows), but zones (levels) are used for trading. We wait for the zone to approach, watch the reaction, and enter the trade.
Levels are drawn based on volumes and data from the CME. They are used as areas of interest for trading. Traded as classic support/resistance levels. We see the reaction to the rebound, we trade the rebound. We see a breakout and continue to trade on a rollback to the level. The worst option is if we revolve around the zone in a flat.
Do not reverse the market at every level; if there is a trend movement, consider it as an opportunity to continue the movement. Until the price has drawn a reversal pattern.
Don't forget to like Rocket and Subscribe!!! Feedback is very important to me!

Gold 1-hour wave count updated: tracking green corrective wave f1-hour gold wave count: The rebound conditions were not met last night, insufficient energy, yesterday's daily chart closed with a shadow upper wick, the weekly chart with a small bearish candle, high probability of continued decline next week. Currently, it seems that the blue B wave rebound has ended at 2364, and the blue C wave decline is in progress. Keep an eye on whether it will be a 3-wave or 5-wave decline, to be continued next week. Always focus on the Fibonacci 0.382-0.5-0.618 correction levels of the green fourth wave. There will be an ending day, patiently waiting for the start of the green fifth wave.

GOLD SHORT POSITION SETUPFORTUNE'S OF BETLORD🤑
GOLD ANALYSIS✨✨✨
Final Sell before the next big uptrend again.
Cheers,
betlord.

CL - 8 Hrly - Weekly Forecast - 03 June 2024This is my weekly forecast of Oil for the week of 03 June 2024
We have closed below a key support level on the Monthly, so I now see this as bearish.
Looking to short at the daily inefficiency (FVG) for targets below liquidity lows.

Elliott Wave Rare Expanding Diagonal potentialwhen a diagonal pattern forms our structure changes to 3-3-3-3-3 instead of 5-3-5-3-5.
Im counting ABC zig zag formations in the first 3 waves which leads me to believe an ending diagonal pattern is taking place.
Im seeing wave 3 completed at 2432 area and because our trend line from wave 1 to 3 is expanding this gives us an indication of a deep wave 4 correction to expand the bottom trend line. In an expanding diagonal wave 4 must be bigger than wave 2
after Wave 4 we will have wave 5 that will break the highs of wave 3 and hit our upper trend line
After Wave 5 lookout for the crash where we could go as low as 1600 as after and ending diagonal price usually goes back to where the patten started.
This is long term analysis taking place over the next 6-12 months.
This is purely technical analysis not taking any war or interest rate decisions into account we are merely following the waves of the market
