XAUUSD REGULAR FLATKindly remember, Elliott Wave is highly subjective, i will post if there's a new update on my perspective.
Trade safe, Everyone!
Cheers.
Futures market

Double Bottom Pattern forming on 4hrBeware sellers, we can notice double bottom pattern forming on 4 hr and gold hasnt broken 200hr MA on 4hr as well, so target will be the gap at 2411.

Gold price-reversal head and shoulder in 15 min TFafter reversal head and shoulder in 15 min TF
the price make HH-HL. so i decided to wait the price pull back

XAU/USD SHORT IM LOOKING TO TACKLEXAU/USD 15M - I am looking to place a short position here with this market as price has traded us recently into a higher timeframe area of Supply and has shown signs of bearishness since.
What makes me believe this is a break in the last protected low you can see on the left side of this screenshot, that is the last protected low as that low created the highest high within that last bull run.
Wha we have seen now is price trade us back up to set a new lower high before what I think will be a new lower low. Its important we find areas that price may trade up and into in order to set a new lower high and this is an area I have in mind.
My reasoning for this is because there is an order block that I have marked out that was left unmitigated, what we have seen since price has traded into that order block is good rejection.
The trade itself is slightly pre-emptive with us not waiting for another fractal break but if we get taken out I will look to get re-introduced is price trades us up and into another OB slightly higher.

BANKNIFTY BANKNIFTY closed inside va
1.gapup 49200 long till 49400
2.49200-48900 trade breakout
3. Gapdown 48900 short

Crude oil - rangebreakingBoth Brent and WTI continue to frustrate investors. Last week saw both contracts break below significant support in a move which suggested further weakness to come. But prices reversed sharply and rallied back above resistance yesterday, signalling the likelihood of a breakout through the top of a range which has been building since the beginning of this month. Yet having smashed through resistance, crude reversed direction again, pulling back from Wednesday's month-long high, and dropping back into its rough trading range. What to make of it all? As noted yesterday, this market has form when it comes to wrongfooting traders, and there’s no reason why that shouldn’t continue to be the case. The market has repeatedly shrugged off geopolitical concerns, but remains unsure of the outlook for future demand growth. In this regard, there is considerable uncertainty about the state of China’s economy, and how that will affect crude imports. At the same time, there are worries about how the US economy will perform now that the Federal Reserve has forced the market to dial back its interest rate cut expectations. Add in this weekend’s OPEC/OPEC+ meetings and volatility is perhaps the only thing traders can take to the bank.

NATGAS - Time for a pullback? There is a high possibility we are going down on the GAS
Technicals
1. We closed on a doji on the weekly
2. We have been pumping strong lately, and the charts are screaming for a pullback
3. We came to a key .618 FIB retracement level
4. I see a zone here which can act as a major resistance.
Trade
Looking for a position for a sell this week!.
Great trading all of you
& remember to always trade with caution and a plan :-)
Greetingz,
Simba Trades

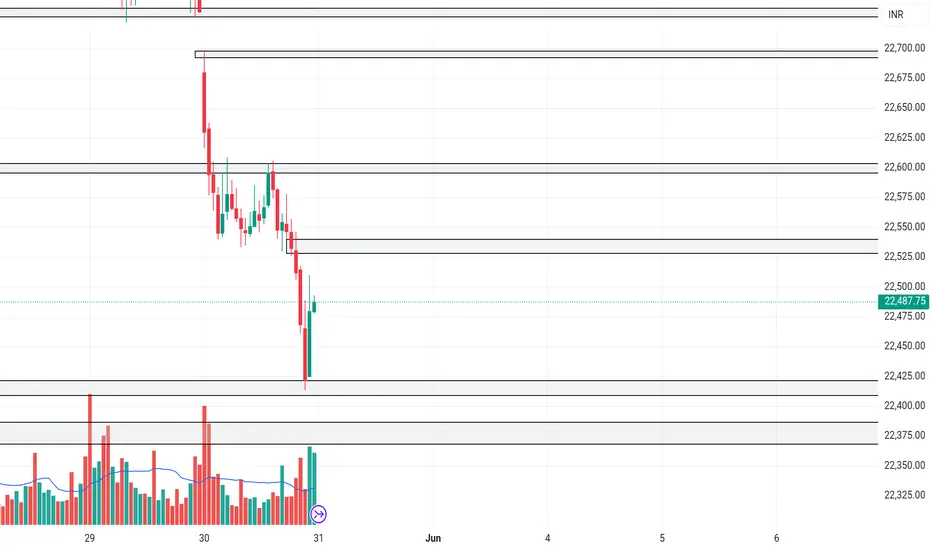
NIFTYNIFTY closed below va
1. gapup 22550 long till 22600-22700
2. 22550-22350 trade reversal
3.gapdown 22350 short
GOLD - at his major area, hold or not?#GOLD.. well guys market perfectly hold you area 2339 and grind further highs.
Now market thave 2349 50 as current resistance level on chart.
Keep close it and manage your portfolio accordingly.
Feel free to ask anything..
Good luck
Trade wisely

GOLD in a FVG GOLD is in a bulish fvg if a 1to3 candlestick confirmation will be formin on 5 or 15 min TF i ll entry i just see if is gonna respect it or not

GOLD: Will Start Falling! Here is Why:
Remember that we can not, and should not impose our will on the market but rather listen to its whims and make profit by following it. And thus shall be done today on the GOLD pair which is likely to be pushed down by the bears so we will sell!
❤️ Please, support our work with like & comment! ❤️

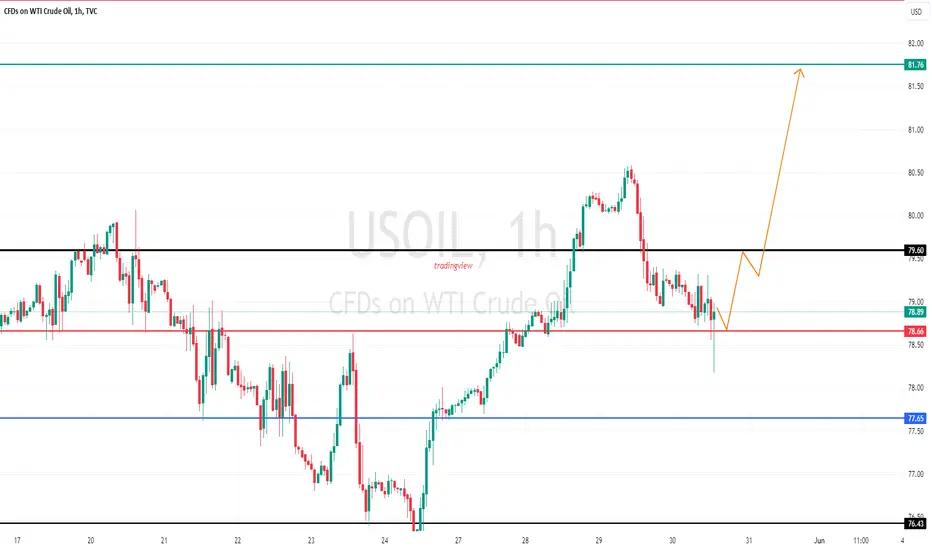
USOIL - where is current support? holding or not??#USDOIL.. market placed 80 plus day high and dropped again . now market have a supporting area here,
keep close it because if market hold it then again bounce expected from here,
don't be lazy here.
good luck
trade wisely

2024 : XAMD PROFILE?There has not been any drastic movement from April until today.
The possibility of this phase is Accumulation. if this phase is accumulation. this means that the next phase is Manipulation followed by Distribution.
However, any movement will change according to price conditions
This is just an analysis. All risks are your own responsibility

tech is going uptoday we have touch the bottom part of a range.
we are going up.
entry in blue. target in green.
stop in red.
have fun
Eleketra 33


XAUUSD 30-05Pair : XAUUSD ( Gold / U.S Dollar )
Description :
Bullish Channel as an Corrective Pattern in Short Time Frame with the Breakout of Lower Trend Line
CHoCH
RSI - Divergence
Completed " 12345 " Impulsive Waves
Break of Structure

CU CopperPair : CU - Copper
Description :
Break of Structure
Consolidation Phase in Short Time Frame
RSI - Divergence
Demand Zone
Completed " 12345 " Impulsive Waves

Idea for Gold @ 30th May 2024As previous analysis, we sell from the top
and add multiple positions, let's wait for wave A of sub-wave 5 completed,
then catch the next bullish wave B of abc correction
This wave A we've catched around 10000 pips from the top to current price with multiple positions, you can check my previous free analysis
This analysis is my current insight!

SOYBEANS FUTURES POTENTIAL LONG OPPORTUNITY Hey everyone! Hope you are having an absolutely amazing week so far! I just wanted to get on here and leave a post about Soybeans futures contracts to give all my potential fellow traders of all markets some good analysis! So let's dive in!
OK so when looking at the soybeans futures you can see that recently in the last couple months a couple things have happened that have led me to believe for another potential upside push in soybean prices. When looking at the charts you can see prices coming down for some time...multiple months. And then when price had reached the $1,130 zone something had actually happened. We had seen a failure to move lower in price (showing increase in demand) followed by new multi-month highs leading to $1,240-$1,245 in price...beating even the 2024 January highs so far. Now prices haven't fully held beneath those highs yet. But with price showing the buyer interest it has with the strong momentum which = interest in this commodity. Alongside all the technical confluences we have seen in price. I think we can definitely see a reaction from demand around $1,175 if not a new push to upside supply around $1,280 price handle.
SO keep an eye out on soybeans futures may see some potential to the upside. Also watch the seller momentum as it comes down into demand. We do not want to be trading if seller shows too much dominance (momentum) coming into our level. Remember we want to trade with the big boys not against them.
Cheers! Please boost this post and follow my page for more multi-asset analysis! God Bless!

XAUUSDXAUUSD just entering the bullish trend broke the last LH and made first HH
Bullish divergence also form in RSI.
We didn,t wait buy at CMP

Thursday Forecast Crude!So my target for this week will be the weekly open.
Simple as that sounds we do have some bsl above however Im expecting price to deliver BEARish as per HTF and the rejection for the Daily FVG
Be aware that trading is light we are in the last couple of days of the Month.

A Neutral Market Outlook in XAUUSD Hello there,
In XAUUSD, if the price breaks above the high then the price will be potentially bullish, and if it breaks below the low of the high then the price will be bearish.
RSI values indicate more bullishness in the candle, but the argument is based on that the trend has been forming lower highs for that reason the price is neutral.
Happy Trading,
K.
