1/3 ADR acted as resistance on NQToday on NQ we've seen beautiful Market Maker Sell Model based of PD Arrays + ADR,
ADR most of the time act as support / resistance and also we can target opposing ADR/AWR/AMR.
Futures market

XAUUSD Analysisregarding gold, we had a break out for the down trend and active sequence on 30 minutes frame, I'm waiting for correction to the supply zone to go long

Gold price-reversal head and shoulder in 15 min TFafter reversal head and shoulder in 15 min TF
the price make HH-HL. so i decided to wait the price pull back

WTIOIL SELLUsoil looking for more sell side momentum let's short oil 🛢
Fix your Stop-loss and TP anytime spikes will I've the results trail your SL every 30 pips
Survive safely

GOLD: Will Start Falling! Here is Why:
Remember that we can not, and should not impose our will on the market but rather listen to its whims and make profit by following it. And thus shall be done today on the GOLD pair which is likely to be pushed down by the bears so we will sell!
❤️ Please, support our work with like & comment! ❤️

GOLD in a FVG GOLD is in a bulish fvg if a 1to3 candlestick confirmation will be formin on 5 or 15 min TF i ll entry i just see if is gonna respect it or not

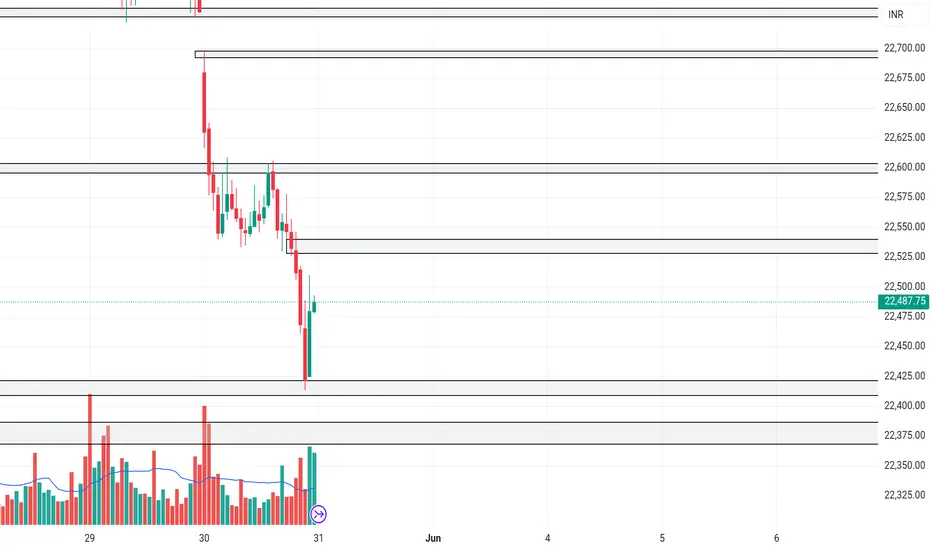
NIFTYNIFTY closed below va
1. gapup 22550 long till 22600-22700
2. 22550-22350 trade reversal
3.gapdown 22350 short
GOLD - at his major area, hold or not?#GOLD.. well guys market perfectly hold you area 2339 and grind further highs.
Now market thave 2349 50 as current resistance level on chart.
Keep close it and manage your portfolio accordingly.
Feel free to ask anything..
Good luck
Trade wisely

USOIL - where is current support? holding or not??#USDOIL.. market placed 80 plus day high and dropped again . now market have a supporting area here,
keep close it because if market hold it then again bounce expected from here,
don't be lazy here.
good luck
trade wisely

Double Top on XAG/USD @ D1This double top pattern has formed on the daily chart of the XAG/USD pair (Silver) following a rather long bullish trend. It can be used as a downside breakout setup. The two tops are marked with the upper yellow line; the neckline is marked with the lower yellow line. My potential entry level is at the cyan line (10% of the pattern's height below the neckline). My potential take-profit level is at the green line (100% of the pattern's height below the neckline). My potential stop-loss is not shown on the chart and will be set to the high of the breakout candle or to the high of the preceding candle if the breakout one trades mostly outside the pattern's borders. I won't be trading a bullish breakout from this trend-reversal pattern.

my bias for the upcoming weekFor me the market is bullish but it gonna retrace first then make the real move

Gold Trading Plan Weekly 6/1/2024Gold didn't close the month with red candle. There is still potential for rising.
But it needs to touch the broken resistance around 2160.
I will still expect falling wedge (triple top) formation on weekly for month of June, if next week close at green bar.
Expect falling then rising for Gold next week.

GOLD TREND ANALYSIS NEXT WEEKFrom the daily chart, after the US market experienced a wash-out trend on Friday, the direction and space of gold have been opened, showing an obvious weak and volatile trend. A triple top was formed near 2360. Multiple pressures from above may suppress gold bulls again. At present, there is a great possibility of a sharp decline. The support below will first focus on the competition near the daily low of 2320. If it breaks effectively, it may fall again to the previous low of 2309 or even the 2300 mark. The daily level this week belongs to the consolidation and correction after the decline. The weak rebound in the first two trading days did not have much room. The price encountered resistance at 2360, and the rebound above the middle track was difficult to continue. In the second half of the week, the market fluctuated and fell, and the pressure of the middle track was obvious. The low point gradually broke down to 2325-2320. MACD formed a dead cross, and the green column continued to increase in volume. Next week, we will continue to maintain the idea of shorting at a high level.
From the 4-hour chart, after hitting 2360, the gold price has fallen back to 2330 for consolidation. Although the price is still running above the lower track of the Bollinger Band, the 5-day moving average and the 10-day moving average, as well as the middle track of the Bollinger Band, have turned downward, which undoubtedly suppressed the upward momentum of the bulls. In addition, the MACD indicator maintains a dead cross, the green column potential begins to increase, and the KDJ dead cross runs downward. The overall 4-hour level should be dominated by shorts.
Overall, gold is about to break the box and oscillate, and start a large unilateral downward trend. Although the oscillation is uncomfortable, it is about to end and usher in a trend market. I suggest relying on the suppressive effect of the 4-hour mid-range track on gold prices to go short, and it is expected to rebound to around 2340 to go short. This wave of rebound is difficult to touch the daily mid-track. Once it does, it will plummet in a straight line, which is very stressful. Even the 2340 support level, which is difficult to fall below during the day, has been broken, and now it has become a good position to stop short sellers. At present, the 50-day moving average continues to move downward, and at the same time presents an obvious double top pattern. The high-altitude strategy is still the first choice. The daily level is still on the edge of the cliff. Be prepared to welcome new support at the 2300 level next week.

Another drop for goldHi traders,
Last week XAUUSD made the correction up.
So after the finish of the correction next week we could see another drop to finish the bigger complex pullback.
Let's see what price does and react.
Trade idea: Trade sells after a correction up and a change in orderflow to bearish on a lower timeframe.
If you want to learn more about trading with ICT/ SMC concepts and wave analysis, please make sure to follow me, give a like and respectful comment.
This shared post is only my point of view on what could be the next move in this pair based on my analysis. I do not provide signals.
Don't be emotional, just trade!

The ONLY Strategy You Need to Identify The Market Trend
In this article, we will discuss a proven price action based way to identify the market trend .
❗️And let me note, before we start, that no matter what strategy do you use in your trading, you should always know where the market is going and what is the current trend . Your judgement should be based on strict and objective rules that proved its accuracy.
There are a lot of ways to identify the market trend. One of the simplest and efficient ones is price action based method .
This method relies on impulse legs .
The market never goes just straight up or down, the price action always has a zigzag shape with a set of impulses and retracements.
The impulse leg is a strong directional movement , while the retracement is the correctional movement within the boundaries of the impulse.
UPTREND
📈The market is trading in a bullish trend if 3 conditions are met:
1️⃣the price forms an initial bullish impulse ,
2️⃣ retraces , setting a higher low ,
3️⃣then starts growing again and sets a new high with the second bullish impulse .
Once these 3 conditions are met, we consider the market to be bullish, and we expect a bullish continuation in such a manner.
Take a look at a price action on USDCAD. According to the trend-analysis rules, the pair is trading in a bullish trend.
DOWNTREND
📉The market is trading in a bearish trend if 3 following conditions are met:
1️⃣the price forms an initial bearish impulse ,
2️⃣ retraces , setting a lower high ,
3️⃣then drops lower and sets a new low with the second bearish impulse .
Once these 3 conditions are met, we consider the market to be bearish, and we expect a bearish trend continuation.
According to the rules, NZDUSD is trading in a bearish trend on the chart above.
CONSOLIDATION
➖The third state of the market is called consolidation . The market is trading in a consolidation if the conditions for bullish or bearish trend are not met . The price chaotically forms bullish and bearish impulses, usually trading within the range .
Above is the example of a sideways, consolidating market, where the price sets equal or almost equal highs and lows and conditions for bullish/bearish trend are not met.
Knowing the current trend, one always knows whether a current trading position is trend-following or counter trend, or it is a sideways consolidation trade.
Learn these simple rules and try to identify the market trend with them.

XAGUSD : a cup and handle on the logarithmic monthly chart.
The logarithmic chart of XAGUSD with three-month candles highlights a classic "Cup and Handle" formation, which is typically a bullish continuation pattern, indicating a strong likelihood of long-term price appreciation.
The cup formation is evident with a rounded base that began in the 1980s, peaking in 2011 near $50. The subsequent correction has formed the rounded part of the cup leading up to the present.
The market currently appears to be forming the handle, characterized by a lateral consolidation or slight downward movement before a potential bullish breakout.
Support and Resistance Levels
- Key Support: Immediate support levels are around $26.75,28$ and $30.47.
- Key Resistance: Major resistance levels to watch are around $34, $35.43, $40.28, $44.29 and $47.60.
Price Projections
Based on the "Cup and Handle" pattern and technical analysis:
- Short-Term Projection (1-2 years): After breaking out from the handle, silver could test resistance levels around $40-$45.
- Medium-Term Projection (2-5 years): Continued bullish momentum could drive prices towards $60-$70.
- Long-Term Projection (5-10 years): Given the historical pattern and fundamental support, silver could potentially reach $150-$300 per ounce, aligning with the upper trajectory shown on the chart.
Fundamental Analysis
Global Economic Conditions:
- Economic Growth and Recession Risks: Silver demand as a safe-haven asset increases during economic instability or recession. Current projections indicate growth for Central Europe, but Western Europe, especially Germany, faces industrial production declines and persistent economic challenges. The global economic outlook remains uncertain, with sub-trend growth in many advanced economies due to restrictive monetary policies aimed at controlling inflation.
- Inflation and Monetary Policy: High inflation is a critical factor affecting silver prices. Central banks, including the U.S. Federal Reserve, maintain restrictive monetary policies to combat inflation, influencing commodity prices like silver. As inflation moderates, potential interest rate cuts could positively impact silver prices.
Geopolitical Factors:
- Geopolitical Tensions: Silver prices respond to geopolitical events, increasing market uncertainty and demand for safe-haven assets. In 2024, potential conflicts and heightened tensions between major economies such as the U.S. and China, and ongoing conflicts in Europe and the Middle East are significant factors.
- Trade Wars and Tariffs: Trade tensions and tariffs disrupt global economic stability, influencing silver prices. Significant developments in U.S.-China trade relations or other major economic policies can shift investor sentiment towards commodities like silver.
Growing Demand for Silver
- Industrial Demand:
- Photovoltaic Cells: Silver is a key component in photovoltaic (PV) cells used in solar panels. The demand for silver in this sector has been growing significantly. In 2021, the solar industry consumed approximately 105 million ounces of silver. With the increasing focus on renewable energy, this demand is projected to grow by 8% annually, potentially reaching 140 million ounces by 2030.
- Electronics and Automotive Industries: Silver is extensively used in electronics due to its superior conductivity. The automotive industry, particularly with the rise of electric vehicles (EVs), has also increased its silver consumption. The EV market alone is expected to consume around 55 million ounces of silver annually by 2030, up from approximately 45 million ounces in 2020.
- Medical Applications: Silver’s antibacterial properties make it valuable in medical applications. The medical sector's demand for silver is projected to grow by 6% annually, driven by increased use in medical devices and coatings.
Energy Markets
- Correlation with Oil Prices: The correlation between the U.S. dollar and oil prices is notable. As the U.S. becomes a net energy exporter, shifts in oil prices due to geopolitical and policy changes impact broader commodity markets, including silver. Higher energy prices can increase production costs for silver mining, potentially reducing supply and driving prices up.
Conclusion
The formation of a "Cup and Handle" on the XAGUSD chart indicates significant long-term bullish potential. Supported by robust fundamental factors such as economic uncertainty, persistent inflation, geopolitical tensions, and growing industrial demand, silver could see substantial price appreciation in the coming years.
For detailed analysis and regular updates, continue following my posts on TradingView.

Gold next week analysis and trading advice!On Friday (May 31) in the United States trading hours, after the United States April core PCE indicator showed a slowdown in inflation, gold prices once touched the $2,360 mark and then rose and fell. It's currently trading at $2,330, and swap traders are still betting the Fed will cut rates at least once this year. Data from the Chicago Mercantile Exchange's FedWatch tool suggest there is little chance the Fed will cut rates before September, with a 50/50 chance of a rate cut in September. Friday's US personal consumption expenditure (PCE) data for April could further influence interest rate expectations and thus gold prices. The PCE is the Fed's preferred inflation measure, so it tends to carry more weight. Although as several analysts pointed out, the release of the data was fairly predictable, as it came on the heels of the CPI and PPI releases in the same month. Still, small deviations from expectations can produce volatility.
Gold is about to break the box shock, is about to open a big unilateral downward trend. The shock is the worst, but it will be over soon, and we will have spring. At this time, rebound high altitude such as the break is the best choice, my point of view is to rely on the 4 hours of the medium track on the gold price of the trend short, is expected to rebound 2340 short. This wave of rebound can not touch the daily line of the middle track, touch a straight fall, the pressure is really great, even breaking the support below, even the 2340 support level that does not move during the day has fallen below, and now it has become a good position to block bears. In summary, next week's gold short-term operation ideas suggest that the callback is mainly based on the above short-term focus on 2340-2343 resistance, below the short-term focus on 2318-2320 support,
Next week Gold recommendation: Step back near 2318-2320 long stop loss 2313 target 2345


Plans GOLD for the first week of JuneThis week gold will revolve around 2 price zones 2360 - 2300
SELL zone 2360 - 2362 SL 50pips TP 100-200-300pips
BUY zone 2305 - 2032 SL 50pips TP 100-200-300pips

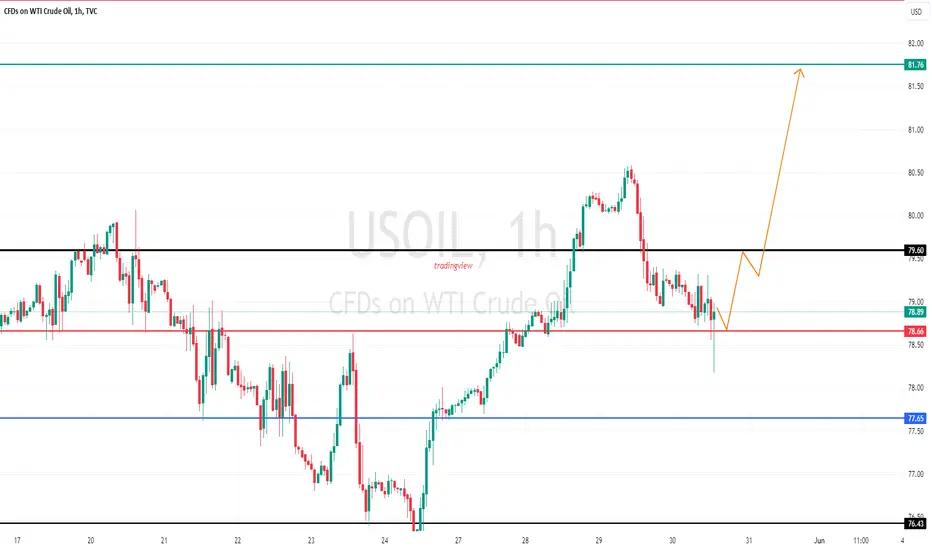
USOIL: Bullish Forecast & Outlook
Remember that we can not, and should not impose our will on the market but rather listen to its whims and make profit by following it. And thus shall be done today on the USOIL pair which is likely to be pushed up by the bulls so we will buy!
❤️ Please, support our work with like & comment! ❤️


GOLD: Will Start Growing! Here is Why:
Balance of buyers and sellers on the GOLD pair, that is best felt when all the timeframes are analyzed properly is shifting in favor of the buyers, therefore is it only natural that we go long on the pair.
❤️ Please, support our work with like & comment! ❤️
