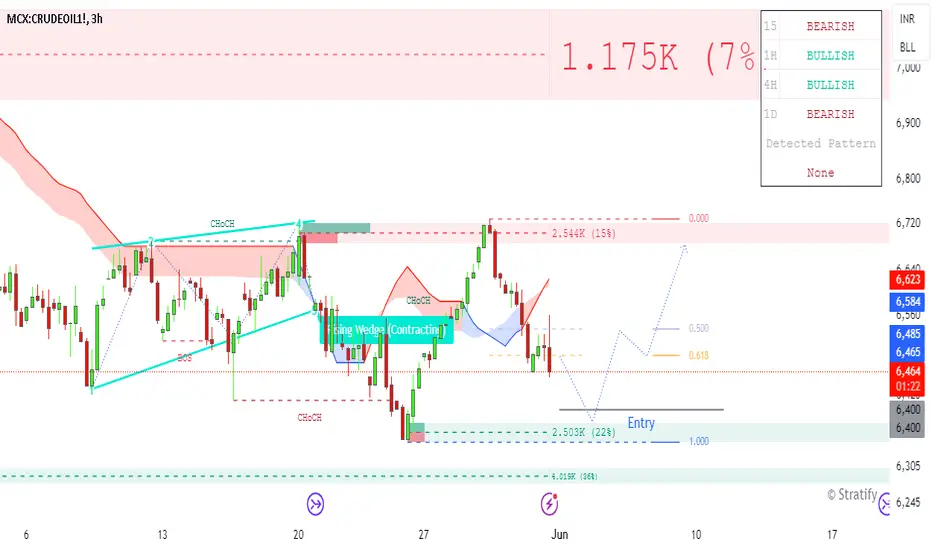
CRUDEOIL Buy Setup 3 hrs TGT with in a 3 daysSuper valid-looking! Leave a comment if you like my entry setup. This share is for educational learning purposes only, and I am not responsible for your profit or loss. Note: For more details, check the chart."
Futures market
XAUUSD: 30/5 Analysis and Strategy TodayGold technical analysis
Daily resistance 2370, support below 2300
Four-hour resistance 2343, support below 2300
Gold operation suggestions: Yesterday, gold technically came under pressure at the 2363 mark in the Asian and European sessions, and fell back and bottomed out. It showed a unilateral short-selling decline throughout the day. The weak rebound in the US session came under pressure at the 2347 mark and fell again. The overall price ushered in short-selling pressure adjustment at the 2360 mark, and the short-term technical indicators still showed a weak short position. From today's perspective, there is still an expectation of further downward decline in gold.
The upper resistance of the intraday rebound focuses on the opening of the US hourly line yesterday, 2347-2350. The intraday rebound relies on this position to continue the main short and follow the trend to look down. The short-term long and short strength watershed focuses on the 2370 mark. Before the daily level breaks through and stands on the 2370 line, any rebound is a short-selling opportunity, and the main tone of participating in the trend is maintained.
SELL:2370 near
SELL:2360 near
SELL:2347 near
BUY:2303 near
Technical analysis only provides trading direction!

GOLD - Not the time for long yet05.03.2024 - Gold printed a very mild DCL on day 57.
Today is day 20 in the new daily cycle . Though this daily cycle run to new all time highs price was not able to stay above 2433$...
It seems we are forming a double top and the double top's neckline is pulling down the price like the magnet at the prevoius DCL ( 2277$)
After the 2 -day-drop this week we printed a bear flag what broke down yesterday. Buyers are trying to buy every dip but the bounces are not holding for too long just like today.
First we are going to tag the trendline and the 50 EMA at 2310 and when this breaks it will trigger a very fast move to the neckline at 2277$.
Notice how RSI dropped to oversold levels on day 11-12... If this happens early in a daily cycle is not a good sign : it predicts further decline.
We have around 20-30 days from today to complete this daily cycle and the 2 possible targets are :
1. 2200-2150 $ ( 03.08-03.25 consolidation)
2. a backtest of the breakout at 2080-2083$.
Don't forget if it's an ICL the 5-6 day RSI will get oversold and stay oversold for days....

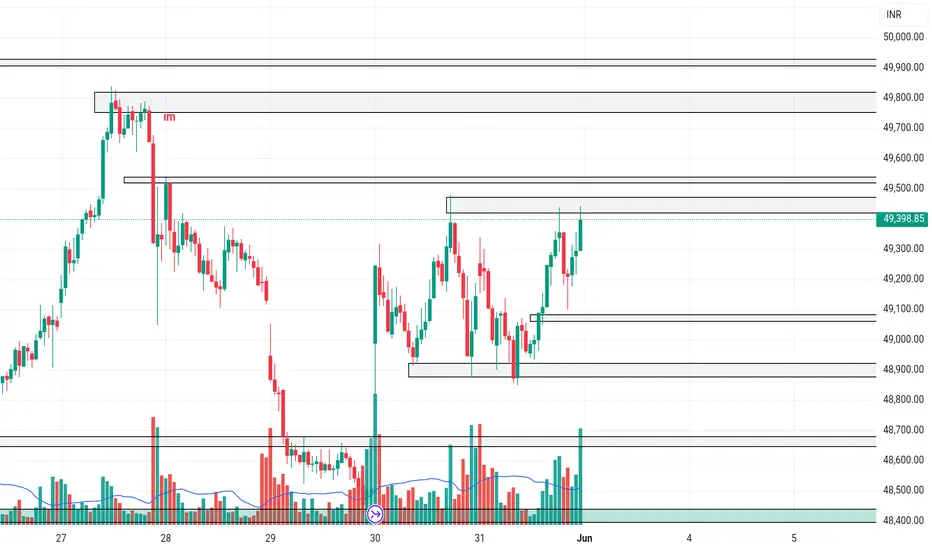
BANKNIFTYBANKNIFTY closed above va
1. gapup 49550 long till 49800
2. 49550-49100 trade reversal
3. gapdown 49100 short
NQ - trading session no.154:00pm - 5:00pm
learned some stuff today but overall it was a good session
- dont only have a bullish bias - it can still go down you dipsh!t
- just because its a small candle/ small SL it doesnt mean its a bad trade
PnL: -1 RR (its a part of the game)


basic strategy short prior support long prior resistanceif prices goes up and touches a prior support (most of the time from prior day) then its time to short
so either use the swing indicator or draw your self the 30 min swing points
if you missed the 18500 short today, monday will most like have a rally up to this level
but in order to with max amount long there needs to be now first a new high and then a price to go back to this new high point to have a solid support level for the next uptrend...

USOIL (Continuation falling)Oil prices increased early as we mentioned, recovering from a six-week low after a significant 4.3% fall the previous day, which was the lowest point since mid-March. This drop was attributed to an unexpected surge in U.S. stockpiles, indicating softer demand than anticipated.
At the same time, market observers have pointed out that the Federal Reserve has kept interest rates steady, diminishing earlier expectations for a rate cut. PVM Oil Associates commented, "The reduction in borrowing costs may not occur as soon or as quickly as previously thought. It is similar to peak oil demand—consistently anticipated yet never realized."
Technically:
The price has stabilized within the bearish zone, having already breached the pivotal range between 80.73 and 82.24. This suggests a continuation of the bearish trend, with potential targets at 76.80 and 75.35. A further break below 75.35 could lead the price down to 69.78.
Conversely, if the price stabilizes above 82.24, it may indicate a bullish trend, potentially reaching up to 86.86.
Pivot line: 78.00
Support lines: 76.80, 75.35, 69.78
Resistance lines: 80.73, 82.24, 86.86

NQ Daily Idea 5.30.24.....my usual setup....dropped in our Futures Group. Coming off a month long time away from the team. Solid play for day and into last day of the month

NQ Daily Idea 5.30.24.....my usual setup....dropped in our Futures Group. Coming off a month long time away from the team. Solid play for day and into last day of the month

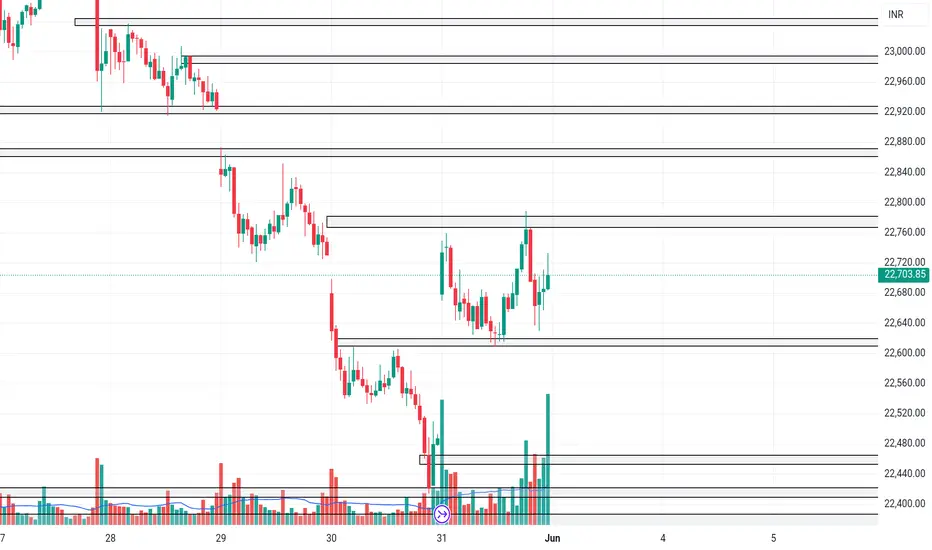
NIFTYNIFTY closed inside va
1. gapup 22780 long till 22880
2. 22780-22620 trade reversal
3. gapdown 22620 short till 22480
XAUUSD UPDATE 31-5-24Buy at :$2320-$2335🔺
Sell at" $2360-$2375🔻
The price of gold hovers close to $2,330, maintaining its position following a marginal decrease on Thursday. The momentum of the US Dollar shows signs of diminishing, lending support to the downside of gold. Market participants are keeping an eye on forthcoming US economic indicators and speeches from the Federal Reserve for insights into policy direction. During Thursday's Asian trading session, gold experienced a decline due to the strengthening of the US Dollar and an increase in US yields. Traders are awaiting the release of US Core Price Index and closely monitoring geopolitical tensions in the Middle East to gauge market sentiment.
As predicted, the buying range of $2325 was achieved earlier on 30-5-24 at 10:00 hrs, followed by a correction to $2340.96
cmp $2349.56 31-5-24 at 18:06 hrs

Gold Trend Analysis on May 30th
The gold daily line ended with a long negative line with a slightly longer lower shadow, which shows that the downward trend of gold is clear. Today is undoubtedly bearish, Therefore, we gave a short strategy of 2337 to our internal members in the morning session and entered the market to short sell in batches. The market is also as expected, rebounding to around 2340 in the short term and then began to fall.
From the daily line, yesterday, gold was under pressure at the 2363 mark during the Asian and European sessions and then fell back, oscillating downward and breaking the bottom, showing a unilateral short-selling decline throughout the day. During the evening US session, the weak rebound continued to weaken after being under pressure at the 2347 mark. In the end, the daily K-line closed with a suppressed and falling middle Yin. The overall price ushered in a short-selling adjustment above the 2360 mark as expected, and the short-term technical indicators still showed a weak short-selling adjustment. From today's point of view, there is still room for further downward decline below gold.
After the current low point of gold, the daily level is adjusted, and the 4-hour, 1-hour and 30-minute levels are all in a downward structure. Only the small levels of 15 minutes and 5 minutes will have a short-term rebound of 8 or 10 US dollars. Gold rebounded after testing the 2322 area in the European session. Pay attention to the short-selling opportunities in the 2337-2338 pressure area, and pay attention to the 2342 area. Continue to look at the 2320-2315 line below. The market fluctuates greatly. The 2300 US dollars and 2280 US dollars can be seen below the midline.
Overall, in terms of short-term operation ideas for gold today, it is recommended to short on rebounds and to buy on pullbacks. The upper short-term focus is on the 2342-2347 resistance range, and the lower short-term focus is on the 2300-2303 support range.

GOLD Trading Opportunity! BUY!
My dear friends,
Please, find my technical outlook for GOLD below:
The instrument tests an important psychological level 2342.7
Bias - Bullish
Technical Indicators: Supper Trend gives a precise Bullish signal, while Pivot Point HL predicts price changes and potential reversals in the market.
Target - 2348.5
About Used Indicators:
Super-trend indicator is more useful in trending markets where there are clear uptrends and downtrends in price.
———————————
WISH YOU ALL LUCK

GOLD: First green day, end of the monthHi everyone and welcome to my channel, please don’t forget to support all my work subscribing and liking my post, and for any question leave me a comment, I will be more than happy to help you!
“Trade setups, not movements”
1. DAY OF THE WEEK (Failed Breakout, False Break, Range Expansion)
Monday DAY 1 Opening Range
Tuesday DAY 2 Initial Balance
Wednesday DAY 3 (reset DAY 1) Mid Point Week
Thursday DAY 2
Friday DAY 3 Closing Range ✅ no cycle started yet
2. SIGNAL DAY
First Red Day
First Green Day ✅
3 Days Long Breakout
3 Days Short Breakout
Inside Day
3. WEEKLY TEMPLATE
Pump&Dump
Dump&Pump ✅
Frontside ✅
Backside
4. THESIS:
Long: primary, after the market closed as first green day, it went in consolidation, this let me think about a potential major move happening today, remembering that is also end of the month. Short traders in profit since Tuesday, a long setup back to the HOW is my best scenario of the day.
Short: secondary, lower low into the LOW, market pumped back up before starting a consolidation. I do not exclude a potential pump and dump scenario, going back down into the current LOW.
Please note that the purpose of my analysis is to help me and you hunting the best trade setup for the day, none of my technical aspects are a way to forecast any directional market movement.
Gianni


RESIST THE BULLS MNQThis the bull/bear flip zone for me.
My bet is that we trade up to it for CORE PCE data. There is some Short Covering that needs to happen for next leg lower and attack the next pivot zone...

silver mcx short tradeMCX:SILVER1!
Looking for short entry on silver
after a rejection from upper levels

Sell Ideal - GOLD / XAUUSD GOLD / XAUUSD
--------------------------
In anticipation of potential weakness in the asset, adopting a patient stance is recommended. While a final rally into the $2,400 range seems unlikely at this time, the possibility remains.
However, in addition to remaining vigilant, being prepared to sell the asset is crucial. There may be an attempt to test the commitment of buyers who expressed interest at the $1,800 level at the end of February 2024, potentially supporting earlier buyers. If this scenario unfolds, the $2,000 level will be a key support protected by buyers.
A possible strategy for shorting this asset is to sell upon rejection at the top of the local range (marked in purple on the chart) at $2,369 - $2,371, or when a bearish momentum candle appears, whichever occurs first, for an early entry.
Heed your DD!

20240531 NQI anticipate some SandD and new low with ss raid first. The HI news are to bring volatility with upside move for the day. TGIF scenario.

20240531 ESI anticipate more downside on 8.30 HI news, d ss raid and reversal to the upside for the rest of the day.

XAUUSD (GOLD), downward trend after bull accumulate.Hi friend. Lets look at gold chart window. We have more then 2k of bulls accumulate. So my opinion price will fall to 2328 secondly. Thanks for your support.
