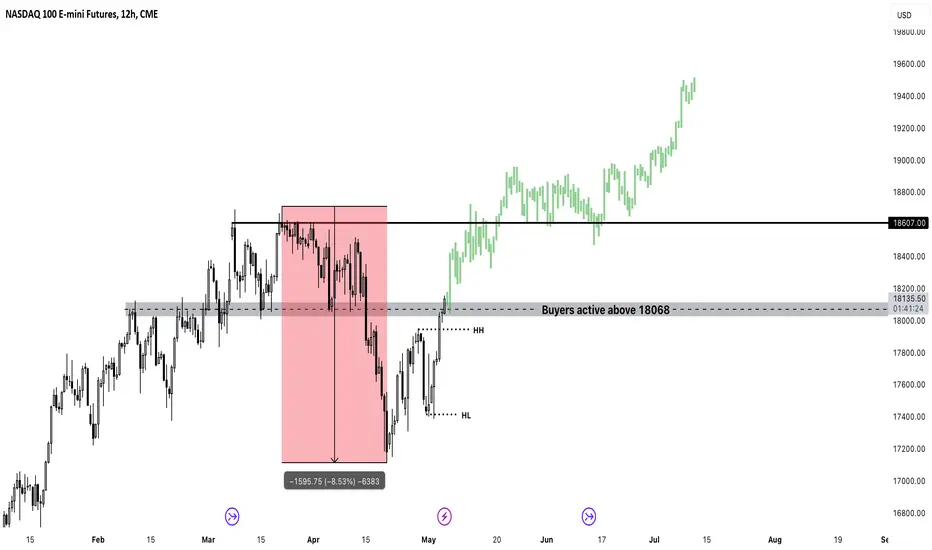
NASDAQ Uptrend Continuation Nasdaq 100 has fallen by 8.53% since its previous high.
The market has now created a new higher high and higher low signalling strong bullish momentum. If price can stabilise above 18608, we can see price target all time highs.
Futures market
Natural Gas every 4 years The natural gas markets have broken above the crucial $2 level, and it looks like we are probably going to continue to go higher. All things being equal, the short-term pullback should be buying opportunities that we take advantage of. This is an investment. This is not a short-term smash and grab trade. Keep in mind that supply is still a major issue with natural gas, but perhaps people are starting to realize that there’s natural gas in the Middle East and maybe geopolitical issues come into the foray and drive prices higher.
Nonetheless, I don’t think this is a long-term issue. I do think that you’re looking to buy dips in a lowly levered position, in my case an ETF, and just hanging on to it for the majority of the year as an investment. I think we could go for $2.50, but it’s going to take a while.
Credit: Christopher Lewis - FX Empire

GOLD 4H CHART ROUTE MAP UPDATEHey Everyone,
Another great day on the market today completing our 4H chart idea bullish target.
This chart was shared on Sunday with 2361, as an open target. This target was completed today with a perfect hit.
We now need to see ema5 lock above 2361 to open the next target. Our 1h chart has a gap open to 2365, which was just short by a few pips. We will keep this in mind, as we track both charts.
As stated above we will need to see ema5 lock above 2361 to further open the range above or a rejection will follow to find support in the retracement range. A cross and lock below 2290 will open the swing range.
We will keep the above in mind when taking buys from dips. Our updated levels and weighted levels will allow us to track the movement down and then catch bounces up.
We will continue to buy dips using our support levels taking 30 to 40 pips. As stated before each of our level structures give 20 to 40 pip bounces, which is enough for a nice entry and exit. If you back test the levels we share every week in the past 24 months, you can see how effectively they were used to trade with or against short/mid term swings and trends.
BULLISH TARGETS
2361 - DONE
EMA5 CROSS AND LOCK ABOVE 2361 WILL OPEN THE FOLLOWING BULLISH TARGET
2385
EMA5 CROSS AND LOCK ABOVE 2385 WILL OPEN THE FOLLOWING BULLISH TARGET
2416
BEARISH TARGETS
2322
EMA5 CROSS AND LOCK BELOW 2322 WILL OPEN THE FOLLOWING BEARISH TARGET
2290
EMA5 CROSS AND LOCK BELOW 2290 WILL OPEN THE FOLLOWING SWING RANGE
SWING RANGE
2274 - 2246
As always, we will keep you all updated with regular updates throughout the week and how we manage the active ideas and setups. Please don't forget to like, comment and follow to support us, we really appreciate it!
Mr Gold
GoldViewFX

Gold recovered slightly - XAU increased⭐️ Smart investment, Strong finance
⭐️ GOLDEN INFORMATION:
Gold price (XAU/USD) rises on Tuesday after hitting two-week lows of $2,325. The increase is supported by a weaker US Dollar (USD) and safe-haven demand due to geopolitical tensions in the Middle East. However, higher short-term Treasury yields and strong US economic data may strengthen the USD. Traders are cautious ahead of key US inflation data this week. The US Conference Board’s Consumer Confidence and speeches from Fed officials are scheduled for Tuesday. The US Core PCE Price Index on Friday will be closely watched. If there are more hawkish comments from the Fed and signs of persistent inflation, traders may reconsider expectations of a rate cut, leading to a stronger USD and downward pressure on gold prices.
⭐️ Personal comments NOVA:
Gold prices recovered slightly at the beginning of the week when there was not much important economic news, mainly sideways
⭐️ SET UP GOLD PRICE:
🔥BUY GOLD zone: $2334 - $2336 SL $2330 scalping
TP1: $2342
TP2: $2350
TP3: $2360
🔥BUY GOLD zone: $2309 - $2307 SL $2302
TP1: $2315
TP2: $2322
TP3: $2330
🔥SELL GOLD zone: $2378 - $2380 SL $2385
TP1: $2370
TP2: $2360
TP3: $2350
⭐️ Technical analysis:
Based on technical indicators EMA 34, EMA89 and support resistance areas to set up a reasonable BUY order.
⭐️ NOTE:
Note: Nova wishes traders to manage their capital well
- take the number of lots that match your capital
- Takeprofit equal to 4-6% of capital account
- Stoplose equal to 2-3% of capital account
- The winner is the one who sticks with the market the longest

MBT long/short if-then scenarioIf price returns to discount, then I am looking at Friday's BISI for longs. There is 1D v.POC & t.POC in proximity.
I prefer this first, as untapped t.POC at 69650 is a great initial target for longs
Stop loss near the 67100 local low upon End of Value
The higher probability, if price forces a higher high I am looking for a short
Right above this local high is a t.POC, there is also as SIBI from Thursday. Also a very large volume node & potential for RSI bear div.
I will NOT put blind limits for anything. I will be watching structure on the lower TF (5min) as we approach these key levels; among other edge, & these are just key levels N.F.A.

reverse trade directionI first opened a sell position, but when I saw the demand in the one-minute time frame, I decided to change the direction of the trade and close the previous trade at the entry point.

GOLD → Consolidation before distribution. $2,400 or $2,300?FX:XAUUSD after a false breakdown of the support of the range is forming a correction, but within the upward consolidation channel. The fundamental background is still negative.
There is no strong news in the next two days, so the fundamental background remains the same. There is no strong buyer on the market yet and thus, gold may continue its downward movement if it breaks through the support area: the rising line or the approximate area of 2340. A break of the local uptrending support line will move the market into the realization phase, which will be a continuation of the decline. The structure may be broken if the price rises and consolidates above 2354. In this case, the price may head towards 2374.
Resistance levels: 2354, 2358, 2370
Support levels: 2340, 2335, 2325
I expect that with high probability the decline may continue. But in the phase of waiting for strong news (Thursday and Friday), the market may gather liquidity.
Regards R. Linda!

Long Idea on Gold 4HEntry price from the demand zone. I recommend opening the trade with 2-3% of your deposit. Use a tight stop loss. I will open the trade now without a stop order, but I advise you to open your position from 50% of the order block. I will mark the entry point and stop loss for you below.
BUY-3.345,35
TP-3.390,53
SL-2.337,48

Xau/usd BUlish by fib is retesting the fvg before the retrecemenet to be done i ll see how gold is gonna react there i usually entry by a candlestick confirmation like a 1to3 on my box drawn if is not gonna happen i m not gonna entry the time frame that i usually look is 5 min bdw

Tea cup/ Gold cup setup on XAGUSD (Silver)1. Order block with unbalanced fair trade gap identified in the green.
2. Wedge broken.
3. Price is anticipated to break 50 McGinley line average.

US/UK OILClear descending wedge on a weekly/daily structure, looking for a retest of previous resistance for entry. Break on trend line or 8 daily ema may mean a change of trend

XAUUSD (GOLD): Was it a Fakeout?We're currently back inside the dynamic rising trendline, I'm expecting a further push up and then a retest and then I'm getting back in.
I'll set TP's at:
2405 - resistance
2445 - just below previous high
2500 - 41% Fib Extension / Good target number
Not sure what's going on with USD ATM as per my earlier post, however geo-political tensions are growing significantly so I'm expecting more speculation on gold.

XAU/USD - Sell Zone!Hi there!
I'm a seller on XAU/USD :
-RMID (Range Manipulation Initiation Distribution)
-We have liquidity.
-We have an interesting zone.
-We have the optimal fibo.
-We have accumulation before/on the zone.
-We are with the trend.
If you liked it and want more, feel free to subscribe and Boost the publication!

Gold H1 range analysis and important zonesI do not like this zone. Fibs is showing a pickup at 0.786. But it's right at a point of massive contract volume. Anything can happen around there...
If you see clear reversal at M15 and strong bullish momentum it's safe to buy from zone to zone. Be careful at the hourly ceiling and the hourly floor. When it gets there we need clear reversals in H1. Don't forget baerish has been dominant last week..
The floor beneath all the way down is still dominant. (2330)

XAUUSD LONGSeing Great Long idea on XAUUSD after nice drop which gives us quite nice entry price with a good Risk Reward

Buy Idea GOLD!"Long idea on gold, use only 5% of the deposit for the trade, no more, as the trade is somewhat risky in case of a stop loss due to a buy zone below in the form of an order block at 2317. I will re-enter, with the same targets, but you can set the stop loss as you wish.! The idea was published earlier but was blocked due to rule violations, and the entry and stop orders were different. Now that the trade is already open, I'm providing another opportunity to re-enter through the demand zone.
Entry Price: 2350.00
Stop Loss (SL): 2331.47
Take Profit (TP): 2449.70

Gold/USDA bearish butterfly is an options trading strategy designed to profit from a decline in the price of the underlying asset. It is a variation of the traditional butterfly spread but adjusted for a bearish outlook. Here’s how it works:
Profit and Loss Potential
- **Maximum Profit**: The maximum profit occurs when the price of the underlying asset is at the middle strike price (ATM) at expiration. In this case, the options you sold expire worthless, and the options you bought have the highest value.
- **Maximum Loss**: The maximum loss is limited to the net premium paid for the position. This happens if the price of the underlying asset moves significantly away from the middle strike price.
- **Breakeven Points**: There are two breakeven points, which can be calculated based on the premiums paid and received.
When to Use a Bearish Butterfly
- **Bearish Outlook**: This strategy is suitable when you expect a moderate decline in the price of the underlying asset.
- **Neutral to Bearish Market**: It benefits from a stable to slightly declining market.
Advantages and Disadvantages
Advantages:
- **Limited Risk**: The maximum loss is limited to the net premium paid.
- **Profit from Decline**: Profits from a decline in the price of the underlying asset.
- **Defined Risk and Reward**: Both potential profit and loss are clearly defined at the outset.
Disadvantages:
- **Complexity**: More complex than simple options strategies.
- **Commission Costs**: Multiple legs mean higher transaction costs.
- **Sensitivity to Expiry**: The strategy is highly sensitive to the price at expiration, making precise timing crucial.
Conclusion
The bearish butterfly is an advanced options strategy suitable for traders with a bearish outlook on the underlying asset and who are comfortable with the complexity and nuances of multi-leg options positions. It offers limited risk and the potential for profit if the asset's price declines moderately.

OIL Swing Expecting price to react from this area and continue to trend downwards from this figure level @80.000.

Dow Jones Weekly Template of May 27th BullishMonday has just shown its hand to me on what the week will bring. This week will be a bullish expansion candle. Whether or not it will be a small, medium or large is still up in the air. The average weekly candle's range is 900 ticks.
I believe that Monday is the low and will be bullish all week.
This pattern right here on a Monday is the textbook play of a bullish week. Price bounces around under the weekly open price and towards the end of the day blasts higher.
Tuesday will then continue higher
Here is a weekly template with the Monday pattern

ES Low of Week Pullback For Bullish Weekly CandleNow that Monday has printed, the weekly template that it has revealed is a bullish expansion week and Monday is the low of the week.
I just now entered in market order at 5324.00 with a 6 point stop down at 5318.00 and a target at 5364.00 for 40 points or 6.6:1
I don't believe price will be returning back below the Low of Week, if it holds.
Please see my prior post on the Dow Jones for more details

XAUUSD (GOLD) BUY ANALYSISHere on gold price has been in uptrend and there is a tendence that it will still go up as it still showing bullish . So it expected to go long and targeting profits should be around a psychological level of 2,370.000

XAUUSD Harmonics Crab Pattern Gold Bullish Long PositionXAUUSD Harmonics Crab Pattern Gold Bullish Long Position
-Crab Reversal Pattern
-Falling Wedge Reversal Pattern
-Divergence on RSI reversal indication

Gold Bearish IdeaAs gold is bearish in 4HR and 1 HR timeframe, we can short from 15 min Lh and also it is 0.6 of fib level.
