Gold reaching for new highs?Incredible to think with the Dollar bouncing Bullish that the price of Gold will rise but that is what the PA is showing and I do not argue with that
GC1! trade ideas

Digital and technical analysisWe see that there is a lack of buying momentum and we are in a major bullish correction

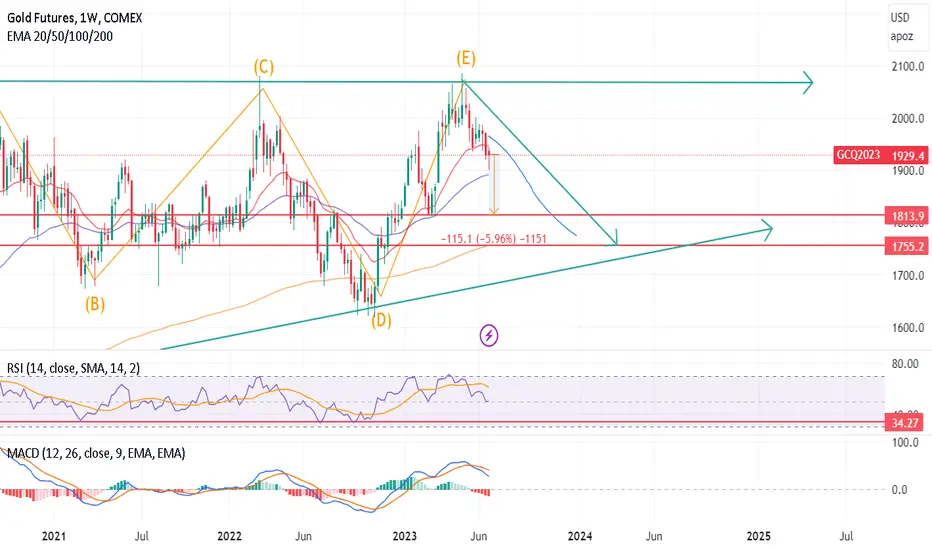
Gold (GC futures) weekly updateThis chart is the same as drawn way back, still standing with it.
I have two targets for gold in first quarter 2024, lower path (purple arrow) is 2100 area, and 2407 area (higher purple arrow), which is a Gartley extension dating back to September 2018 (last Fed hiking cycle).
Natural progression would be along the lower target, but a macro event (such as confrontational superpower war) would easily propel to higher trajectory target at 2407.

GOLDThe gold today looks powerful and positive for attacking the resistance and breaking the range. After this powerful pullback with good volume, it's time to buy.

Gold After witnessing this breakout with significant volume, the market appears to be indicating a downtrend for today.

Gold broken above wedge new target $2,081Falling Wedge has formed on Gold since April 2023.
This has been a turn for the good.
We've seen the price breakout and now we can expect the demand to continue.
7=21>200 - Bullish
RSI >50 (Buy divergence with the level breaking the downtrend.
Target $2,081
This will reflect on gold companies too which we can be bullish on. Happy to go long here.

Mcx Gold ForecastGold bulls trying to take control over 100 sma and 50% fibbo... More highs waiting...

GOLD,Daily, BUY SIGNALGOLD is giving a Buy Signal (Long Position) for the daily time frame. we are expecting it going up
these next days as we have shown in the chart. we set Stop at 1899.3

sell gold stya blw 58900 tgt 58810--780 interdaysell gold stya blw 58900 tgt 58810--780 interday sell on keep tight sl 58959 yes in interdat chart looks profit booking fall soon

Gold forecast in short timeEverything about this magical metal proves to be pumped up in the short term.
Due to the clearing of orders at the level of 1942 dollars, I am waiting for the failure of this level...

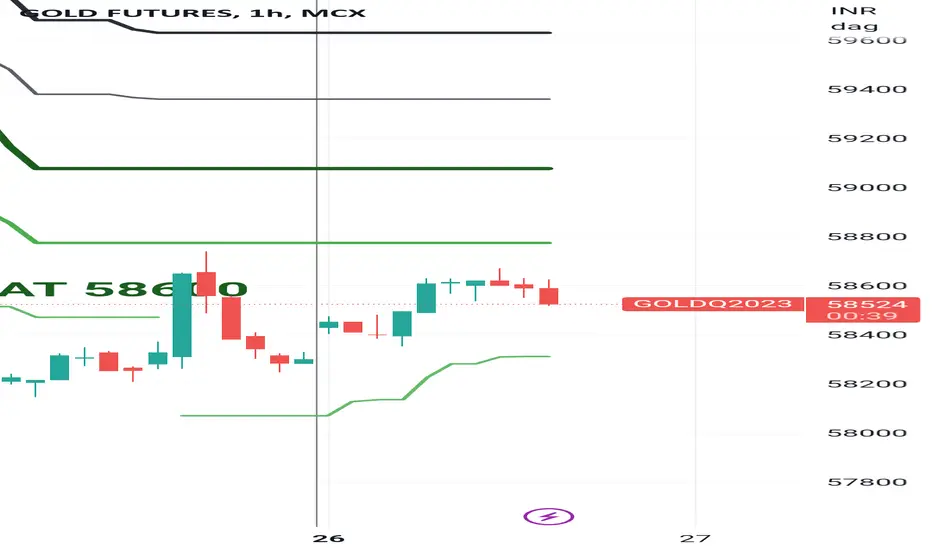
58000 is good supportit already triggered entry at 58500 it may consolidate or may go upto 60000 so this month range is 57000 to 60000... and sold goldm 57000 pe at 170 and by putting stoplose 56000

Gold / Silver RatioThe Gold / Silver ratio is holding support at a trend line and the 50-day moving average. It must break this support to signal an improving risk appetite for precious metals.

Gold bearGold is developing a nice top. Trend reversal pattern. Committment of Traders is showing extreme positions.

GC Gold futures (Daily Chart) I'm going out on a limb here before FED minutes today, but here is a daily chart analysis of gold in USD:
Gold is typically seasonal, selling in late first or second quarter until third or fourth quarter. Despite recent selling, gold has held remarkably well in light of a hawkish FED.
The good news:
Gold has bounced off its rising 200 day EMA (red moving average line) which has been good support. I expect some churning in this area (1900-1950) until fall/winter when seasonality becomes bullish -- the bottom dashed line is near a prior pivot swing (circle), and a key Gann level. and the top dashed line is a key Gann line and a key volume level.
The bad news:
Gold sits below its ichimoku cloud, which is potential resistance. 2K area is near a prior all time high and potential resistance.
Overall Assessment: I don't expect a low below the low 1900's (bottom dashed line). I do expect new highs, most likely in 2024. But new highs are contingent on macro environment of deteriorating economy ( banking, real estate defaults, global recession) and/or relaxed rate environment and effective monetary easing. Of course any black swan (which is unpredictable) can launch a new high.

Gold chartHere you can see MCX Gold 15 Min chart on the Gann overlay. In this chart, you identify the remarkable point for the future.

WHAT'S GOLD DOING ? GC 4H Hello traders,
this week maybe interesting in gold, looking at the 4H chart, it still consolidating in after it found its support at around 1912, strong mouvement to the last trend line of the pitchfork and the bleu resistance area, where it got rejected with an interesting volume in both. for me i only buy gold, therefore i am searching only for strong buy signals.
keep you updated when i see one.

Gold - When A New ATH Prints, Will You Get Trapped?It's not that I am fundamentally bearish on gold. Actually, I am fundamentally bullish on gold.
But it's because I think the fundamentals of gold are bullish that this commodity is not bound to pump while the MMs have tipped their hands that they're going to sell Artificial Intelligence and Chinese Communist Party garbage to a willing horde of retail zombies and dead money hedge funds.
And so if gold is really to return to relatively significant lows, like say $1,500, the purpose would be accumulation for $2,500 and $3,000.
And if that's to happen, with the way the last three months of price action has been, the gold MM, which is really quite a shark, is extremely unlikely to allow the funds and retail cowboys who have been short under the triple top ATH at $2,089 to enjoy the ride down with them
This monthly is too obvious that new lows aren't going to come before the highs are purged:
And the weekly shows that the $1,936 dump rebalanced the gap created by the big March candle.
A significant calculation in the markets is rumors that came out on Friday that the CCP would be pumping some QE to save its crashing markets.
This news came on the back of names as big as Elon Musk, Jamie Dimon, Henry Kissinger, and Condoleezza Rice either traveling to the mainland for the first time in years or attending virtually, along with the Starbucks and Pfizer CEOs.
So what's going on, if you ask me, is that the Party has once again been given a blood transfusion, and that blood transfusion may be in exchange for that gold it spent the last several months buying.
This would naturally mean that gold would pump so it can be sold at high prices and bought back even lower, with the dual purpose being that it would cripple the CCP's gold reserves, which are loaned on leverage.
Whenever you hear someone barking about how strong the CCP is, or worse, if they conflate "China" to "the Chinese Communist Party," you need to take a step back and ask yourself how a country whose lost tens or hundreds of millions of people to a pandemic it's still doing everything it can to cover up could possibly be strong.
It's not that the CCP is going to invade Taiwan. It's that NATO and the other global factions are thinking about how they can take over Beijing via Taiwan when the Party falls in the imminent future.
The persecution of Falun Gong by the Jiang Faction and the Communist Party itself in 1999 wasn't and isn't Xi Jinping's fault, but as the Party Chairman, his head hangs in the noose for this crime, a weakness that anyone can exploit at any time to get rid of Xi and the Party at the same time.
But the problem is that a lot of the western world and Europe and other countries have participated in the persecution, which has targeted 100 million spiritual practitioners and gone so far as to commit the sin of live organ harvesting.
And so this means that the situation in China is Mutually Assured Destruction, a real Game of Thrones, and ultimately the Heavens are playing them all for a fool together.
So, here's the trade:
Expect the $1,936 pivot to hold. (But $1,920 will also work)
Buy really here or anywhere under $1,950.
Be patient and don't get scared
Sell $2,150
Collect 7-12%
Buy wine and whiskey and treat your friends
Now the kicker is that shorting gold at $2,150-2,170 will be a really good trade, but for the bear case to really apply you want to see a liquidity purge and distribution, rather than a sweep.
Like, you want to see a wick or tweezers form on monthly bars, but you want to see gold spend some daily and/or weekly candles distributing and getting knocked down and trying again and getting knocked down over $2,100.
Otherwise an ATH that doesn't show signs of having its fever break can go quite literally anywhere, although the macro and timing does not currently make sense for this to be the case at present.
One of the best ways to play this is in the GLD ETF. Calls when it trades to about $178.5 with at least 3 months on the contract will print a lot of money closing over $200 if my trade is correct.
I can only tell you that the world is in trouble. A bull impulse when breadth is poor, macro conditions are poor, the timing doesn't make sense... all of them should be causes for alarm.
One day these distractions won't be maintained anymore and there will be significant problems we all have to face outside of the computer in the real world.
To make it through that, you have to be a good person, cultivate virtue, and go back to valuing and maintaining our traditions again.

low momentum on previous resistance strong break up through resistance now retrace 50% fib.
previous resistance now become support
also if you check momentum indicator like MACD you will see bullish divergence

possible correction before going to the upsidegold has a weekly gap at 1870
and a strong support at 1815
also the macd shows a potential downside of 4-5% based on the above technicals
mentioned
inflation on may rose 0.1% which will strengthen the DXY index , and historically speaking they have an inverse relationship with the gold price.
dollar will be weak gradually and slowly when the inflation records 3% or less
Gold at a interesting juncture, which way now?Gold is at an interesting junction again, are we going go to hold the $1900 area and retrace or is this a more substantial bottom?
It's very tough nowadays to anticipate what the outcome will be because the market seems to be adopting not too many traditional norms.
So technically, it seems to have met a short-term objective around the $1900 area (38.2% retracement) and the weekly candle pattern highlighted has played out higher in the following weeks. I have highlighted the previous occurrences.
For me, I was always targeting $1905, so I will monitor for buying opportunities but a failure could see a deeper move to the $1850 (the 40% retracement point) area.
we could be settling into a $1900-$2000 range?

Gold's 12-Year Cup & Handle Pattern Signals New All-Time Introduction:
In the world of technical analysis, patterns often provide valuable insights into the future price movements of financial assets. One such pattern that has recently caught the attention of gold traders is the 12-year Cup & Handle formation. This classic pattern, characterized by a rounded cup shape followed by a smaller handle, is pointing towards an imminent breakthrough for gold prices, potentially propelling the precious metal to a new all-time high of $2,800.
Body:
Gold's journey over the past 12 years has been nothing short of remarkable, with several major price swings and prolonged periods of consolidation. This price action has created a massive cup formation, suggesting a long-term bullish trend for the precious metal. The cup portion of the pattern represents a period of accumulation, where investors buy gold at various price levels, creating a strong support base.
Following the cup formation, gold entered a period of consolidation and formed a smaller handle. This handle acts as a pause or a temporary retracement within the overall bullish trend. It represents a period of price consolidation, as investors take profits and new buyers cautiously enter the market.
Now, as gold's price approaches the upper boundary of the handle, technical traders are closely monitoring the potential breakout above the resistance level. This breakout, if confirmed, would complete the Cup & Handle pattern and signal a significant shift in the gold market. A decisive move above the handle's resistance would indicate a renewed wave of buying interest and could ignite a powerful rally towards the projected target of $2,800.
Several factors contribute to the bullish sentiment surrounding gold's potential surge. Geopolitical tensions, inflationary pressures, and global economic uncertainties continue to drive investors towards safe-haven assets like gold. Additionally, central banks worldwide have maintained accommodative monetary policies, which have historically supported higher gold prices.
Conclusion:
Gold's 12-year Cup & Handle pattern is a testament to the enduring allure and strength of the precious metal. As the price nears the upper boundary of the handle, traders are eagerly anticipating a breakout that could lead to a new all-time high of $2,800. While technical patterns are not infallible, they provide valuable insights into market sentiment and can guide trading strategies. As the gold market evolves, it will be intriguing to see if the Cup & Handle pattern manifests its predicted outcome, potentially fueling a renewed wave of optimism for gold investors.

GC1!: Expecting Bullish Movement! Here is Why:
The analysis of the GC1! chart clearly shows us that the pair is finally about to go up due to the rising pressure from the buyers.
❤️ Please, support our work with like & comment! ❤️
