Divergences say that $USDT dominance is getting stronger#usdt #tether dominance chart is rising after bullish divergences occured. Short term continuation is expected. Not financial advice.
USDT.D trade ideas

Usd.dominance Dominance is currently bearish….trying to get back to it orders before firing off to the upside. Please follow for more updates.

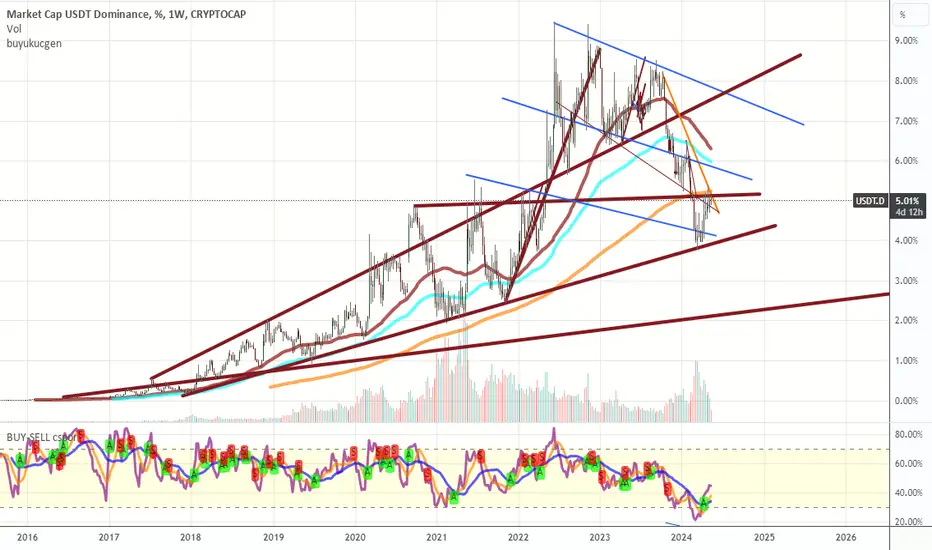
My key levels This trading chart is designed to provide clear visual indicators for optimal buying and selling points within the market. The chart includes several key elements that assist traders in making informed decisions:
Support Levels: Marked by green horizontal lines, these levels indicate price points where the asset historically finds buying interest, suggesting potential entry points for long positions. These levels are typically where the price tends to bounce back up after a decline.
Resistance Levels: Denoted by red horizontal lines, these levels highlight price points where selling interest has previously emerged, suggesting potential exit points for long positions or entry points for short positions. The price tends to fall after hitting these levels.
Moving Averages: Illustrated as smooth lines, these averages (e.g., 50-day and 200-day moving averages) help identify the overall trend direction. Crossovers of these averages can signal potential buy or sell opportunities.
Trend Lines: Diagonal lines that connect successive highs or lows, showing the direction and strength of the market trend. A break above or below these lines can indicate a significant shift in market sentiment.
Volume Indicators: Bars at the bottom of the chart showing the trading volume, providing insight into the strength of a price movement. Higher volume often confirms the validity of a breakout or breakdown at key levels.
Candlestick Patterns: The chart uses candlestick representations to show the open, high, low, and close prices for each time period, providing detailed insights into market sentiment and potential reversals.

Usdt.d 4h H&sPO3 h&s sym triangle.All these patterns shows up on USDT which means down for crypto.po3 respected.

Tether Dominion Bearish Flag Pattern Appears! "USDT.D"Hello, Friends!
Good to see you. Are you all having a good day?
Tether Dominance is on a long berish.
The current wave shows the bearish flag pattern.
If it breaks down the bottom of the Flag, it will go down to the target value.
It's important!
When tether Dominance falls, the BTC and ALT rise.
When Tether Dominance rises, the BTC and ALT fall.

USDT.DOMINANCE CHART UPDATE !!USDT DOMINANCE ANALYSIS
USDT.D is descending following a retest below the rising wedge. It's also breaking through the MA 50, with a candle close below it confirming a bearish sentiment. Notably, a bearish USDTD trend often indicates bullish momentum for the broader crypto market due to their inverse relationship.
I have tried to bring the best possible results in this chart.
If you like it, hit the like button and share your charts in the comments section.
Thank you.

big upside movement forcast by anlyse USDT.Din USDT.D chart we can obviously get our confirmation for another leg up.
the exact confirmation come after break and closing candle under 4.76% line.
next support is about 4% which is resistance of 73000$ in bitcoin

USDT DOM chartUsdt dominance in resistance now, now ready to turn back 4$ levels
it means that btc to 70-75k right now
lets see what happens in a month
Full analysis of Dominance Tether ( USDT.D )We are at the most important time bullran of Bitcoin and crypto market.
We have now reached the bottom of the descending channel and the most important Tether trend line (we were with this trend line from December 2017 to November 2021).
If the bottom of the channel breaks and reaches the trend, Dominance Tether will fall by 11% and a strong fomo will form, the price of Bitcoin will reach 70~89 thousand dollars, then we will see a sharp correction of the market after the halving. (unmodified
bullran is very dangerous and fragile).
But if the bottom of the channel is not broken, dominance will reach the range of 5.5%, as a result, the whole market will undergo a severe correction and the upward trend of the market will remain for the next halving.
Market correction can be done with strange and unexpected news.
The most important market days are March 11 and May 11 (white dotted line).
Be very careful in transactions, especially setting stop loss, in these 2 months whales and exchanges will be more active to get liquidity and stop hunters.


USDT DominanceCan we expect such price action for USDT dominance? If so, it's likely that Bitcoin dominance will also continue its uptrend. In that case, altcoins will likely experience a significant downturn.

Daminans USDTGood time
According to the previous analysis, Dominance Tether was touched in the resistance range and tries to break it. If it succeeds in breaking the resistance, it will be next to the specified range
And Bitcoin will correct up to the range of 52000 to 56000
good luck

Daminans USDTGood time
According to the previous analysis, Dominance Tether was touched in the resistance range and tries to break it. If it succeeds in breaking the resistance, it will be next to the specified range
And Bitcoin will correct up to the range of 52000 to 56000
good luck

USDT.DIn the previous analysis, as expected, an ascending log was formed in the form of wave B.
If this analysis is correct
You can wait for the fall of dominance and therefore the possibility of an upward trend in the cryptocurrency market.


$USDT Dominance' s 2 Way#usdt #tether dominance chart may follow these two path. Ascending channel is on the play since 13th March 2024 (Mid term)

Bitcoin and USDT Dominance Compare IYou can use this chart to predict the price of Bitcoin by comparing it to USDT dominance.
When USDT dominance shows signs of increasing, Bitcoin will undergo a correction.


Analysis of Tether's dominance in history 2024/05/09According to the previous analysis of Dominance Tether
It showed a small reaction to the red range and continued the trend
And because there was a cap above the red range, it quickly reached the yellow range

USDT.DDominance analysis of the daily time frame
By analyzing the dominance of Tether, we can have a better view of the movement of Bitcoin.


BEARISH WHITE-SWAN HARMONIC PATTERN ON USDT.D#USDT.D is printing a bearish trend continuation, white-swan harmonic pattern on the daily.
To be noted however is that the price has an upward move towards 6.2-6.5% zone before trend continuation.
This means that the market might keep bleeding for now📉
