Apex zone is being broken by triangle patternOn day TF
Gala is moving to apex zone and will break triangle pattern soon.
Wait for breakout
Crypto market

78980 next tp BTC now prepared for new ATH which will be around 78980 plus minus , this may be the last rally of 1st bullish rally , still time to decide , if this is last rally which confirmed triggered recession pullback of all world financial intrument to ground , floor inclu nasdaq gold

ETHUSD - Bounce Up? Drawing trend lines like this shows the support line and possible higher line that leads to a large upward reaction which I have high lighted in green
Lets see how this goes, if it continues upward
I am very bullish on ETHUSD

Alphusdt trade opporutnityALPHUSDT's wave 4 is nearing completion, indicating it's time to prepare for accumulation in anticipation of the final leg, wave 5. The projected targets for this move are indicated on the chart. Follow the immediate buyback zone for optimal buying opportunities. Additionally, the external demand zone serves as a robust support area to monitor, should the initial buy zone fail.

BITCOIN - 2 SCENARIOS Hello Traders !
The Bitcoin price formed a descending triangle pattern.
We have 2 scenarios:
BEARISH SCENARIO:
if the price breaks and closes below the support level (67276 - 66259),
We will see a huge bearish move📉
TARGET: 61640🎯
BULLISH SCENARIO:
if the market breaks above the resistance line and closes above that,
We will see a bullish move📈
TARGET: 71400🎯

Continuation patterns are forming on the NOTUSDT chartTrading Setup:
A Trading Signal is seen in the NOTUSDT NotcoinCommunity
Traders can open their Buy Trades NOW
⬆️Buy now or Buy on 0.0107
⭕️SL @ 0.0092
🔵TP1 @ 0.016
🔵TP2 @ 0.021
🔵TP3 @ 0.029
previous idea
What are these signals based on?
Classical Technical Analysis
Price Action Candlesticks Fibonacci
RSI, Moving Average , Ichimoku , Bollinger Bands
Risk Warning
Trading Forex, CFDs, Crypto, Futures, and Stocks involve a risk of loss. Please consider carefully if such trading is appropriate for you. Past performance is not indicative of future results.
If you liked our ideas, please support us with your likes 👍 and comments .

CHANNELSDrawing channels are not reliable because of too little data, but maybe they reached a conclusion.
So don't take it too seriously
SANDUSDT- Trendline Breakout in Daily TimeframeDear Traders,
We are convening a discussion focused on #SANDUSDT
The Trendline Breakout Has Already Done ✅
So,I am Expecting a Bullish Move of 45% 🚀😉
#crypto #cryptocurrency #bitcoin #ethereum #blockchain #btc #cryptotrading #cryptonews #eth #cryptocurrencies #nft #bitcoinnews #bitcoins #trading #bitcoinmining #forex #binance #cryptoart #nfts#trading #forex #trader #investing #stocks #forextrader #stockmarket #daytrader #forextrading #invest #bitcoin #daytrading #cryptocurrency #crypto #investor #investment #forexsignals #nse #chartpattern #cedarforex #candlepatterns #learntrading #bseinstitute #shorttermtrade #bankniftytrading #stockmarketph #calloptions #mqlsignal #futuretrader #tradingmemes #chartpatterns #tradingview #tradinglife #tradinglifestyle #tradingstrategy #tradingtips #tradingplan #tradingsignals #tradingaccounts #tradingsignal #tradingforex #tradingsync #tradingroom #litecoin #ethereum #bitcoincash #cryptocurrencies #ripple #btc #bitcoinnews #bitcoinmining #blockchain #eth #bitcoin #bitcoins #coinbase #cryptocurrency #crypto #bitcointrading #dogecoin CRYPTOCAP:BTC CRYPTOCAP:ETH CRYPTOCAP:USDT CRYPTOCAP:PEPE CRYPTOCAP:DOGE NASDAQ:ALT

#BTC/USD Forecasts Suggest a Rally to $85,000 in Q3!📊 BTC/USDT Technical Analysis by Cryptorphic 📊
As of June 3, 2024, BTC/USDT is showing promising signs of a potential breakout. The price action is currently testing the upper boundary of the bullish flag in weekly, with significant support levels around $62000.
🔍 Key Levels:
- Support: $62,959.01
- Resistance: $69,001.80 (Current Price)
The 200 EMA has acted as strong support, with the price bouncing off the highlighted support zone multiple times. The recent bullish momentum suggests a breakout could be imminent.
🟢 Bullish Scenario:
- A breakout above the current resistance of around $69,000 could propel BTC towards the next psychological level of $72,000 and beyond.
According to Fibonacci extension levels, BTC could reach approximately $86,700 within the next 6-8 weeks.
🔴 Bearish Scenario:
- Failure to break above the resistance may lead to a retest of the $62,959.01 support level.
Stay tuned for more updates and trade wisely! 📈
Please hit the like button if you like my charts.
Thank you
#PEACE

PYTH/USDT Gaining Momentum For a Bullish Rally | Get Ready 💎#PYTHUSDT has impressively surged out of a descending channel and is now testing a crucial juncture where former resistance has become support. The Point of Control (POC) of the VRVP Channel provides crucial support, enhancing the chances of a bullish continuation.
💎If #PythNetwork can successfully hold this retested support at $0.400, we anticipate a powerful rally propelled by the strong momentum at this level.
💎However, if SEED_DONKEYDAN_MARKET_CAP:PYTH loses its footing and descends into the channel, dipping below the current support, it could signify a shift back to a bearish trend. The next key demand zone is at $0.355, a level renowned for its liquidity and historical bullish rebounds.
💎Should #PYTH revisit this demand zone, it's vital for the price to secure a strong rebound to uphold support. Failure to achieve this could boost bearish forces, worsen market sentiment, and potentially result in further price declines.
💎Keep your strategies adaptive and remain alert, Paradisers. Your ParadiseTeam is vigilantly monitoring the market and ready to guide you through the dynamic shifts of the #PythNetwork market.
MyCryptoParadise
iFeel the success

ZeroLend 300% possibility high chance ( this can become the 3x)Zerolend shows an interesting cycle view for the long term.
We see this as one of the main volume low market cap coins that can show high results.
We will follow the trend of Zerolend in the coming days.
it's a high-risk coin, but at the same time a coin that can do 300% with a high chance, since there is no guarantee in the market.
Since the breakdown is low time frame the coin becomes interesting for the whale entry.
we did choice a view check of red side low time frame.
let's see where the coin can go.. it's not about today only, but the coming time.
This update is not trading advice Trading without a plan can be risky.

FTM - ready to pump???Attractive FTM chart ready to move to the top of the channel
Are you ready????

SUI price: Ready...steady...Go !)Six months have passed since the publication of the previous #SUIUSDT idea
During this time, the NYSE:SUI price has made a cool route:
$1,16 👉 $2,10 👉 $0,88
"modestly", but in principle, everything is as predicted)
Now, looking at the #SUIUSDT chart, we can say that $0.88 was the very bottom, twice confirmed. And there may be good growth ahead.
Do you believe in SUI? Do you hold SUI?
💰 Then the medium/long-term target of $3.50 for #SUI is just for you

ConstitutionDAO PEOPLE price looks prety good#ConstitutionDAO SEED_DONKEYDAN_MARKET_CAP:PEOPLE - what kind of project it is, who is pumping it and why, we honestly didn't really get into it (maybe you can tell us in the comments) , but the chart looks interesting.
Two scenarios for future price movements:
1️⃣ personally, we would like to see the red scenario working out more, so that we can buy #PEOPLEUSDT at a lower price, because now it is frankly uncomfortable to buy.
2️⃣ But the blue scenario is also okay, though after the breakout and retest of $0.067
There are quite a few targets from above: $0.10, $0.12, $0.16, and if you're lucky with the ATH update, $0.28.
The coin is definitely worth taking “on pencil” and keeping an eye on it as long as they show that they are ready to push it further up.
_____________________
Did you like our analysis? Leave a comment, like, and follow to get more


With for not koinI expect such a move from Not Koin,
NatCoin's RSI has gone up a lot, which indicates its correction

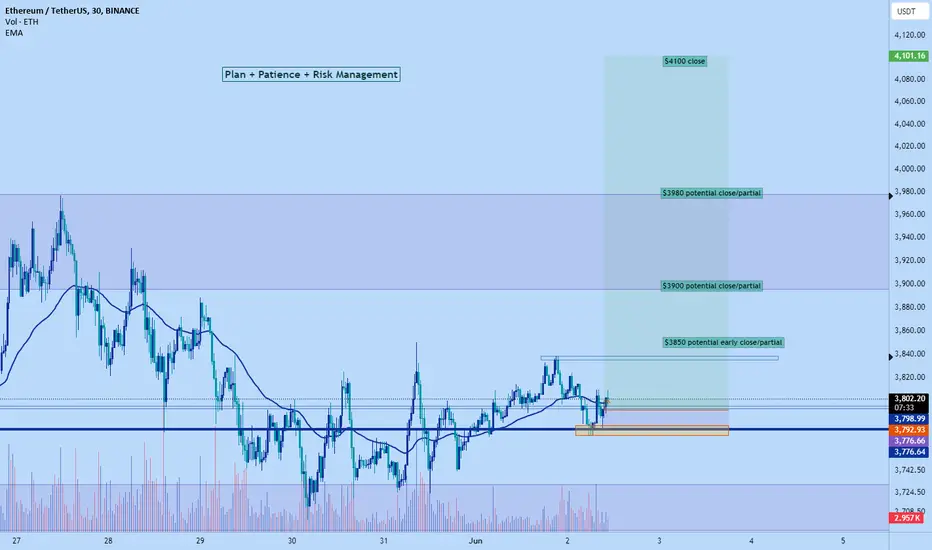
Eth pump to $3900 or higher today!I already entered the trade but still room to make decent RR for anyone who wants to follow along now. Price is at $3800 right now.
Price rejected daily support and have free space to move up to $3900, already showed signs of reversal with the 4hr shifting bullish and maintaining the $3800 area on retest.
Shifted bearish on 1hr last night but currently forming double bottom again support signs of reversal for continuation to the upside.
Htfs like weekly and monthly also bullish.
I got some other confirmations as well but lets keep it short.
I'll leave my TP open for now and monitor at the prices shown on my chart. I'll update here if I make a decision to take partial or close- If no update then am holding. Hard close at $4100 if somehow we get enough volume to pump there today. I anticipate a short squeeze just don't know if it be today or tomorrow - It depends on volume.
$3900 seems like a reasonable target for today though.
JASMY IdeaIf the price does not breaking the bottom of the channel, (due to the end of the fifth wave in the 4-hour chart), then after hitting the bottom of the channel as well as hitting the 30-MA. there is possibility to return to top of the channel.
Pay attention: that the closing of the ascending candlestick inside the chanel, and then, passaging the next ascending candle above the highest price of the closed candle, is a buy signal.

PORTAL heavy accumulation!The daily chart of PORTALUSDT on Binance exhibits a classic rounding bottom formation, which is typically a bullish reversal pattern.
Observations:
Rounding Bottom:
The price action from mid-March to early June clearly depicts a rounded bottom pattern.
This formation suggests a gradual transition from a downtrend to an uptrend, indicating a potential bullish reversal.
Support and Resistance:
Strong Support: The price has established a strong support level around $0.80, characterized by high trading activity.
Strong Resistance: There is a notable resistance zone around $1.00, associated with negative sentiment. Breaking through this level is crucial for confirming the bullish reversal.
Volume Analysis:
An increase in trading volume is observed during the formation of the rounding bottom, which is a positive sign of accumulation.
Watch for a volume surge if the price approaches and attempts to break the resistance zone at $1.00.
Indicators:
The Relative Strength Index (RSI) is currently at 58.46, indicating moderate bullish momentum.
The RSI has been on an upward trajectory, supporting the potential for continued upward movement.
Strategy:
Entry Point: Consider entering a long position if the price breaks above the $1.00 resistance level with a significant increase in volume, confirming the rounding bottom pattern.
Stop Loss: Place a stop loss below the strong support level at $0.80 to manage risk.
Target: The potential target can be estimated by the height of the pattern, suggesting a target around $1.60 - $1.80, which corresponds with previous resistance levels from March.
Conclusion:
The chart shows promising signs of a bullish reversal with the rounding bottom formation. Traders should monitor the price action closely for a breakout above $1.00 with increased volume to confirm the pattern. Proper risk management should be employed by observing the support and resistance levels.

Escaping the accumulation phase - Investment entryHello community,
Today, I'm excited to kick off a new journey into the world of cryptocurrencies by sharing with you my new investment asset WAVES/USDT.
Fundamental analysis:
Good margin between the current market capitalization and the all-time high market cap.
Strong project
Strong community
The coin intersects with many domains (high volume)
Negative point : no max supply
Money management strategy:
The designated capital for this trade is $436+500$. Here's how the funds will be allocated:
1st Order ($436 spot): Placed at the current market price. This order aims to enter the market after the accumulation phase exiting.
2nd Order ($500 spot) : Set around $1.269. This price level aligns with a strong weekly support and the bear market bottom, making it a strategic adjustment price point.
The objective of this investment is to take profits at 5x but can be flexible depending on market conditions.
I won't be adding any additional orders below these levels.
Happy trading, everyone!
This is not an investment advice, I am only sharing my own portfolio ;)

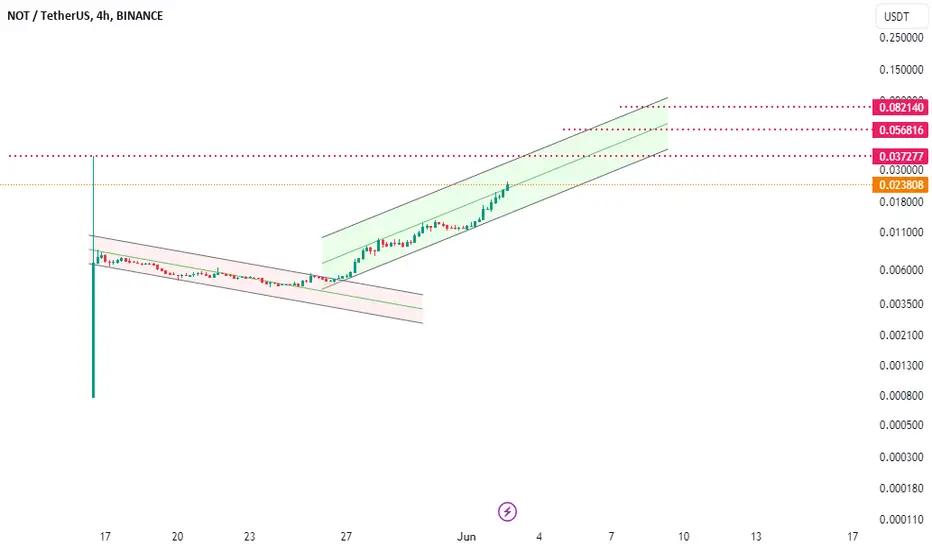
A PullBack Idea on NOTcoin | Updatewe can have a long trade in pullback! i try it :)
because of the high risk, This idea is'nt recommended, but it's suitable for the low volume of the test.
At the end of the week, NotCoin's movement will end with the closing of the one-day candle (as well as the weekly candle) in the price range of $0.03000.

Jasmyusdt Buy opporutnityThe JASMYUSDT trading pair is demonstrating a bullish reversal configuration. Validation of this pattern will be contingent upon a breach of the neckline of the 'Adam and Eve' double bottom formation.
We have designated our accumulation region proximal to the immediate support zone, with a stop-loss established to mitigate superfluous exposure of the trading account.
The objectives for both the 'Adam' and 'Eve' peaks have been specified on the chart, including a margin for potential extended targets.
Your interaction with this analysis is important.
Thank you.

BTC update in H4 chart Hello
There is nothing more to say about BTC and please check lest ideas. This is just an update for its new wave counting
Thanks
