Crypto market

Is Bitcoin Preparing for a Bull Run? Hello, dear friends!💙 Bitcoin has started to show a decline in price, even though other markets are experiencing growth.
Despite the current price decline, Bitcoin's behavior closely mirrors the patterns observed before previous bull runs. Analyzing historical data, we can see that Bitcoin often undergoes a phase of consolidation and accumulation before significant upward movements. This phase is characterized by narrowing price ranges and reduced volatility, often forming technical patterns like triangles or flags on the charts.
One of the key indicators suggesting a potential bull run is the breakout from these consolidation patterns. In the past, when Bitcoin has broken out of a well-defined triangle or flag pattern, it has often led to substantial price increases. Currently, we are observing similar behavior, where Bitcoin appears to be consolidating and forming a base of support. This base-building is crucial as it allows for the accumulation of buying pressure, which can propel prices higher when a breakout occurs.
It's important to acknowledge that Bitcoin's current decline could be part of the larger consolidation phase, potentially shaking out weak hands and setting the stage for a more robust recovery. Such pullbacks are not uncommon and can often precede stronger bullish momentum as the market stabilizes and regains confidence.
Moreover, market sentiment and external factors play a crucial role in the development of a bull run. Positive news, regulatory clarity, or institutional adoption can act as catalysts, driving investor confidence and increasing buying activity. With the macroeconomic environment showing signs of stability and other markets experiencing growth, Bitcoin's current consolidation phase might just be the calm before the storm.
Pay attention to the price formations I've circled in yellow and pink, and notice how the price reacted afterwards.
In conclusion, while Bitcoin is currently seeing a price decline, its behavior still exhibits patterns that have historically preceded bull runs. If this trend continues and we see a confirmed breakout from the current consolidation phase, it could signal the start of another significant upward movement. Investors should keep a close eye on key support and resistance levels, as well as external market factors, to position themselves advantageously for the potential bull run.
Thanks for Your attention and interest in my work.
Always sincerely Yours, Kateryna💙💛

TON's Situation: What Shall we Expect ??Hi.
COINEX:TONUSDT
TON is in an ascending triangle which means the price is about to do a good bullish movement. The price can increase as much as the measured price movement ( AB=CD ) .The break out needed for increasing further has not happened but it should happen pretty soon.
✅ Due to the Ascending structure of the chart...
🟢 TON has been Bullish Recently!
🟢 The odds of another Bullish Movement is High!
🟢 Ascending Triangle is Visible on The chart!
🟢 No break out yet!
❗ Note that if the Triangle is broken down with the power of descending candles, our analysis will fail.
Stay awesome my friends.
_ _ _ _ _ _ _ _ _ _ _ _ _ _ _ _ _ _ _ _ _ _ _ _ _ _ _ _ _ _ _ _ _
✅Thank you, and for more ideas, hit ❤️Like❤️ and 🌟Follow🌟!
⚠️Things can change...
The markets are always changing and even with all these signals, the market changes tend to be strong and fast!!

Bitcoin Possible Bullish MovementLiquidity grabbed on the previous low, bullish momentum in play, price heading to support, hopefully price bounces on the the support for bullish move.
Note: Risk Management very IMPORTANT

BITCOIN: Interest Rate Unchanged - What's next?The interest rate remains unchanged while the BTCUSD price is struggling at a trend resistance.
The Fixed Range Volume Profile confirms the strong resistance at $69.5k.
BTC is now aiming for lower highs (confirmed today) and lower lows, with the next short-term support being located at $64k.
My short position is open.
Cheers,
Ares

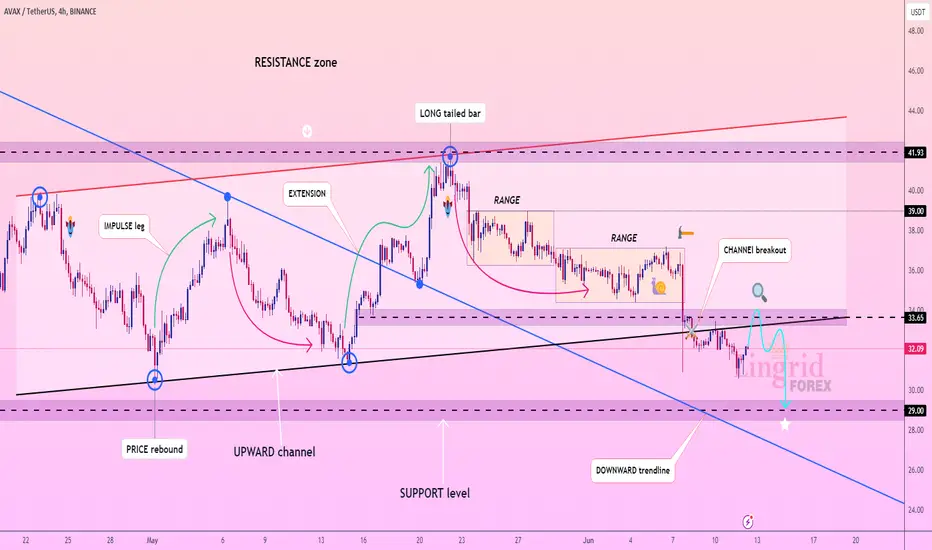
Lingrid | AVAXUSDT breakout of CHANNEL. Possible SHORTBINANCE:AVAXUSDT encountered a strong rejection at the resistance zone, leading to a subsequent sell-off. Despite the bulls' efforts, they were unable to muster sufficient strength to form a new high. The market has been stuck in a consolidation zone since mid-April, and I believe it may be heading towards the bottom of this range as the price has broken and closed below the upward channel. On the daily timeframe, we are currently seeing a bearish impulse leg. I anticipate the market to retest its previous lows in the coming days. My goal is to support around 29.00
Traders, if you liked this idea or if you have your own opinion about it, write in the comments. I will be glad 👩💻
Keep Box Area !! Target 0.02888 !!!!!!Dear Trader,
if Not keep box Zone area we will see next pump in 1-2 days ,
Target 1 : 0.023
Target 2 : 0.028
Target 3 : Open
best Entry : 0.016300 Area !!!
SL : below BOX Zone
Dont Forget Like&comment please !
Regards,
Alireza!

Btc scalp trade ideaBtc is currently around 67300 and struggling here. And there is below sell side liquidity which i have aslo marked on the chart. Below the sell side liquidity is demand zone , so when price will come down to grab liquidity then we will definately get oppertunity to fil our ling position for scalp trade. This is my point of view and also cleared on the chart.

NOTUSDT Idea | UpdateThe NOTUSDT chart shows a continued upward price trend toward last week's price. Three short-term resistance zones impede price growth, but the price continues to rise.
Consider entering a long position in NOTUSDT on a 2-hour candlestick close above the high of the previous six candlesticks.

***** TONUSDT READY TO FLY *****#TONUSDT
(Update)
Hey dear members hope you all are enjoying our ideas and analysis. Now we are here to discuss about TON.
TON is making ascending triangle pattern and ready for breakout after this breakout we can see gain upto 40%+ soon

The key is whether it can rise above 168.41-173.20Hello, traders.
If you "Follow", you can always get new information quickly.
Please also click "Boost".
Have a nice day today.
-------------------------------------
When trading spot, if possible, it is recommended to start trading when the M-Signal on the 1D chart > M-Signal on the 1W chart > M-Signal on the 1M chart.
That is because the uptrend is in progress.
Currently, the M-Signal on the 1D chart > M-Signal on the 1W chart > M-Signal on the 1M chart, but since the price < M-Signal on the 1D chart, it can be interpreted that it is showing signs of turning into a short-term downtrend.
Since the HA-Low indicator of the 1D chart is created and forming a low point range, you can trade around 141.07 depending on whether there is support.
In other words, if it falls below 141.07 and shows resistance, it means that there is a possibility of a stepwise downtrend.
Therefore, it is important to know in which direction it deviates from the HA-Low (141.07) of the 1D chart ~ HA-High (173.20) of the 1D chart.
Since the HA-High (136.92) indicator of the 1M chart is created near the HA-Low indicator of the 1D chart, the area around 136.92-141.07 corresponds to the support area.
And, since the HA-High (168.41) indicator of the 1W chart is created near the HA-High indicator of the 1D chart, the area around 168.41-173.20 corresponds to the resistance area.
Anyway, since it is located near the HA-High indicator of the 1W chart and the HA-High indicator of the 1M chart, that is, near the HA-High indicator, the current price can be seen as being in the high point area.
Therefore, if the price is maintained above 168.41-173.20, it can be interpreted that there is a high possibility of maintaining an upward trend.
Therefore, if you are currently trading, I think it is better to trade from a short-term perspective.
TS - Since the BW indicator of the BW indicator has touched the lowest point, the BW indicator is expected to be created in the price candle.
Therefore, if the BW indicator is created in the price candle, you can trade depending on whether there is support near that point.
Another indicator that can be verified is the StochRSI indicator.
You can reduce psychological anxiety about buying in advance by checking if StochRSI > StochRSI EMA.
The fact that the HA-Low indicator was created means that a low point has been formed.
Therefore, if it shows support near the box range (128.50-153.39) selected based on the HA-Low indicator, it is a time to buy.
If it falls below 141.07 and a step-down trend occurs,
1st: Fibonacci ratio point 0.618 (119.71)
2nd: 99.49
You should check for support near the 1st and 2nd above.
If it starts to rise above 173.20,
1st: 234.12
2nd: 297.74
You should check for support near the 1st and 2nd above.
Have a good time.
Thank you.
--------------------------------------------------
- Big picture
It is expected that a full-scale rise will start when it rises above 29K.
The section expected to be touched in the next bull market is 81K-95K.
#BTCUSD 12M
1st: 44234.54
2nd: 61383.23
3rd: 89126.41
101875.70-106275.10 (overshooting)
4th: 13401.28
151166.97-157451.83 (overshooting)
5th: 178910.15
These are points where resistance is likely to occur in the future.
We need to check if these points can be broken upward.
We need to check the movement when this section is touched because I think a new trend can be created in the overshooting section.
#BTCUSD 1M
If the major uptrend continues until 2025, it is expected to start forming a pull back pattern after rising to around 57014.33.
1st: 43833.05
2nd: 32992.55
-----------------

FIL coin trade ideaFil coin is very difficult coin to trade. Because it always grabs liquidity thats why I am looking for grabbing liquidity then will long. Liquidity is below previous support zone, price likely to come at that zone then reversal to upside.

Bearish drop?DOG/USD has just reacted off the resistance level which is an overlap resistance that aligns with the 50% Fibonacci retracement and could drop to our take profit.
Entry: 0.1482
Why we like it:
There is an overlap resistance level which lines up with the 50% Fibonacci retracement.
Stop loss: 0.1565
Why we like it:
There is an overlap resistance level that is slightly below the 78.6% Fibonacci retracement.
Take profit: 0.1362
Why we like it:
There is a pullback support level.
Please be advised that the information presented on TradingView is provided to Vantage (‘Vantage Global Limited’, ‘we’) by a third-party provider (‘Everest Fortune Group’). Please be reminded that you are solely responsible for the trading decisions on your account. There is a very high degree of risk involved in trading. Any information and/or content is intended entirely for research, educational and informational purposes only and does not constitute investment or consultation advice or investment strategy. The information is not tailored to the investment needs of any specific person and therefore does not involve a consideration of any of the investment objectives, financial situation or needs of any viewer that may receive it. Kindly also note that past performance is not a reliable indicator of future results. Actual results may differ materially from those anticipated in forward-looking or past performance statements. We assume no liability as to the accuracy or completeness of any of the information and/or content provided herein and the Company cannot be held responsible for any omission, mistake nor for any loss or damage including without limitation to any loss of profit which may arise from reliance on any information supplied by Everest Fortune Group.

#TRXUSDT | 1 HOUR TIMEFRAME UPDATE#TRXUSDT | 1 HOUR TIMEFRAME UPDATE
We can look for confirmation to open a LONG position in the range of $0.11540 - $0.11475 ✔️
The target for this upward movement is $0.11712 - $0.11800 - $0.11910 - $0.12060 - $0.12200 🔼
Invalidation below $0.11360 ❌

BTCUSDT Waiting For The Breakout!BTCUSDt technical analysis updated
BTC price has been rejected multiple times from its resistance line. If the price breaks above the resistance line, we can expect a significant bullish move in Bitcoin.
We could see a bullish breakout in the next few days.
Reagrds
Hexa

Trading opportunity for TURBOUSDTBased on technical factors there is a Buy position in :
📊 TURBOUSDT
🔵 Buy Now
🪫Stop loss 0.0047500
🔋Target 1 0.0067000
🔋Target 2 0.0083000
🔋Target 3 0.0099000
💸RISK : 1%
We hope it is profitable for you ❤️
Please support our activity with your likes👍 and comments📝

cat in a dogs world MEW memecoinMemecoin #MEW ... 😱
1️⃣ On the one hand, it looks like all the coins are unlock, and the price has entered the liquidity zone, and the meme is on #Solana (it's a trend that memes are pumped on $Solana...)
2️⃣ And on the other hand, the altos are so easy to fall that the price of #MEWUSDT can fall in the range of $0.00314-0.00344 in just a few candles
Observe or take risks - it's up to you

NOT StoppingNOT has been moving up since launch, currently hanging at support and resistance in short timeframe as illustrated in the chart.

velodrome is going to $1good morning,,,
i stopped posting publicly on this platform for reasons which i shall not name out of respect to tradingview's terms of service. all of my work has become private over the last year, but i decided to share this one publicly, as per one of our member's request.
---
velodrome is the #1 decentralized exchange on the optimism network. it has more volume than uniswap on the optimism network, and 10x more rewards for liquidity providers.
uniswap's market cap currently sits at about 6 billion, whereas velodrome's market cap currently sits at about 100 million. you can do the math there, if you'd like.
---
i predict velodrome hits $1 this year, through an extended 5th wave. that is roughly 1,000% from the current levels. we have been tracking velodrome over the last 2 years and were able to catch numerous 1,000% runs along the way.
---
note: tradingview does not provide the full chart history for this particular project, so there's no way for me to share my full theory - though what i'm sharing here should be adequate enough to paint the kind of picture which i was intuitively inclined to share with you all publicly.
---
$1 by september is the plan.
a binance listing could send it to $5 and beyond, in the same span of time, if it was to happen.
---
ps. don't take my word for it, do your own dd, and see for yourself the kind of potential this gem of a project has.
✌

INJUSDT → Interested buyer. Ready to rise to 43.0?BINANCE:INJUSDT looks stronger than bitcoin and the crypto market. Against the background of the general decline, the coin is growing and this is a rather strong premise.
The price may return to the range of 29.0 - 43.0.
On D1, a pre-breakout setup is forming regarding the 29.2-29.45 area. If the price can consolidate above this area, then further traders will open bullish potential, the target of which could be a rise towards resistance (intra-range movement). The coin looks green in the red market and it means that someone is interested in it (big player). On the overall negative fundamental background there is a risk that the coin will go down, but for now I am looking out for further upside.
*The long scenario will be broken if the price closes below yesterday's opening.
Resistance levels: 33.62, 43.4
Support levels: 29.21, 29.85
The potential is there. It can be realized if the bulls hold the defense above the key support area.
Regards R. Linda!

Congrats if you secured the bag on that trade! | Next plays 🎉 Congrats if you secured the bag on that trade! 💼 It was a simple range low rotation setup with clear market structure confirmation. 📈 This is what I call a bread and butter play. 🍞 We got all our confirmations and a juicy bull move. 🐂 If you took that one, remember to add your profits to the profit wall! 🧱 It makes me happy to see beginners winning at this game, and that's why I post here every day.
For our next play we are watching for a bear continuation set up
If we break structure bullishly we are watching for the pull back into zone for a bull continuation
😊 Follow for more signals! 📲
$HIGH / USDt pair 45%+ possible gainHello traders,
This coin has been performing so well up until few days ago. After Btc's crash it was still fine but all of a sudden it crash badly. Of course this was expected but Leveraged short traders take this correction up a notch. I was not invested in High coin during the crash however one needs to think twice when going short at these levels. It is already down more than mage 68%..During the crash there was absolutely no correction on a daily frame. Expected bounce will be more than %45+ and will be very quick. Going short at the bottom $3+ levels is exactly same as going long at the top $8+ levels. You could lose your position in a matter of minutes and also one needs to consider spot buyers. Do you want to destroy these people and their dreams so you can make a bit more $$. Big short players already got rich . Sometimes enough is enough! And most importantly there is the moral part of the story as well. It could be you or me one day! Karma always finds us one way or another. I learn this in a hard way with Luna example.
Speaking of which selling is slowing down and volume is going down accordingly. We should at least see good bounce back towards $4.5-$5 range anytime soon!

2024-06-12 - a daily price action after hour update - bitcoinGood Evening and I hope you are well.
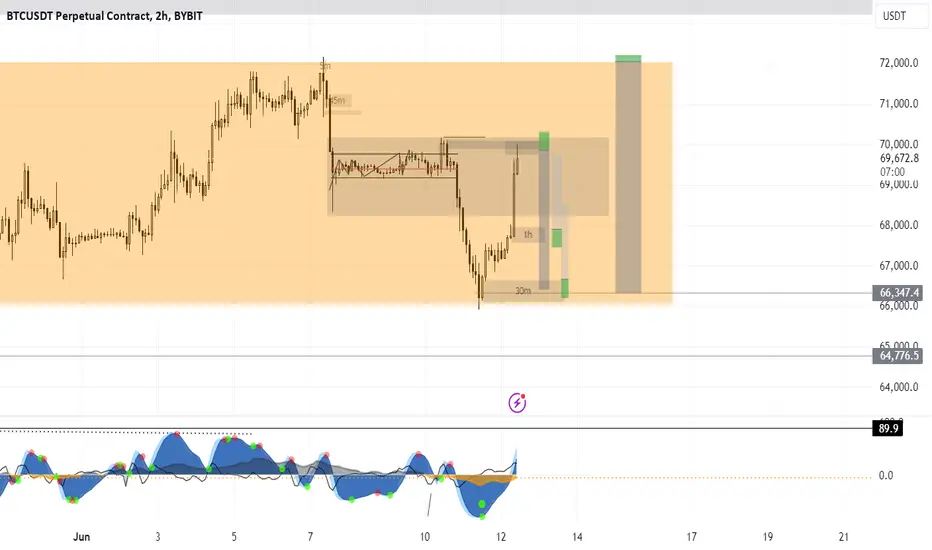
comment: Interesting day. I did almost no updates on the posted chart. The pink breakout line was king again and I shorted it a second time for another 3000 points. I don’t care if the triangle is broken to the upside, when the market turns around again, it was a trap and the pattern lives on in my world. This market is not behaving as bullish as almost everyone on twitter tells you. Today nasdaq had an almost 2% day while Bitcoin stayed below 70000.
current market cycle: trading range
key levels: small range 66600 - 70000 / big range 56000 - 74000
bull case: Bulls tried to break to the upside but the breakout price around 70000 proofed strong resistance again. I don’t know how many times they will try again but I think the number is very low. Triangle will break tomorrow. Bulls need 70000 and above, otherwise it’s lights out.
Invalidation is below 66000.
bear case: My target for the bears, if they break 66000 is 65000. There I will decide how strong the move is and if we can get to 64000 fast. If they fail to close tomorrow below the daily ema at 68600, my bearish wave series is probably wrong and we more more sideways until we get a bigger impulse.
Invalidation is above 70000.
short term: Neutral here inside the triangle. —unchanged
medium-long term: down to 40000 (could take 3-6 months). Could also drop to 20000 again but let’s make 40000 first and see how many want to buy there. —unchanged
current swing trade: None.
trade of the day: Short the breakout price around 70000, was good for 3000 points.
