NAS Retracement possibleWe're pretty close to the midnight line, but there could be a retracement back toward the NYC Midnight opening price.
Looking for one more rejection with the top price zone.
Market indices

#JXY $JPY waiting a good days soon #Japan My expectations for the #JPY dollar in the next 2 months God wi
Maybe I'm wrong but I taking it

My expectations for the #US dollar in the short and medium term.Here are my thoughts:
Good luck, mates.
The targets shown on the chart.

Dow Jones on the Brink:Here's What You Need to Know!The Dow Jones Industrial Average Index (DJIA) currently trades at approximately 39,149.8, showing a slight increase of 0.26% in the last session. The market's recent performance has been marked by significant volatility, indicated by the bearish cross observed in the MACD and other momentum indicators.
The latest candlestick formations suggest a potential reversal pattern within an ascending channel. The channel support was tested recently, and the price bounced back, indicating a temporary bullish sentiment. The bearish cross on the MACD histogram suggests downward momentum could persist in the short term.
The 50-day moving average (1D MA50) is currently acting as a dynamic support level, around the 39,000 mark. This support level will be crucial for the next few trading sessions. A break below this level could signal a further decline, while maintaining above it could provide the necessary support for a rebound.
Utilizing the Fibonacci retracement tool from the recent high to low, we see the price currently hovering around the 38.2% retracement level (approximately 38,350). This level is critical; a break below this could see the DJIA testing the 50% retracement level around 38,000, followed by the 61.8% level near 37,500.
MACD: The bearish cross is evident, suggesting selling pressure may continue. However, any divergence from the current trend might indicate a potential reversal.
RSI: Currently at around 55, the RSI is neither overbought nor oversold. A move towards 70 could signal overbought conditions, while a dip below 30 would indicate oversold conditions.
Stochastic Oscillator: The %K and %D lines have crossed above the oversold territory, hinting at a possible bullish momentum if the crossover sustains.
There has been a noticeable decrease in volume during the recent upward price movements, indicating potential weakness in the current rally. Higher volume on down days suggests more conviction behind the selling pressure.
The price is trading near the top of the Ichimoku cloud, suggesting a potential resistance area. A breakout above the cloud could indicate a continuation of the bullish trend, while a rejection might confirm the bearish outlook.
Short Position
Entry: 39,100 (below current price to confirm downward momentum)
Target: 38,000 (50% Fibonacci retracement and strong support)
Stop Loss: 39,600 (above recent resistance)
Long Position
Entry: 38,350 (near 38.2% Fibonacci retracement level)
Target: 41,500 (rebound target and upper channel boundary)
Stop Loss: 38,000 (just below 50% Fibonacci level to minimize losses)
The DJIA presents a mixed outlook with significant potential for both upward and downward movements. Traders should closely monitor the key support and resistance levels, paying particular attention to the moving averages and momentum indicators for early signs of trend reversals. A disciplined approach with well-defined entry and exit points, coupled with appropriate stop losses, will be crucial in navigating the current market conditions.

DXY bearish Elliot wave structure 1.DXY just like my previous idea came to the lower end of the expansion move now headed into a retracement to create the 5th and final bearish leg
Meaning looking at xxxusd pairs to be bullish to end the week into next and usdxxx pairs be bearish
2 If it doesn’t break below the 3 leg then it has a probability of reversing / accumulating to the upside causing
Xxxusd pairs to continue lower and usdxxx pairs to continue higher
PAYtience pays


US100 dropas we are expecting fundimentals in about an hour, im seeing a drop in nas100 in anticipation to break the previous low.

US30Certainly! Let's break down the concept of the 38% retracement into its key components for a clearer understanding:
1. **Fibonacci Retracement Levels:** These are horizontal lines used in technical analysis to identify potential support and resistance levels in a price chart. They are based on ratios derived from the Fibonacci sequence.
2. **The 38% Retracement Level:** Specifically, the 38% retracement level is derived from the Fibonacci ratio of 0.382. It indicates a potential reversal or pause in the price movement within a larger trend.
3. **Application of the 38% Level:**
- **Uptrend:** In an uptrend, traders draw the retracement from the low to the high. The 38% retracement level serves as a point where the price might find support during a pullback.
- **Downtrend:** Conversely, in a downtrend, the retracement is drawn from the high to the low. Here, the 38% retracement level acts as potential resistance during a rally.
4. **Drawing the Retracement:**
- Traders identify the most recent significant high and low points in the price movement.
- For an uptrend, the retracement is drawn from the low to the high, while for a downtrend, it's drawn from the high to the low.
5. **Usage of the 38% Level:**
- Traders observe how price reacts around the 38% retracement level. If the price bounces off this level and resumes the prevailing trend, it validates the retracement and offers a potential entry point.
- It's common to combine the 38% retracement level with other technical indicators for confirmation, such as moving averages or trendlines.
6. **Example Scenarios:**
- In an uptrend scenario, if a stock moves from $100 to $150, the 38% retracement of this move would be at $131. Traders might watch for the stock to find support around $131 and consider entering long positions.
- In a downtrend scenario, if a stock drops from $150 to $100, the 38% retracement level during a rally would be around $119. Traders might anticipate resistance around $119 and consider shorting opportunities.
7. **Significance:**
- The 38% retracement level is significant because it often acts as a key support or resistance level where price reversals may occur.
- Traders use this level to make informed decisions regarding entry, exit, and risk management within the context of a larger trend.
Understanding the 38% retracement level and its application within Fibonacci retracements can provide traders with valuable insights into potential price movements and opportunities in the financial markets.

Need Confirmation B-wave is completeI posted an idea for SPX500USD and SPY a couple weeks ago saying I was legging into July puts because we are nearing a major top.
That top is likely in, but here is the confirmation I am looking for to signal a larger degree B-wave has completed:
- Expect small bounce to around 5283
- Then drop to 5215-5240
** If this occurs, and is followed by a bounce to 5292-5293, it will set up for a iii wave down to 5110 by early to mid June 2024 to confirm a larger degree C wave is in progress with end goal 4600-4700 by end of July 2024.

Tops Not In...I see a lot of fear in markets and many thinking a top may be in...I really struggle seeing how for many reasons and I think we got more up left till this party ends.

DOW GREAT FORMATION H AND SGreat head and shoulder formation.
It doesn't have to be a perfect H&S . Its important to have divergence and there is.
It was nice to trade it

The price fell despite strong NVDA earnings. What's the cause?Nasdaq Falls 2.0% Amid Investor Uncertainty and Fed Caution
The Nasdaq fell by 2.0% on a subdued Thursday as investors adjusted their portfolios amid shifting market sentiment. The trading session was marked by an uneasy atmosphere following the release of the Federal Reserve's latest meeting minutes, which indicated that central bankers are in no hurry to reduce interest rates .
This cautious stance from the Fed has been a key factor in supporting the recent upward trend in stocks.
Technical Analysis:
The Nasdaq is poised to test the 18,715 level before likely retreating to 18,600. A bearish trend will be confirmed if the price stabilizes below 18,600, potentially driving it down further to 18,435. Conversely, a bullish scenario will emerge if the price breaks above the 18,660 threshold.
pivot line: 18710
Resistance Price: 18790, 18920, 19100
Support price: 18550, 18440, 18250
Its range for Today will be between Support 18250 and Resistance 18790

S&P 500, time to buy? where is the support for 1 day chartsTake noted the below is not an investment advise, bet at your own risk. I am solely not responsible for any of your loses in money or assets.
The Current S&P 500 price is 4320.05 as of 24 September 2023.
The S&P 500 have potential to drop to 3900 to 3850 range in the coming 1.5 months before the Fed's FOMC in November 2023.
The price will hover between 4618.28 to about 3900 within this period.
Potential strong tailwind is the pause of US Fed's rate hike this coming November 2023. This will drive and test the resistance level at 4618.28. If there is a breakout then the next level of weaker resistance based on the dynamic resistance will be at 4804.36.
Potential strong headwind will drive the market to around 3900 because of higher rate for longer by Fed's US. If next 1.5 months down the road if there is other or fews strong headwinds appears then the price might breakout from 3900 and head lower to a weaker support at 3534.39. This is highly unlikely to happen withing next few months as the Fed's is data dependent and also depend of the next 6 months' data to say that they will maintain the Fed's funds rate for longer. Still I think is not clear at the moment that the Fed's need higher for longer for 2 years.
3900 is a very strong support level based on the 1-week chart of S&P 500. I would only start buying a little at 3900 and reassess for 2 to 3 weeks before buying more.
Based on current market condition it is highly unlikely to get a low that surpasses last year October 2022 bottom. However, the future for a US recession is unclear currently as there is both camp of soft landing and a recession.

Nasdaq 100 (CME) may fall to 18540.00 - 18630.00Pivot
18800.00
Our preference
Short positions below 18800.00 with targets at 18630.00 & 18540.00 in extension.
Alternative scenario
Above 18800.00 look for further upside with 18920.00 & 19020.00 as targets.
Comment
The RSI is mixed.
Supports and resistances
19020.00
18920.00
18800.00
18737.50 Last
18630.00
18540.00
18440.00
Number of asterisks represents the strength of support and resistance levels.

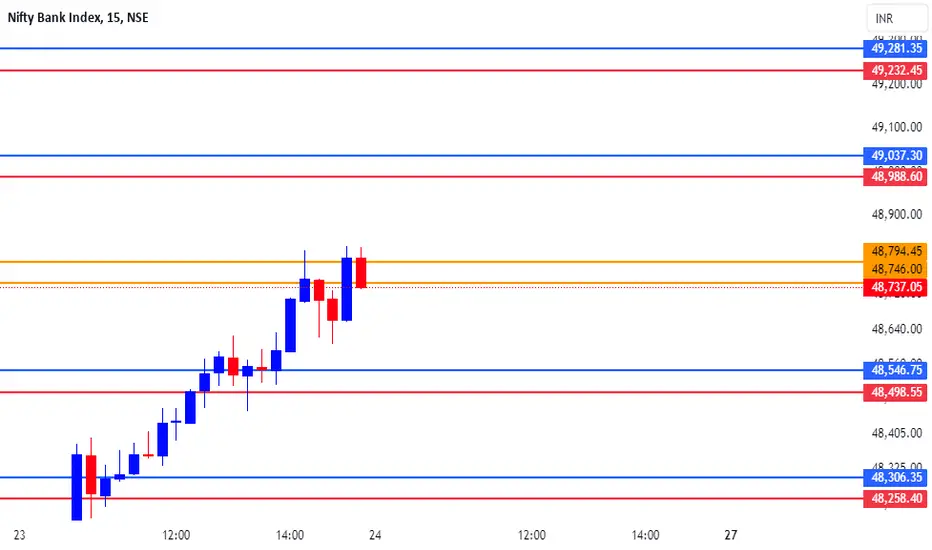
BANK-NIFTY TRADING LEVELS FOR 24-05-2024Explanation:
This is a very useful trading system. This means that you should not take a trade blindly, but rather that there is another confirmation to take the trade you can use this for perfect entry and perfect exit
This trading opportunity is based on volume, previous price, and price range , are included
Entry/Exit point's:
- It has very easy entry and exit points
- In this pair of lines with two colors are given (RED AND BLUE)
- In this the blue line is used to take long entry and the red line is used to take short entry (But it is all based on a more conformation from your trading plan)
Stop Loss/Take Profit:
Stop Loss
- According to this, if you take a long trade, its stop loss will be the red line just below ( A trade can exit either when the price crosses the red line or the 5 minute candlestick crosses the red line. (This can be done according to your preference) )
- A short entry should use the opposite rules to a long entry
Take Profit
-When you take a long entry according to the profit to be booked is on the next red line above. ( Or if there are other reasons, it can be a safe exit )
- Opposite rules for booking profit on long entry are to book profit on short trade. ( The blue line above is the stop loss of short entry )
Timeframe:
According to this, the time frame you should use while taking trades is 5 minutes time frames . (5 minute time frame works well in this)
Risk Disclaimer:
Trading carries significant risk and is not suitable for all traders. You may lose some or all of your capital in a matter of minutes or hours. Market conditions can change rapidly, and prices can move against you quickly. You may not always be able to exit at a favorable price, and you may be required to hold a position overnight, exposing yourself to additional risk. Day trading involves high risk, high leverage, and high stakes, and you should only trade with funds you can afford to lose. Please carefully consider your financial situation, risk tolerance, and trading objectives before engaging in day trading.
Engagement:
Share your insights, ask questions, and learn from others in the community. Whether you're a seasoned pro or just starting out, we're all in this together.
What's your take on the current market conditions? Which trading strategies are working for you? Let's discuss and help each other grow as traders!
Comment below and let's get the conversation started!
Original Content:
This trading setup is the result of my own innovation and expertise, and is not based on any publicly available information or third-party systems. It is a reflection of my dedication to developing a competitive edge in the markets.
bulish dxymy idea is in the daily and weekly tf we are still bullish and went down to daily tf and identified those equal highs which act as a draw of liquidity

Head and shoulders patternBank Nifty is showing Head and shoulders pattern. Please be ready for big downward move. Put you money in PUT option rather than CALL options. Let's earn money togather.

ChocHow are you trying to catch the wallstreet bus,at the next stop. Here the market is showing us signs of a trend line liquidity development

S&P 500 Falls 0.7% Amid Investor Uncertainty S&P 500 Falls 0.7% Amid Investor Uncertainty
The S&P 500 OANDA:SPX500USD declined by 0.7% on a subdued Thursday as investors adjusted their portfolios amid fluctuating market sentiment. The trading session was marked by an uneasy atmosphere following the release of the Federal Reserve's latest meeting minutes, which indicated that central bankers are not in a hurry to reduce interest rates . This cautious stance from the Fed has been a key factor in supporting the recent upward trend in stocks.
Technically Side:
The price has declined and reached the breakout zone, indicating a potential return to the 5266 level. To continue the bearish trend, the price must break below 5266, confirmed by closing a 4-hour or 1-hour candle under this level. If this occurs, the next targets would be 5226 and 5193.
Conversely, if the price closes above 5282, it would suggest a bullish trend, with the potential to reach 5307 and subsequently 5320.
Pivot Line: 5282
Resistance Levels: 5305, 5325, 5350
Support Levels: 5245, 5227, 5193
Today’s expected trading range is between the support 5192 and the resistance 5320.

FTSE-100 : ROUNDING TOP- The market has been registering higher highs and low since mid-April ; the mid-term trend was then bullish.
- As stated in our previous analysis, the market has successfully accelerated to a new historical high around 8,483pts.
Since then, with continuing disappointing economic developments regarding inflation, PMI and retail sales data, investors have been pushed to take some profits out.
This led to this technical situation where the market seems to have come to a state of exhaustion, highlighted by a rounding top pattern.
Both moving average are in bearish configuration following a downside cross.
The MACD indicator evolves inside its selling zone too.
- The short-term outlook is bearish for the market.
The rounding top pattern is seen as a bearish reversal configuration, especially when it occurs far in a bullish trend, at an all-time high level.
The market has just broken-out the 23.6% fibonacci level at 8,310pts and its next targets can be found around 8,200pts, 8,117pts and 8,030pts by extension.
Pierre Veyret, Technical Analyst at activTrades
The information provided does not constitute investment research. The material has no been prepared in accordance with the legal requirements designed to promote the independence of investment research and such is to be considered to be a marketing communication.
All information has been prepared by ActivTrades ("AT"). The information does not contain a record of AT's prices, or an offer of or solicitation for a transaction in any financial instrument. No representation or warranty is given as to the accuracy or completeness of this information.
Any material provided does not have regard to the specific investment objective and financial situation of any person who may receive it. Past performance is not reliable indicator of future performance. AT provides an execution-only service. Consequently, any person acing on the information provided does so at their own risk.

DOW JONES Should this Bearish Cross worry us?The Dow Jones Industrial Average Index (DJIA) hit our 40000 Target that we set on our May 06 idea (see chart below) and after that experienced a sharp pull-back:
So far this is within the lines of a natural technical correction correction towards the 1D MA50 (blue trend-line), which during uptrends tends to be re-tested as a Support. Notice also that this is where the 0.382 Fibonacci level is, an important technical Support during pull-backs.
As long as it holds, the Channel Up has the much needed Higher Low that can enable it to move to a Higher High. We expect that to be around 41500 (+6.30% rise, similar to the previous Bullish Leg).
On the other hand, since the 1D MACD completed a Bearish Cross yesterday, we need to consider the possibility of a deeper pull-back, as the last 1D MACD Bearish Cross (April 02), delivered a -6.88% decline. As a result, if the 1D MA50 breaks though, we will take that small loss and go on a short-term sell instead, targeting 38350 (0.618 Fibonacci level).
-------------------------------------------------------------------------------
** Please LIKE 👍, FOLLOW ✅, SHARE 🙌 and COMMENT ✍ if you enjoy this idea! Also share your ideas and charts in the comments section below! This is best way to keep it relevant, support us, keep the content here free and allow the idea to reach as many people as possible. **
-------------------------------------------------------------------------------
💸💸💸💸💸💸
👇 👇 👇 👇 👇 👇
