Market indices

SPx (JOB OPPERTIOUNITIES) Strong Volatile Technical Analysis of SPx
The price dropped from the price we mentioned in the previous idea and already stabilized under the support line which is 5260, so it is possible to touch 5226 and 5193 as well,
Bearish Scenario: As long as the price remains below 5260, it is likely to decline towards 5226.
Bullish Scenario: For a bullish trend to emerge, the price must stabilize above 5260, potentially pushing up to 5302. If the price surpasses this level, it may indicate the start of a new bullish trend of about 5347.
Pivot Line: 5260
Resistance Levels: 5301, 5321, 5350
Support Levels: 5226, 5193, 5170
Today’s expected trading range is between the support at 5193 and the resistance at 5320.

Daily Analysis - 04/06/2024 - The Modern Day TraderSpotlight Pair: EURUSD - LONG
- Daily IRL -> ERL
- 4H FVG Has been mitigated
- 1H MMXM failed to for a market structure shift which indicates continuation.
As always, make sure my analysis aligns with your own plan and rules before jumping into positions. Trade Safe!
Sam
The Modern Day Trader

US 30 long - scalp trade (update) Just like that we got the buyside sitting at 38660 as mentioned in the previous idea.
IF you've taken a trade along the way, don't forget to take some profits.
IF you're on the sideline and want to get involved...FOLLOW the market structure and HTF liquidity
Stay safe and never risk more than 1-5% of your capital per trade. The following analysis is merely a price action based analysis and does not constitute financial advice in any form.

Railway pattern, bears are rejected.Everything can you see in chart 😇
Standard railway track- decreasing price are rejected, then price retest 0.3-0.6
The range pf price action can be see by next fibo levels.

SPX500 Local Short!SPX500 went up to
Retest the horizontal
Resistance level of 5323.37
From where we will be
Expecting a local
Move down !


dxy is getting beairsh again 💀 boost and follow for more❤️🔥 a recent fake out breakout past resistance zone, now sitting at a trend support.. I wont be surprised to see it slice through trend support and head down to 97-100 targets in the next few weeks or so 🎯

Bearish Divergences everywhere part 2 Global indices are are not supporting this recent break to new all time highs (by the American indices). This is a negative divergence which is a warning sign as per historic signals.

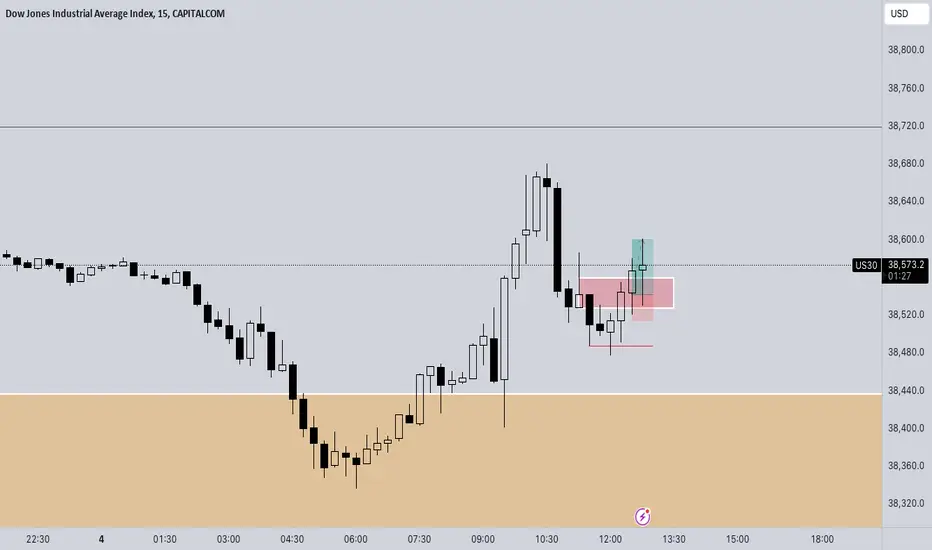
US 30 long - scalp trade Taken a nice scalp long on US 30.
Entry 38541
TP 38600
SL 38515
As long as we hold the FVG expect us to continue higher towards 38660
IF we fail to hold this will be an inverted FVG sending prices towards the HTF sellside (back into the yellow box)
Stay safe and never risk more than 1-5% of your capital per trade. The following analysis is merely a price action based analysis and does not constitute financial advice in any form.
Nifty Spot Levels - Run Upto Election OutcomeNifty in past 7-10 trading sessions...
trading in range 22200 to 22800 With Volatality (due to Geopolitical News and US Mkts and More Data from India and International Mkts).
But as we are awaiting Election Results...
Any DIP seems to be bought into with sentiments riding high on Current Government to Continue .... giving hope for all the major growth work to be carried out as an ongoing process without any hitch and taking Indian Economy to near $5 trillion.
Markets are supreme...
So have marked important Trading levels...
Happy Trading,,,

Nifty Midcap 50Super run up in past 15-20 trading sessions almost 1000 points...
Bias Positive
But supply coming near 14270 levels...
Have marked important trading zones...
Happy Trading....

NIFTY DAILY - 4/6/2024Nifty open with huge gap down and hit days low which is 21281 level with almost -1800 points which is more then -7% on daily chart.
Nifty was highly volatile due to Lok Sabha Election Vote Counting.
Index has formed shaven head candle on daily chart which indicates participants were selling from days high.
MACD is giving Crossdown.
Nifty has given closing at 21884 with -1379 points which is -5.93%.
further levels for nifty can be 21550 will work as support level and resistance will be 22050 level.
Bank Nifty levels
Support – 45854
Resistance – 47689
Today’s Advance Decline ratio of NIFTY50
Advance - 13
Decline - 37
FII Sell – 12436.22 crores
DII Sell – 3318.98 crores.
⚠️ Important: Always maintain your Risk & Reward Ratio.
✅Like and follow to never miss a new idea!✅
Disclaimer: I am not SEBI Registered Advisor. My posts are purely for training and educational purposes.
Eat🍜 Sleep😴 TradingView📈 Repeat 🔁
Happy learning with trading. Cheers!🥂

Bearish Divergence On The S&P 500Hey! I see bearish divergence on the S&P 500.
Expecting a pullback here.
This will make crypto drop.
Stay safe everyone.
- Dalin

RSI Divergence Also there is a formation Bearish RSI Divergence daily chart. On 15 January index reached a high of 22115 and the RSI value was at 74 today index reached a new high of 23043 but the RSI was at 67 this is a clear formation of RSI divergence.


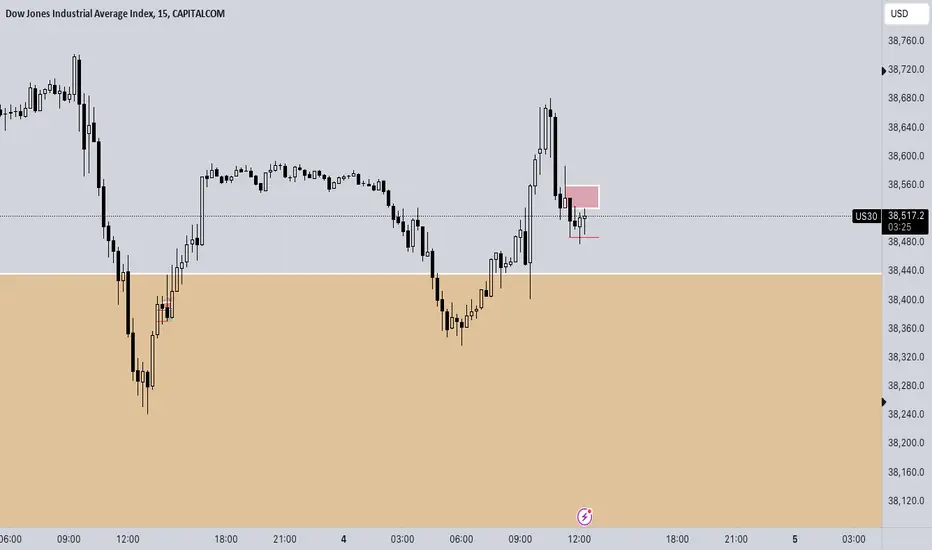
US 30 - Ranges overview We had a nice big range on Monday so let's see where we go from here.
Will be looking to see how we play the 5min FVG (red box) and the 5min sellside (red line)
No need to front run the market...be PATIENT...PLAN and EXECUTE
HTF buyside and sellside liquidity are clear (don't hesitate to zoom out to see it clearly)
Stay safe and never risk more than 1-5% of your capital per trade. The following analysis is merely a price action based analysis and does not constitute financial advice in any form.
DXY - Setting up to ease offThe DXY completed a bearish 886 gartley and broke down out of its rising broadening wedge, after this it broke back below a key level of significance before confirming it as resistance this past week.
As long as we stay below 105.3 the DXY is en route to lower prices, which in turn is bullish for the market.

DXY TargetLooking for potential bullish scrnario on Dxy it might or might not go to that tp but i am sure we will get a good amount of trades from that zone on lower timrframe

SENSEX S/R for 5/6/24Support and Resistance Levels: In technical analysis, support and resistance levels are significant price levels where buying or selling interest tends to be strong. They are identified based on previous price levels where the price has shown a tendency to reverse or find support.
Support levels are represented by the green line and green shade, indicating areas where buying interest may emerge to prevent further price decline.
Resistance levels are represented by the red line and red shade, indicating areas where selling pressure may arise to prevent further price increases. Traders often consider these levels as potential buying or selling opportunities.
Breakouts: Breakouts occur when the price convincingly moves above a resistance level (red shade) or below a support level (green shade). A bullish breakout above resistance suggests the potential for further price increases, while a bearish breakout below support suggests the potential for further price declines. Traders pay attention to these breakout signals as they may indicate the start of a new trend or significant price movement.
Disclosure: I am not SEBI registered. The information provided here is for learning purposes only and should not be interpreted as financial advice. It is important to consult with a qualified financial advisor before making any investment decisions. Tweets neither advice nor endorsement.

BANK NIFTY S/R for 5/6/24Support and Resistance Levels: In technical analysis, support and resistance levels are significant price levels where buying or selling interest tends to be strong. They are identified based on previous price levels where the price has shown a tendency to reverse or find support.
Support levels are represented by the green line and green shade, indicating areas where buying interest may emerge to prevent further price decline.
Resistance levels are represented by the red line and red shade, indicating areas where selling pressure may arise to prevent further price increases. Traders often consider these levels as potential buying or selling opportunities.
Breakouts: Breakouts occur when the price convincingly moves above a resistance level (red shade) or below a support level (green shade). A bullish breakout above resistance suggests the potential for further price increases, while a bearish breakout below support suggests the potential for further price declines. Traders pay attention to these breakout signals as they may indicate the start of a new trend or significant price movement.
Disclosure: I am not SEBI registered. The information provided here is for learning purposes only and should not be interpreted as financial advice. It is important to consult with a qualified financial advisor before making any investment decisions. Tweets neither advice nor endorsement.

NIFTY S/R for 5/6/24Support and Resistance Levels: In technical analysis, support and resistance levels are significant price levels where buying or selling interest tends to be strong. They are identified based on previous price levels where the price has shown a tendency to reverse or find support.
Support levels are represented by the green line and green shade, indicating areas where buying interest may emerge to prevent further price decline.
Resistance levels are represented by the red line and red shade, indicating areas where selling pressure may arise to prevent further price increases. Traders often consider these levels as potential buying or selling opportunities.
Breakouts: Breakouts occur when the price convincingly moves above a resistance level (red shade) or below a support level (green shade). A bullish breakout above resistance suggests the potential for further price increases, while a bearish breakout below support suggests the potential for further price declines. Traders pay attention to these breakout signals as they may indicate the start of a new trend or significant price movement.
Disclosure: I am not SEBI registered. The information provided here is for learning purposes only and should not be interpreted as financial advice. It is important to consult with a qualified financial advisor before making any investment decisions. Tweets neither advice nor endorsement.

Lets make to the top
All ideas are strictly my interpretation of price action. I am not a professional trader nor is this
professional advice.
