BTCUSDT.P Short BTCUSDT.P Short
ICT Concepts
1. Change of Character
2. Liquidity Grab+ Tap into Order block
3. Entry at FVG
BTCUSDT trade ideas

BITCOIN VISION 25/05 After rising by more than 20% since the beginning of the month, BTC is retracing slightly on Thursday.
We are currently in a daily order block on equilibrium.
I'm still a buyer on Bitcoin, so we'll see how the price reacts to this order block.
✅ The target remains unchanged: ATH.
Feel free to give me your take on Bitcoin in the comments.
Do you see a new ATH by the end of the month? Are you buyers? Selling?
Feel free to subscribe and put a boost on this post if you enjoyed my analysis, and tell me what you think!
Happy trading and a great weekend :)

🎉🎊 Congrats on the long! My next local scalps Trade 1: short
A reaction of previous supply for the beginning of the pullback to zone
Trade 2: long
A continuation play setup. We have broken out from the accumulation range at daily supply, this would be a secondary involvement at the pullback into demand. Note the pull back may not rally down to the POC, it could simply react off the old range high.
No change no trade
Follow for more

BTCUSDT - Bullish TradeThe price is in Bullish Trend depicting Bullish Flag Continuation Pattern.
The trade plan involves Instant Buying as Bullish Candlestick Patterns are already formed at LH.
No Bearish Divergence is formed.

There are two falling possibilities for BTCThe first possibility is that it has made a double peak, there is a possibility of it falling down.
Then it will go up again, make the right shoulder, create the obo formation and hit the bottom harder.
If this scenario occurs, the bottoms will be crushed excessively
There is no certainty in crypto, this is a possibility

HelenP. I Bitcoin can exit from pennant, and continue to riseHi folks today I'm prepared for you Bitcoin analytics. A not long time ago price declined to the trend line and then at once made impulse up to the support level, which coincided with the support zone. Soon, the price broke this level and made a retest, after which continued to move up to the resistance level inside the upward pennant. When BTC reached the 70500 level, the price broke it and rose to the resistance line of the pennant, but at once turned around and in a short time declined to the trend line, which is the support line of the pennant too, breaking the resistance level one more time. Next, the price some time traded near this line and then rebounded up to the resistance line of the pennant, which at the moment continues to trades near. So, for this reason, I expect that Bitcoin will continue to grow to a resistance level, thereby exiting from the pennant. Also then, I think BTC can break the resistance level, make retest, and continue to grow. So, I set two goals: 1st at the 70500 resistance level and 2nd at the 72500 points. If you like my analytics you may support me with your like/comment ❤️

THIS BTC CONFIRMATION CAN GET BTC TO 75KBTC looks interesting over the next time frames and it can show more increase. That's why we're keeping an eye on Bitcoin at this moment.
$68540 is a key confirmation zone. this level has already a confirmed, there's a high chance it could reach $75K - in the long term, and hype times can make the coin to the target faster.
Remember, there are no guarantees in the market. Always follow a consistent system based on your strategies and analysis.
Good times, everyone.
This update is not trading or financial advice.

BTCUSDT at hourly support, likely to bounce towards 71.2kThe price has hit the weekly resistance WR1 and has pulled back from there. The price has been pushed down from that resistance and it has now hit hourly support HS1 on this pullback. This support zone will provide support to the price and the price is likely to bounce enough for a long trade opportunity. We try this long trade towards weekly resistance around 71.2k area. If we lose this support then we are going likely for the daily support zone.

BTCUSD SELLBitcoin on more Selling pressure already we got 200 pips profit on last analysis...now more down side momentum captured let's take a short side with btcusd

BTC long idea @ 68.000CRYPTOCAP:BTC trade idea!
3-wave correction into resistance zone.
Limit entry at : $67,894.
Stop-loss: $66,000.
Profit target 1: $69,250.
Final target: $72,940.
BTC shoud resume the up move towards 74k area

BTC/USDT 4HInterval Chart ReviewHello everyone, let's take a look at the 4H BTC to USDT chart as we can see that the price has bounced off the upper boundary of the downtrend channel, potentially giving room for a stronger downward move.
However, if BTC tries to exit the channel again, the price must overcome a very strong resistance zone from $71,959 to $73,853. However, after breaking above this resistance zone, an upward impulse to the area of $83,029 will be possible.
Now let's move on to the stop loss in case of further market declines:
SL1 = $68,378
SL2 = $66,144
SL3 = $62,363
SL4 = $60,014
AND
SL5 = $56,634
Looking at the RSI indicators and the STOCH indicator, you can see how both of these indicators rebounded from the upper limit, which resulted in a downward price movement, with room for the price to recover more. It is worth mentioning here that the RSI indicator has approached the upward trend line, which is worth watching because relying on it may again result in an upward movement.

Chart Pattern Analysis Of Bitcoin
In this week or this month,
ETH And NVDA are the stars of the market.
I think the crypto market and AI stocks will still do better in the next season of the year.
But before the next bull run,
I am still cautious about the potential pull back of the month scale Wave(C) in the crypto market.
From K1 to K3,
It is a bearish three soldiers advancing pattern,
A short-term downtrend Or A large scale consolidation had started from K1.
The risk is increasing.
I will try to decrease my long positions if there are more bad signals from the following candles.

BTCUSDTBTC soon to ATH again, range 75K..
keep eyeing for btc..
i'm also consider for btc etf inflow very very strong from instutision..
and US House passes FIT21 crypto billUS House passes FIT21 crypto bill..
to the moon

BTC balance day and all eyes on this 4hour Equilibrium pattern.Balance day !
Just a reminder . After bigger moves there nearly always comes a time for a fast flush.
All eyes are on this 4 h EQ. Break Bull and quick 12h HL is set, that would give ALTS some time to get Rotation.
Today ALTS seems are also mostly balancing today. D Inside bars or boring range trades:
Traders & Algos are waiting for this BTC range to break.
Noone knows exaclty when a fast flush comes, but you can prepare low bids across different names!
In case it happens you have orders ready. When it happens its usually too late to plan !
Create for yourself a Trading view Watchlist of the ALTS you would want to buy for D or 4h or 12 H HL´s -
and plan those trades and have limit orders waiting.
Liquidation runs a re great opportunities for professional traders !

BTCUSDT LONG PROJECTION ✅Price is clearly in an uptrend,
And we have a breakout and retest to the demand zone where we go long ✅

BTCUSDT:Currently, it is suffering because the dominance of Bitcoin is turning red, Bitcoin itself is turning green, so it is more logical to open a position in altcoins than Bitcoin itself.
Open a short position below 69076, open a long position above 71484

BTCUSDT.1DBTC/USDT daily chart, several key technical indicators and levels stand out, providing insights into potential price movements.
Trend and Resistance Analysis:
The chart shows that Bitcoin (BTC) has experienced significant volatility, with the current price hovering around 66,707.40 USD. The price is currently testing the resistance level marked as R1, around 67,373.58 USD. A successful break above this level could see the price testing the next resistance at R2, which is around 71,320.28 USD. The overall trend appears to have a slight upward trajectory as the price has managed to break above a significant downward trend line.
Support Levels:
There are several key support levels identified. The immediate support level is labeled as S1 at approximately 66,000 USD. Below this, the next significant support levels are S2 at around 59,357.32 USD and S3 at approximately 56,447.95 USD. These levels have historically provided strong buying interest, which could prevent further declines if the price retraces.
RSI and MACD Indicators:
The Relative Strength Index (RSI) is currently at 58.91, indicating that the asset is in a neutral to slightly bullish zone. The RSI has been trending upwards, which suggests increasing buying momentum. The Moving Average Convergence Divergence (MACD) indicator shows a bullish trend with the MACD line (blue) above the signal line (orange)
, supported by a positive histogram. This suggests that bullish momentum is currently stronger.
Volume Analysis:
The volume pattern indicates that the price increases are accompanied by substantial trading volume, reinforcing the bullish sentiment. The volume spikes at key price levels suggest strong market participation during upward movements.
Conclusion:
In conclusion, the BTC/USDT pair is showing signs of a potential bullish breakout if it manages to stay above the R1 resistance level. The indicators, including a rising RSI and a bullish MACD, support the likelihood of continued upward movement. However, traders should remain cautious of potential retracements to the support levels at S1, S2, and S3, which could offer buying opportunities. Monitoring the price action around these critical support and resistance levels will be crucial for making informed trading decisions.
Overall, the market sentiment appears cautiously optimistic, with key levels and indicators suggesting a potential continuation of the upward trend, provided the resistance levels are successfully breached and maintained.

Short term trade ideaRSI, EMA, and trend lines all point bullish on the 15 min time frame. The Trend line sitting at roughly 71,150 would be good entry on a short. Bitcoin should come back to 67k. Take profit on short around 67k. Not financial advice

If there is anything in price history that resembles our..........current situation it is this.
back then the swings were wilder obviously. we need to ignore some noise.

BTC TIME FOR A FLUSH !? Hey fellow traders ! this is about timing and shortterm and midterm market cycles and trading psychiology as well as just the TA . I am as ready as one can be (( after running 32 positions over 2 weeks with 100´s of ,microtrades in between on ALTS , CRYPTO , US MJ ) . Ready for a fast flush or slow grind or a 4h range hold and continutation. Although my gut says quick drop after 4h HL range is lost. BTC H OS is at 68 k and prior POC is the red dotted line. Have my reentry ladders set for a quick drop and they go deep! I am exhausted. and tightened stops on so many positions. 31 green positions is another personal record and in this phase conserving profits while ZOMMING OUT is the most important skill to develop. ANd thats hard. sou need many cycles to learn this skill. And its really hard to time. so now we wait. In this phase i just love to : market close , market close open SWING runners. .Get a clean slate, but thats psychologically really hard after building these positions for over 2 weeks
Remember on a flush you either trade 1 ticker huge nd zoomed in or spread across a few tickers and have low enough bids to get quick fills. its impossible to puit orders in once a liquidity run happens., trading is planning . you plan and often you get rewarded sometimes you don´t . soemtimes you get punished but trust me- repeated planning will make you a better trader !
My ALTS for D HL´s if BTC sees H OS : LINK ETC FET SOL: and a few to reload with smaller size. tjhose ALTS with enough of a bounce back to W resistance to warrant a D HL to form aroiund D ema 12. Happy trading ! your Chartman Chris

Long trade
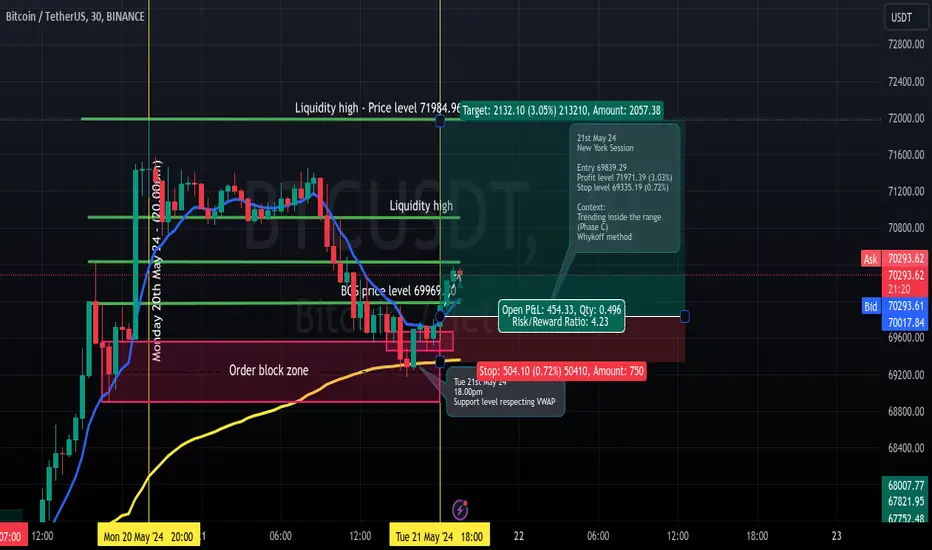
21st May 24
Entry 69839.29
Profit level 71971.39 (3.03%)
Stop level 69335.19 (0.72%)
Context:
Trending inside the range
(Phase C)
Whykoff method
💸#BTCUSDT | 1 HOUR TIMEFRAME UPDATE💸#BTCUSDT | 1 HOUR TIMEFRAME UPDATE
The objective for this UPWARD movement is to achieve $70,200 - $70,800 - $71,500 - $72,800 - $74,000🔼
Invalidation below $68,700 ❌

BTC from hereSince my last update, Bitcoin has successfully defended the range lows, and importantly reclaimed the mid-range where we currently trade just under $70,000 at the time of writing. From here we would want to see if the bulls are still in control - below is my take on where we could venture next.
Bullish Scenario
Prices hold and push for the range high’s. We could then see new all-time highs. There may also be a further move back to the range midpoint before the market moves higher.
Bearish Scenario
Failure for bulls to hold prices at these levels, as we are now at levels not seen since mid-April. Price moving below the range midpoint towards $66,000.
