Yields in the long runTaking a long term view, we should never forget what 10y yields did this year. We are in a era of high treasury returns, right in time as the governments safety is at its worst.
Government bonds

The BundThe bund is looking a bit bullish and thats a bit of good news i think especially with all this bearishness infecting pretty much everything well at least for a bit until joining the rest...

US10Y - consolidating TVC:US10Y will consolidating for a while. Can tell a direction until it breakthrough the resistance or the support.

Daily Bearish Cypher looking for 3.62% over the next 3-6 monthslooking at the daily chart, I see weakness on the 2yr treasury yield. There is a bearish cypher pattern on the daily chart. A great short opportunity would be near 5%..If it gaps above previous C-wave sell off that would be a buy up tot he short level near 5%...It can also short at this level. But overall based on my TA I see weakness. You also see similar in the 20yr treasury etf tlt

2023 Market Projections: Leading Indicators and AnalysisTVC:US10Y
The recent market response to data on CPI , PPI, and the selloff in the bond market, coupled with hints from the Fed about potentially raising rates towards 5% to 5.25%, provide important insights into where the markets could be heading in the coming weeks.
Looking at the weekly chart of the 10-year Treasury yield, we can see a massive rising wedge pattern with a bull flag inside the wedge . The break out of the bull flag last week has a target of 5% to 5.25%, which aligns with the Fed's projected peak policy and the top of the wedge in the chart. There are some bullish signs in this chart, a hidden bullish divergence on the weekly with both the RSI and MACD , indicating a bullish continuation of the trend. Additionally, there is a bullish divergence on the daily chart , as shared a few days ago.
These signals increase the likelihood of a bullish move in the 10-year yield, and if this plays out as projected, it could lead to high selling pressure in markets, including the stock market and crypto. Higher yields can reduce the profitability and spending power of companies and individuals, and make stocks and cryptocurrencies less attractive as investment options. It's important to keep a close eye on the bond market and monitor any potential impacts on other markets.
This could mark the final leg down or a bottoming process in the current bear market, with the last leg down typically being a massive one. In the coming weeks, there may be a triple bearish divergence that develops on the 10-year yield, which could signal a nearby bottom in bonds. The stock market is expected to follow suit weeks later.
It's worth noting that this analysis is based on confluence and projections around recent developments, leading indicators, and technical analysis projection methods. However, there are no confirmations on many aspects of it yet, and there is always a degree of unpredictability in financial markets. Therefore, it's important to acknowledge the uncertainties and potential risks involved in making projections based on technical analysis . It's also important to emphasize that this is not financial advice, and readers should always do their own research (DYOR) before making any investment decisions. Seeking professional financial advice before making significant investment decisions is also highly recommended.

10-Year Treasury Yield Ready to Extend Advance to 2022 Highs?The 10-year Treasury yield has been rising since the end of January in the aftermath of a Bullish Morning Star candlestick pattern.
Now, prices are approaching the December high at 3.905 after confirming a breakout above a falling trendline from October.
Meanwhile, a bullish Golden Cross is set to form between the 20- and 50-day Simple Moving Averages, further offering an upside technical bias.
Confirming a breakout above the December high exposes the 78.6% Fibonacci retracement level at 4.118 towards the 2022 peak at 4.335.
US10Y

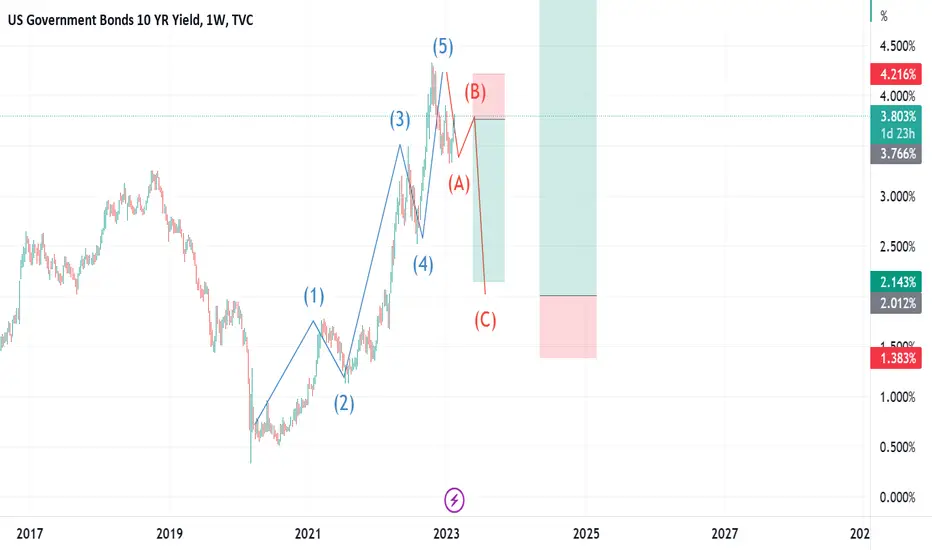
Elliot would have bond yields for a correction now. Out of the low we have 5 clear waves up. We've got the big spike out 5 and also around this time we have a mass acceptance/expectation of the rally in this going further.
This looks like a breakout, it looks like it's going higher - but in the EW cycle it would be due a sharp down first.
(This is TA. Not a fundie forecast, but news sometimes catches up)
Time to buy short duration treasury bonds?The Fed funds rate is higher than the 30 year treasury interest rate.
The last time that happened was in 2000 and 2008.
What happened back then was that the stock market and the 2 year treasury interest rate both dropped significantly.
Will history repeat itself?

US 10 YEAR YIELDS (LONG ANALYSIS)The US10Y has moved as we expected from our first analysis and up 11% SO FAR🙌. We have finally seen a break above the wedge, indicating that bullish momentum is getting stronger. We still have plenty more upside to go, for the rest of Q1.
This long analysis is positively supported by DXY bulls & Gold bears, which we are currently witnessing take place as well. All markets playing out well!


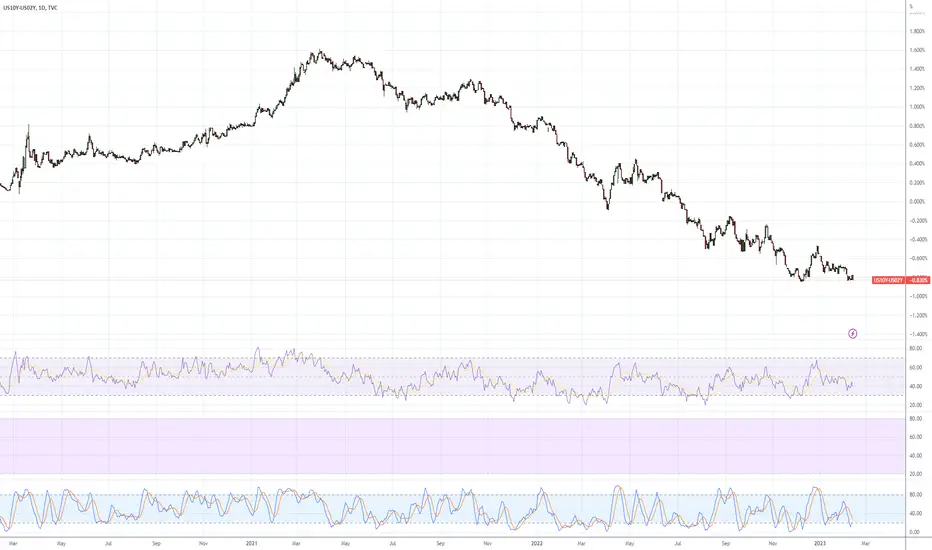
Yield InversionReally strange market, the yield inversion continues to grow. This site actually allows price calculations, this is 10Y yield minus 2Y yield.
Stock market still acting bullish, but I'm not feeling it.
what do you think about 5 years breakeven ratehi all
as you know this will efect directly on crypto and because of this i did this analysis
so i think it will drop to the red area
what do you think ?
The information provided on this Page does not constitute investment advice, financial advice, trading advice, or any other sort of advice and you should not treat any of the website's content as such. this page does not recommend that any cryptocurrency should be bought, sold, or held by you. Do conduct your own due diligence and consult your financial advisor before making any investment decisions

Bond Yield Update2Y bond yields still melting up
This leads me to believe that tomorrow is gonna be a pump and dump, nobody expecting a rate cut soon, and market still needs to price in a rate hike for July.
The algos still have to make their money, so I expect a gap up then a sell off as bond traders price in a rate hike. Remember the inflation target is 2%, the expected numbers are:
Expected CPI Tuesday 5:30am
USD CPI m/m 0.5%
USD CPI y/y 6.2%
USD Core CPI m/m 0.4%
I think the numbers come in as expected, the market pumps it because it's better Y/Y but then sell off because of M/M numbers like Europe did last week.

US Government Bonds 10YR Yield LONGUS Government Bonds 10YR Yield. Time-frame = 1 month. In 2005-2007 (red circle) - a double top was built (determined automatically by my script) from which the downward movement began for further accumulation. 2009-2019 (green rectangle) - long-term accumulation (balance). 2019-2022 (blue circle) - responsive activity (long entry by key players). 2022-2023 long to the upper limit of the balance. The last 3 months - a retest to one of the key balance levels. 2023 - expect further upward movement towards the 5.000% area (towards the upper border of the double top)

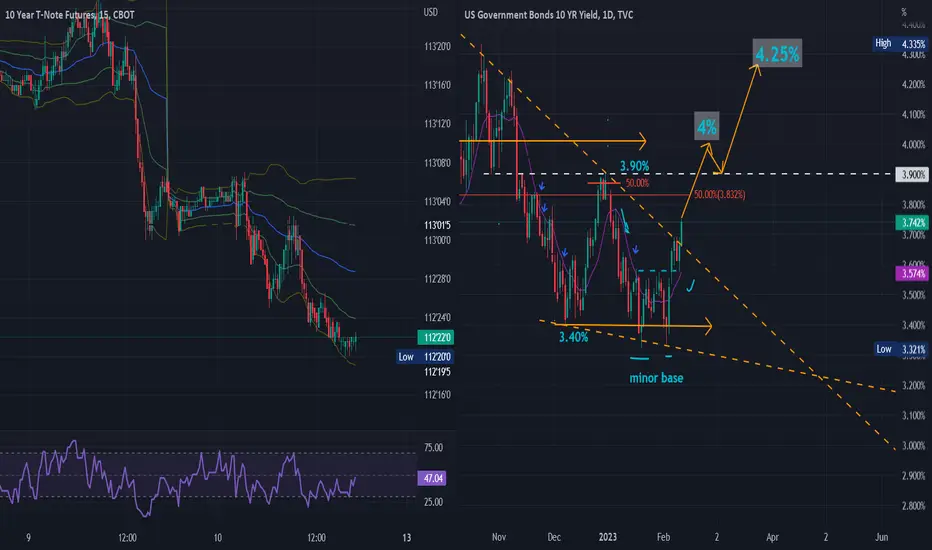
US 10-year yields could test 4% after breaking out of wedgeFollowing the blowout non-farm payrolls number (Feb 3rd), 10-year yields enjoyed a productive week, confirming a minor base in the 3.33% area ahead of a falling diagonal breakout. This has the 10-year poised to re-test 3.90% with possible room to test the psychological 4% region. Look for over-stretched daily indicators to limit potential upside after Tuesday's US Inflation report. That said, a hotter CPI print could trigger a move to 4% easily! At that point, 3.90% would likely become support for a long-term target of 4.25% to 4.35%. If, however, the 3.90% region proves to be more resistant than expected or perhaps isn't even tested, then the 3.58% to 3.40% area will largely determine whether US 10-year yields are continuing to trend higher.
Sell ZN (10-year futures) @ spot (112'22) or Buy ETF TBT @ 30
Target: ZN 112 (1st) 110 (2nd) TBT 32.67 (1st) 40 (2nd) target***
Stop: ZN 114 TBT 28.13
Yield inversion vs SPX - We are building a baseSPX goes up as the yield inversion builds a base and starts rising.
Best time to sell at the top is when yield curve starts curving up.
The key is looking at the RSI levels.
For DOT COM bubble + financial crisis, RSI started going up. Clear bullish divergence.

US10Y : Comparison with the EFFRThese last few days have seen bond yield rising. It is as a direct result of the recent 25bps rate hike.
If you look at the chart above, which is the US10Y less the EFFR, it seems the difference had reached the MAXIMUM based on historical results. Which means to say, the US10Y had already reached the MAXIMUM. From now on, any rise would be in lockstep with the amount of future potential rate hike.
We can also see that once the above difference reached its historical low, the next question that arise is when the Fed will start to PIVOT and cut rates. If you look at 2007, it can actually take some time.
P/S : As always, do not just believe what I say. Use your common sense.

What Makes this Yield Curve Inversion so Different?An Inverted yield curve in the context of a 2% inflation environment holds a different meaning than, an Inverted Yield Curve in a high inflation environment......
Market Expectations of Disinflation led to this Inverted Yield Curve:
The Nominal Inversion of the yield curve is caused by the expectation that inflation will fall steadily. Believe it or not an Inverted Yield Curve is the best case scenario for the Fed. A Nominal Inversion during a high inflation period shows that markets have confidence/belief in the Fed's Policy to bring inflation down to 2%. Most of the inversion seen in the yield curve today is nominal....
The Nominal Yield Curve vs. the Real Yield Curve:
Nominal Yield – Real Yield = Breakeven Inflation Rate.
Real Yield = Nominal Yield - Breakeven Inflation Rate
The Breakeven Inflation Rate represents what inflation would have to be in order for investors to “break even” when buying a bond. The general thought process is: If you believe the inflation rate will be greater than the breakeven rate buy Treasury Inflation-Protected (TIP) bonds.
Notice how the Yield Curve for Nominal Yields is a lot more Inverted than the Yield Curve for Real Yields. Hence, the inversion in today's Yield Curve is mainly nominal. Below I calculate out the Real Yield for the treasuries with Breakeven TIP Data from FRB St.Louis.
Nominal Break-even
US02Y: 4.3% - (RealYield) = 3.0% = 1.3% RealYield for US02Y
US05Y: 3.6% - (RealYield) = 2.3% = 1.3% RealYield for US05Y
US07Y: 3.6% - (RealYield) = 2.4% = 1.2% RealYield for US07Y
US10Y: 3.4% - (RealYield) = 2.2% = 1.2% RealYield for US10Y
US10Y/US02Y Nominal Yield Curve: 3.4% - 4.3% = -0.8% (Inverted)
US10Y/US02Y Real Yield Curve: 1.2% - 1.3% = -0.1% (Inverted)
The bond market expects for inflation to remain above trend the next 1-2 years and decrease dramatically after that. As you can see, the nominal yield curve is very inverted even though, the real interest rate is pretty much held constant across thee curve. The Real Interest Rate remains between 1.3% and 1.2%. The Yield Curve Inversion in Nominal terms is: -0.8% and in Real Terms is: -0.1%.
Partners in Crime: Unemployment and the Yield Curve:
When consumers start to save more, companies start to see earnings deteriorate. In turn, they cut costs by letting workers go. The US10Y/US02Y yield curve is a proxy for Unemployment. Unemployment rises as, the market starts to expect rate cuts from the fed. It is only when the spread on the US10Y/US02Y starts trending up does unemployment start to rise. The spread of the US10Y/US02Y yield curve starts to trend upwards when the 2 year rate plummets as, markets start to price in a recession. Currently, the Yield Curve is still declining signaling that unemployment will remain low.
So what does this all mean???
A recession is not as close as many people are saying. People have been calling for a recession since April. This yield curve also signifies that markets are more or less believe that the fed will engineer a soft anding and bring inflation back to the 2% target. If you don't believe the disinflationary narrative spread by the fed there is an opportunity for you to make money on what markets are mispricing.
What will you do the next time a fake guru waves an inverted yield curve in your face to scare you into a subscription?

Are the FED hike rates really peaked?Whenever we sow down crossing between FED fund rates and US 2Y yield bull market started (BTC, SPX ...). Now that crossing seem to happen even now but in the past it never happened if inflation was above them.
Can we expect inflation to start rapidly falling in next weeks and months to go below fund rates and yield?

Weekly U.S. Treasuries Analysis (Week 07/2023)First Thing First: This analysis is for “general overview only” as it is solely based on price action. That’s why it is called momentum analysis in the first place. Support/Resistant, Volume Macro view nor any other factors are not used during write up. Refer to the individual pair analysis for a more comprehensive write up.
US1Y: Bullish
US2Y: Bullish
US5Y: Bullish
US10Y: Bullish
US30Y: Bullish
S&P Index: Bearish
WK 07 (11 Feb 2023)

US 10 YR Yield vs SPX hit a resistance that started other bottomZoom out and in Oct US 10 Year yields hit a supply level from Dec 2018 which started that big rally, we rejected hard from that in Oct. Now heading into resistance on shorter timeframes that started the other two major equities bottoms. If this rejects here which I think it can that will keep the rally continuing.

Bond Yields 1 vs 2 yrThere's still an inversion between 1 and 2 yr bonds, which means the market still has a rate cut priced in for next year. On top of that, it looks to me like we're headed over 5% this year, so even the 1 yr needs to go up.
What's interesting is that the rate inversion started at the same time as the market rally, last Oct.
I dunno if the market fixes some of that Tuesday or just gets all pumptarded because inflation only went up .5% m/m like Germany did, lol. .5% m/m extrapolates to 6% yearly, and it took then a few hours to figure it out, lol. Remember the target inflation is 2%, and it;s gonna require more than one more rate hike to drop it down.
Pretty good chance Tuesday winds up being a pump and dump like Europe, but I'm gonna carry a small position in TLT and BITO puts. Decide against doing a straddle.

10Y US bond Yield at important junctureNear important Trend resistance and 200 MA, if passed it could trigger sell-off sentiment on equity markets
www.tradingview.com
