Long XAUUSD, 8HLong XAUUSD, 8H
entry 2336.380 - 2321.240
sl 2277.045
tp scalp 2395.330
tp1 2478.681
tp2 2572.173
move sl to entry after price reach 2395.330 ; price shouldn't retest entry again.
OANDA:XAUUSD
Futures market

Long opportunity on Goldhello friends,
I see a long opportunity on gold up to 2370 region.
from there, we will expect a correction and wait for next confirmation.
trade safe,
alex

XAU/USD PREPARING TO SHORTXAU/USD 1H - As you can see price has traded perfectly into an area of Supply I had marked out that I wanted to see price reject from. This is an area of Supply we could look to trade this market short from.
In order for us to get an entry now, all we need to do is look for a small pullback into a fractal area of supply giving us a more refined entry on this market. We will find this within the most recent bearish move to the downside.
When it comes to placing our short we will need to see price trade into this fractal area of Supply and reject well, from there we can look to place our SL above the zone we enter from and our TP just above the area of Demand.
If you wanted a less refined entry you could have looked to place a short position in or around the area of Supply provided with your SL above that zone and TP down at the area of Demand. Your Entry all depends on how aggressive your approach is.

WTI Crude Oil Price Shows Bullish Trend Ahead of OPEC MeetingWTI Crude Oil Price Shows Bullish Trend Ahead of OPEC Meeting
As the chart indicates, on Monday, the price of WTI crude oil rose by approximately 1%.
Reuters reports that the bullish sentiment is driven by:
→ the upcoming OPEC+ meeting scheduled for 2 June;
→ expectations of high fuel demand with the start of the summer driving season and holiday season in the US.
Conducting a technical analysis of WTI crude oil on 10 May, we drew an ascending channel in blue and suggested a scenario of continued price growth within this channel.
Since then:
→ the price formed a low on 15 May at the level of 76.35, but quickly recovered from it. Thus, the bears' attempt to break the low of 8 May at the level of 76.68 quickly failed. In other words, there was a false breakout of the 8 May low.
→ A similar pattern occurred on 24 May – the price dropped below the 15 May low of 76.35, but quickly recovered.
Two false bearish breakouts are a bullish sign. And the strong behaviour of WTI crude oil prices on Monday confirms this.
Analysing the XTI/USD chart today, it is important to note that:
→ the price movement in April-May forms a descending channel (shown in red);
→ this decline since 5 April may be a correction within the larger ascending blue channel;
→ the price quickly returned to the blue channel, briefly dipping below its lower boundary;
→ the price is near the upper boundary of the descending channel.
Thus, conditions are being created for the end of the corrective movement. The bears' inability to hold the WTI oil price at new lows may be used by the bulls to resume the upward trend. It is also possible that news related to the OPEC+ meeting will contribute to this development.
Start trading commodity CFDs with tight spreads. Open your trading account now or learn more about trading commodity CFDs with FXOpen.
This article represents the opinion of the Companies operating under the FXOpen brand only. It is not to be construed as an offer, solicitation, or recommendation with respect to products and services provided by the Companies operating under the FXOpen brand, nor is it to be considered financial advice.

GOLD SELL NOW!!!!!!!!!!Again on gold we completed +60pips from entry today again we made another possible price rejections price heading to create a new low am going in on a short with tp 2277
JOIN AND ENJOY......

Three Plans to short gold :Three Plans to short gold :
A wait for 0.618 pull back @2402.50
B: check the structure at 2375 , if we see
the price can no longer go above this level
we can take a short
C: Bearish Continue , Price break down 2325
find a chance to short
Possible Combo:
B + C
A + C
Long term target: 2200 for a big strike

Xauusd today possible tradesXauusd is moving between key levels 2340 and 2350 possible buys above after breakout of key level 2360 with retest and possible sell below 2350 with tp 2345

goldAs long as the roof of the red channel is not broken,
the bearish pattern of the double top is suspected.
The failure of green support can also increase the possibility of forming this pattern

Strifor || SILVER-23/05/2024Preferred direction: BUY
Comment: After yet another historical and local record for metals , this market began to correct faster than currency pairs. In silver , in particular, we have recorded a local maximum and are now confidently moving towards the support level of 29.77800 . Near this level, we consider long according to scenario №1 , taking into account the context. We also do not exclude scenario №2 , which involves buying at the 29.00 level. In both cases, we do not consider the target above the level of 31.80 , where this correction started.
Additional comments on this trade will be provided as situation changes. Follow us!
Thank you for like and share your views!

WHEAT, start planting now for a MASSIVE HARVEST...WHEAT: BOUNTIFUL HARVEST SOON... if you seed at the current price range.
KEY NOTES:
WEEKLY DESCENDING TRENDLINE BREAKOUT.
Monthly shifting price lines. HUGE HINT!
Weekly histogram higher lows.
MONTHLY HISTOGRAM SHIFT -- CLOSING UP TO BREAK SOON.
SEEDED LONG (long term) 628.0
TAYOR.
Safeguard capital always.
-----------------
RELATED NEWS:
WSJ ARTICLE:
Severe Drought Stunts Great Plains Wheat Crops
Harvest in nation’s breadbasket forecast to be the worst in 60-plus years
June 17, 2023 10:09 am ET

GOLD-Short-term downtrend is formed💥Gold prices (XAU/USD) rose sharply on Monday. A softer US dollar (USD) and renewed escalating geopolitical tensions in the Middle East provide some support for gold.
In the long term, the precious metal could be supported by growing gold demand from central banks. However, lower bets on a Federal Reserve (Fed) interest rate cut this year and a hawkish stance from Fed officials could cause some selling pressure on XAU/USD because it makes gold less attractive as a store of value when interest rates rise.
💥On Monday, US banks will be closed due to the Memorial Day bank holiday. Gold traders will get more cues from the Fed's speech on Tuesday. The first data on first-quarter US Gross Domestic Product (GDP) on Thursday will be in focus, with estimates expected to grow 1.5% in Q1. Stronger-than-expected data could boost greenback and put pressure on USD-denominated gold.
💥Gold is trading below the EMA 34 and 89 around the price level of 2443. Gold is on its way to the first resistance zone at 2353. When this resistance level is broken, 2370 will be where gold will encounter real obstacles. when you want to move up to 2400. In the opposite direction, when the gold price drops due to US economic factors, the support areas 2320 and 2305 will support the gold price to increase again.
💥Trading signals
BUY zone 2318-2320 SL 2315
BUY zone 2305-2303 SL 2300
SELL zone 2353-2355 SL 2360
SELL zone 2370-2372 SL 2375

Strifor || SILVER-21/05/2024Preferred direction: BUY
Comment: A long with little potential can be considered for silver in the next 1-2 days . Let us remember that earlier we also considered purchases near the level of 30.50-31.00. These trades were closed with profit and can be viewed in the profile.
Just like with currency pairs, here we are considering a small potential for strengthening against the US dollar against the backdrop of previous transactions. We are considering both scenarios presented on the chart for entering a long position, but still the more probable scenario №1 , which assumes maximum growth from current prices. In any case, a target above the level of 33.00 is not considered for today.
Additional comments on this trade will be provided as situation changes. Follow us!
Thank you for like and share your views!

Gold's correction to continue its uptrend💥The gold market is being greatly affected by the Fed's policy stance on the length of time it takes to cut interest rates. Experts say that US inflation reports are still not as expected. Thereby, the timing of the Fed's interest rate cut is unclear.
💥Gold's recovery over the past several months has been largely driven by central bank buying, especially demand from Chinese investors. However, gold becomes more difficult as central banks around the world are starting to diversify the USD with assets that have other redeemable values besides gold. These factors will certainly hinder the momentum for gold going forward.
💥In the long term, despite the Fed's tough arguments on monetary policy in recent times, gold will still maintain its upward momentum in the coming time. Analysts on Wall Street believe that the market must lose more time than expected for the Fed to determine for sure whether inflation has actually decreased or not. Therefore, gold will remain stuck in monetary policy for quite a long time.
💥Technically, gold is trading around EMA 34 of the D1 time frame, showing that the recent two-day consecutive price decrease has not completely reversed the main trend of gold. The strongest retracement level that can be reached today is 2305. In the opposite direction, gold price can be pushed to the highest level of 2370
Support: 2325 - 2311 - 2305
Resistance: 2355 - 2370 - 2397
Breakout and retest: 2374 - 2320
SELL price range 2370 - 2420 stop 2375
BUY price range 2321 - 2419 stop 2315 (scalping)
BUY price range 2305 - 2303 stop 2300

XAUUSDCurrently, gold is on a strong recovery path, reaching 2,354 USD, about 15 USD higher than the same time yesterday. This upward momentum is supported by the weakness of the US dollar. The DXY index fell nearly 0.1% from 104,747 to around 104.64 points, creating favorable conditions for this precious metal.
In the short term, gold's target remains the 0.5 - 0.618 Fibonacci retracement level, located around the $2,380 area as indicated on the analysis chart.

The price increase is still ongoing!Hello everyone! Let's dive into the gold price movements today!
Currently, gold is on a strong recovery path, reaching $2,354, which is about $15 higher than the same time yesterday. This upward momentum is supported by the weakening of the US dollar. The DXY index has dropped nearly 0.1% from 104.747 to around 104.64 points, creating favorable conditions for this precious metal.
In the short term, gold's target remains to reach the 0.5 - 0.618 Fibonacci retracement levels, which is around the $2,380 area as indicated on the analysis chart.

GOLD: We are in the Leading diagonal pattern. Expecting 2K belowDISCLAIMER : All labelling and wave counts done by me by manually and i will keep change according to the LIVE MARKET PRICE ACTION. So don't bias, hope on my trade plans...try to learn and make your own strategy...Following is not that much easy...I AM NOT RESPONSIBLE FOR ANY LOSSES IF U TOOK THE TRADE ACCORDING TO MY TRADE PLANS....THANKS LOT..CHEERS


NQ Power Range Report with FIB Ext - 5/28/2024 SessionCME_MINI:NQM2024
- PR High: 18956.00
- PR Low: 18905.00
- NZ Spread: 114.0
Key economic calendar event
10:00 | CB Consumer Confidence
Holding above Friday's highs
- High vol session open value decline
- Wide PR/NZ spread
- HIgh volume open from long holiday weekend
Evening Stats (As of 12:05 AM)
- Weekend Gap: N/A
- Gap 10/30/23 +0.47% (open < 14272)
- Session Open ATR: 235.95
- Volume: 95K
- Open Int: 250K
- Trend Grade: Bull
- From BA ATH: -0.5% (Rounded)
Key Levels (Rounded - Think of these as ranges)
- Long: 19246
- Mid: 18106
- Short: 17533
Keep in mind this is not speculation or a prediction. Only a report of the Power Range with Fib extensions for target hunting. Do your DD! You determine your risk tolerance. You are fully capable of making your own decisions.
BA: Back Adjusted
BuZ/BeZ: Bull Zone / Bear Zone
NZ: Neutral Zone

XAUUSD (GOLD), bull get a power. Growth to 2372Hi friend. Bulls just formed powerful accumulation zone "1" and we have upward trend to 2364, 2372. Follow me. And read previous idea.

Daily live trade with XAUUSD in 15m/30m/1h 20240528Daily live trade with XAUUSD in 15m/30m/1h 20240528

Intraday Trading Strategy for Gold: Navigating Price Movements In the displayed chart of Gold Spot versus U.S. Dollar, there are indications that after a bullish daily close, the price of gold is likely to attempt a retest of the resistance level. From the image, we can see that the 'Buy' level has already been taken at 2,350.292, while the 'Breakout' level is noted at 2,358.323. This suggests there is sufficient momentum to push the price towards higher resistance levels.
Above the 'Buy' level, several 'Take Profit' levels have been set at 2,364.385, 2,367.416, 2,371.963, and 2,378.784. This indicates a prepared strategy to capitalize on profits at specific price points as the price ascends.
The 'Stop Loss' level is set at 2,346.195 to mitigate risk in case the market moves against the prediction. This approach reflects a cautious risk management strategy while still optimizing the potential for profit from bullish market movements.
This entire setup reflects a well-thought-out trading strategy, with planning to maximize potential gains while limiting losses, which is crucial in commodities trading like gold.

Silver Buy SignalOn the 1-hour timeframe, buying begins, marking the end of the downtrend. The first sign of upward movement is observed. The price revisits the previous low with low volume but is unable to break lower, indicating selling pressure is absorbed by buyers. There is evidence of buyer accumulation for an upward movement, and smart money starts to buy at low prices. Signs of strength emerge as demand outweighs supply.
I am waiting for the price to go back to 30.678 for candlestick confirmation for my entry.
Entry: 30.678
Take Profit: 32.108
Stop Loss: 30.219

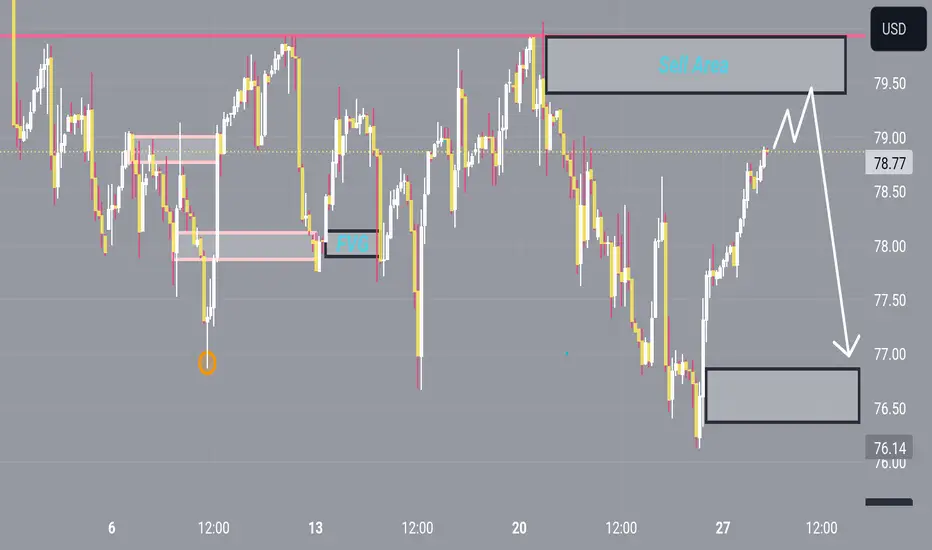
USOIL sell side Hey there on 2hTF the USOIL has looking today sell scenario can be retest from 79.00
79.50 can there again slip downside continue will looks for next support 77.50