Gold Bullish BiasGold Bullish Ride
SL and TP levels marked,
ENtry at CMP
fib level marked, trend continuation
Futures market

USOILRSI indicates Bullish Divergence. Which means that at any time the market trend can change to HH and HL.
Order type : buy stop
Entry : 78.82
SL : 77.38
TP1 : 78.82
TP2 : open

XAGUSD : a cup and handle on the logarithmic monthly chart.
The logarithmic chart of XAGUSD with three-month candles highlights a classic "Cup and Handle" formation, which is typically a bullish continuation pattern, indicating a strong likelihood of long-term price appreciation.
The cup formation is evident with a rounded base that began in the 1980s, peaking in 2011 near $50. The subsequent correction has formed the rounded part of the cup leading up to the present.
The market currently appears to be forming the handle, characterized by a lateral consolidation or slight downward movement before a potential bullish breakout.
Support and Resistance Levels
- Key Support: Immediate support levels are around $26.75,28$ and $30.47.
- Key Resistance: Major resistance levels to watch are around $34, $35.43, $40.28, $44.29 and $47.60.
Price Projections
Based on the "Cup and Handle" pattern and technical analysis:
- Short-Term Projection (1-2 years): After breaking out from the handle, silver could test resistance levels around $40-$45.
- Medium-Term Projection (2-5 years): Continued bullish momentum could drive prices towards $60-$70.
- Long-Term Projection (5-10 years): Given the historical pattern and fundamental support, silver could potentially reach $150-$300 per ounce, aligning with the upper trajectory shown on the chart.
Fundamental Analysis
Global Economic Conditions:
- Economic Growth and Recession Risks: Silver demand as a safe-haven asset increases during economic instability or recession. Current projections indicate growth for Central Europe, but Western Europe, especially Germany, faces industrial production declines and persistent economic challenges. The global economic outlook remains uncertain, with sub-trend growth in many advanced economies due to restrictive monetary policies aimed at controlling inflation.
- Inflation and Monetary Policy: High inflation is a critical factor affecting silver prices. Central banks, including the U.S. Federal Reserve, maintain restrictive monetary policies to combat inflation, influencing commodity prices like silver. As inflation moderates, potential interest rate cuts could positively impact silver prices.
Geopolitical Factors:
- Geopolitical Tensions: Silver prices respond to geopolitical events, increasing market uncertainty and demand for safe-haven assets. In 2024, potential conflicts and heightened tensions between major economies such as the U.S. and China, and ongoing conflicts in Europe and the Middle East are significant factors.
- Trade Wars and Tariffs: Trade tensions and tariffs disrupt global economic stability, influencing silver prices. Significant developments in U.S.-China trade relations or other major economic policies can shift investor sentiment towards commodities like silver.
Growing Demand for Silver
- Industrial Demand:
- Photovoltaic Cells: Silver is a key component in photovoltaic (PV) cells used in solar panels. The demand for silver in this sector has been growing significantly. In 2021, the solar industry consumed approximately 105 million ounces of silver. With the increasing focus on renewable energy, this demand is projected to grow by 8% annually, potentially reaching 140 million ounces by 2030.
- Electronics and Automotive Industries: Silver is extensively used in electronics due to its superior conductivity. The automotive industry, particularly with the rise of electric vehicles (EVs), has also increased its silver consumption. The EV market alone is expected to consume around 55 million ounces of silver annually by 2030, up from approximately 45 million ounces in 2020.
- Medical Applications: Silver’s antibacterial properties make it valuable in medical applications. The medical sector's demand for silver is projected to grow by 6% annually, driven by increased use in medical devices and coatings.
Energy Markets
- Correlation with Oil Prices: The correlation between the U.S. dollar and oil prices is notable. As the U.S. becomes a net energy exporter, shifts in oil prices due to geopolitical and policy changes impact broader commodity markets, including silver. Higher energy prices can increase production costs for silver mining, potentially reducing supply and driving prices up.
Conclusion
The formation of a "Cup and Handle" on the XAGUSD chart indicates significant long-term bullish potential. Supported by robust fundamental factors such as economic uncertainty, persistent inflation, geopolitical tensions, and growing industrial demand, silver could see substantial price appreciation in the coming years.
For detailed analysis and regular updates, continue following my posts on TradingView.

USOIL Will Go Up From Support! Long!
Take a look at our analysis for USOIL.
Time Frame: 12h
Current Trend: Bullish
Sentiment: Oversold (based on 7-period RSI)
Forecast: Bullish
The market is approaching a key horizontal level 77.11.
Considering the today's price action, probabilities will be high to see a movement to 79.91.
P.S
We determine oversold/overbought condition with RSI indicator.
When it drops below 30 - the market is considered to be oversold.
When it bounces above 70 - the market is considered to be overbought.
Like and subscribe and comment my ideas if you enjoy them!

XAUUSD: Trend in 2H timeframePlease pay special attention to the accurate trend, colored levels, and red level as SL.
>>>>>>>>>>>>>>>>>>> The setup is very sensitive <<<<<<<<<<<<<<<<<<<<<<<<
Be careful
BEST
MT

NQ Update April 1st Post (4-18-24)The White arrows to the right side are KL's. 18700 YTD High, 17027 YTD Open and 16300 YTD Low. The white dash is Mid Level of YTD Range. 4/1 Post, we have hit lower target and my see some retracement back up, not looking for a KL 18590 retest. Use Yellow dots as targets for next move. Yellow diagonal TL is next retest and TLX 17867, may see sideways with slight lift prior to another drop.
Interesting chart on S/P, we may be heading back into a Dead Zone.

GOLD SELLBased on weekly TF, the RSI is showing divergence which shows that the market has reached overbought level. Plus the previous weekly bearish engulfing candle shows sellers are in control of the current trend. Daily TF is also showing bearish movement.
We could see further down trend of the market should the sellers continue giving pressure

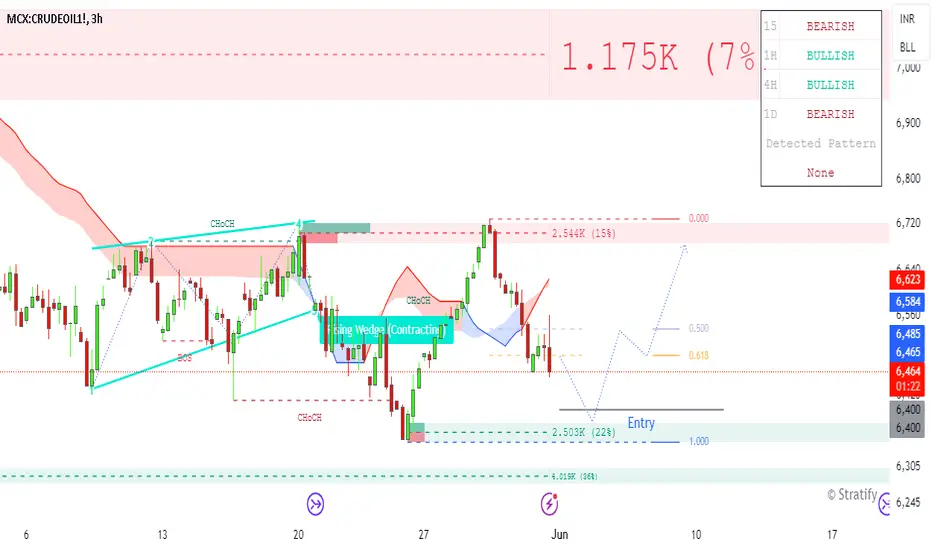
CRUDEOIL Buy Setup 3 hrs TGT with in a 3 daysSuper valid-looking! Leave a comment if you like my entry setup. This share is for educational learning purposes only, and I am not responsible for your profit or loss. Note: For more details, check the chart."
SILVER - Double topIf gold is in a decline mode silver is dropping too...
Silver started to print its double top a bit later than gold but it's heading to the neckline at 30.058$.
We might backtest the breakout again at 26$ in a few weeks.
And also notice on the XAUXAG chart silver printed a daily swing yesterday :
It might want to backtest the triangle~s lower trendline.
If the XAUXAG chart moving up the silver decline will be much more severe.
Prepare for the double top to break down soon !

XAUUSD (Toward 2327!!!) or yet... Technical Analysis of Gold
The price remains stabilized in the bearish area, as indicated by the closing of the 4-hour candle below the support line. The price is expected to move between 2348 and 2327. As long as it trades below 2347, a drop to 2327 is anticipated.
The bullish scenario will be activated if the price stabilizes above 2348, targeting 2364 and 2369.
Pivot Price: 2344
Resistance Levels: 2354, 2369, 2388
Support Levels: 2327, 2318, 2304
Today's anticipated trading range is between the support level at 2302 and the resistance level at 2355.
previous idea:

Silver International : Entering Buy Zone . Silver 60 Min chart is in Downtrend at 80 Degree slope (Sign of Reversal at Support zone)
Entering Buy Zone .
Waiting for Price Pattern to Change HH-HL
and candlestick Green.

Natural Gass CompassIn this one I use my preferred charting tool that uses data points from the past: Curved Trendlines. While there are other variations of such lines that I might use depending on the context, in this case the pattern low-high-high or high-low-low is widely detected as relevant and used as such for mapping out potential forces and support/resistance zones.
As you can see there is a relevant potential support zone validated by both the white curve and the blue curve which overlap further in time. There will be no surprises if the these levels keep holding the price for a while.
The yellow one is the weakest one in my opinion, because of the peculiar case on natural gas that doesn't provide much options for such support/resistance lines, because of the X high that was created in a strong but weird position relative to past highs and lows. Meaning that if the yellow is broken on the up, it might not even matter in the future because a different setup might unfold, creating a totally different type of line in any type of pattern regarding previous highs and lows.
What I like about these lines is that the relevant ones tend to provide clear cut cases of rebounds (example in the white dot), retests after break (green dot), or even pure power breaks with no comebacks (yellow dot).
The scenarios I find important in this picture are the following:
- the obvious potential rebound from the white and blue
- the less obvious but very important break on the downside of the white and blue which has a higher chance of a retest because of the significance of these lines (these retests tend to happen for these long lasting lines with many data points)
- supposing the yellow line does hold, or if another similar resistance line appears after another high lower than X, and supposing the white is finally penetrated, we enter the C zone which I believe has a decent probability for action inside it.
I find the B zone less likely to be relevant as it implies the breaking of the white which should lead to a more bearish or consolidation mood rather that another power bullish move.
I decided to post this snapshot here with these lines because as you can see the price has provided decent relevant lines in the recent past with the greens and blue, while in the current present case, these lines are almost non existent because of the position of the X high relative to the previous highs and lows.
My guess is that a careful analysis of the reaction of the market to these lines could give us clues of what the sentiment in the market is, shifting from the bullish mood to a more cautious neutral or indecision mood with the break of the white and blue.


Gold Trend Analysis on May 30th
The gold daily line ended with a long negative line with a slightly longer lower shadow, which shows that the downward trend of gold is clear. Today is undoubtedly bearish, Therefore, we gave a short strategy of 2337 to our internal members in the morning session and entered the market to short sell in batches. The market is also as expected, rebounding to around 2340 in the short term and then began to fall.
From the daily line, yesterday, gold was under pressure at the 2363 mark during the Asian and European sessions and then fell back, oscillating downward and breaking the bottom, showing a unilateral short-selling decline throughout the day. During the evening US session, the weak rebound continued to weaken after being under pressure at the 2347 mark. In the end, the daily K-line closed with a suppressed and falling middle Yin. The overall price ushered in a short-selling adjustment above the 2360 mark as expected, and the short-term technical indicators still showed a weak short-selling adjustment. From today's point of view, there is still room for further downward decline below gold.
After the current low point of gold, the daily level is adjusted, and the 4-hour, 1-hour and 30-minute levels are all in a downward structure. Only the small levels of 15 minutes and 5 minutes will have a short-term rebound of 8 or 10 US dollars. Gold rebounded after testing the 2322 area in the European session. Pay attention to the short-selling opportunities in the 2337-2338 pressure area, and pay attention to the 2342 area. Continue to look at the 2320-2315 line below. The market fluctuates greatly. The 2300 US dollars and 2280 US dollars can be seen below the midline.
Overall, in terms of short-term operation ideas for gold today, it is recommended to short on rebounds and to buy on pullbacks. The upper short-term focus is on the 2342-2347 resistance range, and the lower short-term focus is on the 2300-2303 support range.

Gold Market Outlook, Golden Bullish Breakout AheadYour analysis of the XAUUSD (Gold) market indicates a current bullish trend with specific targets and support levels. Here's a structured summary of your analysis:
1.Current Trend: Bullish from 2340.
2.First Target: 2425.
3.Secondary Target: If the market moves in the opposite direction and breaks even at 2350, then focus on the next support level.
4.Support Levels:
Primary Support: 2360-2365.
5.If the price falls below these levels, the final support point is 2315.
Trading Strategy Based on Your Analysis:
Bullish Continuation:
Entry Point: Around 2340, if the market continues to show bullish signals.
First Take-Profit (TP1): 2425.
Second Take-Profit (TP2): Depending on market conditions, a secondary TP could be set higher, but specific targets should be reassessed based on market momentum.
Risk Management:
Stop-Loss (SL): Consider setting an SL slightly below the 2340 entry point to minimize losses if the market reverses.
Break-Even Level: 2350. If the price moves to this level, reassess the position and consider adjusting the SL to the entry point to secure a break-even trade.
Bearish Scenario:
Entry Point: If the price breaks 2350 and shows bearish signs, look for potential short opportunities.
First Support Level: 2360-2365. Monitor price action around this zone for potential rebounds or further declines.
Final Support Point: 2315. If the price continues to drop, this could be a critical level for potential reversal or further bearish continuation.
Recommendations:
Continuously monitor market conditions and adjust the strategy as needed.
Use technical indicators like RSI, MACD, and moving averages to confirm signals.
Keep an eye on economic news and events that could impact gold prices, such as changes in interest rates, inflation data, and geopolitical developments.
This structured approach should help in making informed trading decisions based on the outlined analysis.

XAUUSD SHORTThis is just simple trading idea draw into chart using labels and lines. Please use it as educational purpose and you are free to modify any

GOLD - there is single area, hold or not?#GOLD.. so guys market very well hold so far your yesterday resistance area now as supporting area.
keep close it that is 2340 it will be your key level now. if market hold it then further bounce expected above that level. only only short below that otherwise not.
keep in mind guys below 2340 cut n reverse keep in hand.
good luck
trade wisely

Should we wait for lower oil prices?
In the analysis of the oil chart, the main trend line of the upward movement (blue line) has been broken, and the broken candle is marked with an arrow. It seems that we have to wait for lower prices for oil.
Do you agree with my opinion?

SILVER Will Fall! Short!
Please, check our technical outlook for SILVER.
Time Frame: 1D
Current Trend: Bearish
Sentiment: Overbought (based on 7-period RSI)
Forecast: Bearish
The market is trading around a solid horizontal structure 31.601.
The above observations make me that the market will inevitably achieve 27.300 level.
P.S
We determine oversold/overbought condition with RSI indicator.
When it drops below 30 - the market is considered to be oversold.
When it bounces above 70 - the market is considered to be overbought.
Like and subscribe and comment my ideas if you enjoy them!

Closing my Selling order / #45 Profits rowAs discussed throughout my yesterday's session commentary: "I have closed my Selling order (#2,352.80 - #2,340.80) which delivered fine #12-point Profit, and on a pullback to #2,344.80, throughout the same session, I have re-Sold Gold on #2,344.80 and kept the Selling order with #2,300.80 benchmark Target which is currently running in excellent Profit. I am on #44 Profits and #9 Stop hits regarding October - May cycle."
I have closed second Selling order (#2,344.80 - #2,330.80) on a fine #14-point run and coupled with yesterday's #12-point Profit, I have extended my total Profits row on #45 Profits and #9 Stop-loss hits regarding October - May cycle. I will use this chance to congratulate Traders who re-Sold Gold with me, well done!
Technical analysis: Gold continues to Trade within healthy Daily chart’s Descending Channel, holding tightly the #2,327.80 - #2,332.80 pressure point as an Support zone (see how it held throughout today’s session on the exact spot, as well holding and untouched in #1-Month base). Assuming that the Selling pattern continues, then the current market sentiment represent an additional solid Selling opportunity towards the #2,300.80 extension (taken from mid-April Annual High’s), as recession sentiment is slowly fading so safe-haven assets such as Gold (which were in High-demand) should suffer as Investors are slowly losing interest which should add strong Buying pressure on Bond Yields and DX (my strongest correlations at the moment). There is however only one Resistance line left towards #2,372.80, which is currently Trading on #2,356.80 configuration (slim chances). I’ve been highlighting the #2,300.80 potential, and I assume with current market overview, Gold may test it within early next week's phase and sole reason why Gold isn't already Trading below it is mixed numbers on DX. After the Higher High’s Lower extension test it is pure speculation where market will be headed next, however my Technical estimates show (according to Weekly chart’s (#1W) historical resemblance / Bear cycle) that correction process on Gold is over and multi-Month Selling sequence will continue towards #2,200.80 benchmark first and #2,152.80 in extension (more Medium to Long-term).
My position: As it is Friday's session and as I am more than satisfied with my Trading results, I will not assume more orders for the session and take early weekend break.

NATURAL GAS Rejection at the top of the Falling WedgeNatural Gas (NG!) hit last week the top (Lower Highs trend-line) of the long-term Falling Wedge pattern that started on the April 10 2023 Low and was immediately rejected back to the 1W MA50 (blue trend-line).
As long as it holds, this rejection indicates that technically, the new Bearish Leg should start. Our Target is 1.550 (just above Support 1). If however the trend reverses and gives a candle closing above the Lower Highs, we will take the sell's loss and buy instead, targeting 3.300 (projected 1W MA100 extension).
-------------------------------------------------------------------------------
** Please LIKE 👍, FOLLOW ✅, SHARE 🙌 and COMMENT ✍ if you enjoy this idea! Also share your ideas and charts in the comments section below! This is best way to keep it relevant, support us, keep the content here free and allow the idea to reach as many people as possible. **
-------------------------------------------------------------------------------
💸💸💸💸💸💸
👇 👇 👇 👇 👇 👇

GOLD Rebounds as US Growth Slows: Detailed AnalysisGold experienced a notable rebound on Thursday after the second estimate of US first-quarter GDP growth revealed a downward revision to an annualized 1.3% from the initial estimate of 1.6%. This revision reflects weaker consumer spending, which has important implications for inflation and monetary policy.
The slower GDP growth is attributed to a decline in consumer spending, a critical component of economic activity. This deceleration is expected to help contain inflationary pressures, thereby influencing the Federal Reserve's (Fed) policy trajectory. As a result of these developments, market participants now anticipate a more dovish stance from the Fed, potentially leading to lower interest rates in the near future.
The impact of the revised GDP figures was immediately felt in the bond markets. The yield on the US 10-year Treasury note, which had reached a four-week peak of 4.63%, retreated to 4.55%. This decline in yields made the US Dollar less attractive, providing support for gold prices.
From a technical perspective, our analysis aligns with previous forecasts that anticipated a bullish impulse for gold. The price action is currently finding significant liquidity from key demand areas, suggesting that the market is preparing for a further upward movement. Our initial target remains at $2,400, based on the technical signals and market conditions.
The footprint analysis reinforces this outlook. It shows that gold prices are drawing liquidity from the demand zones established in the previous trading sessions. This accumulation of liquidity is a positive sign, indicating that buyers are stepping in at these levels, thus supporting a higher price trajectory.
In summary, the combination of weaker-than-expected US GDP growth, reduced consumer spending, and declining Treasury yields has created a favorable environment for gold. The technical indicators also support a bullish outlook, with the price action confirming our expectations of a continued upward trend. Investors should monitor upcoming economic data and Fed communications for further insights into the potential direction of gold prices.
Gold Futures H4 Footprint
Gold Futures Daily Footprint Chart
