Possible Double Bottom on FET/USD Daily ChartIf you're seeing a double bottom pattern forming on the daily chart of FET/USD, it could be a sign of a potential trend reversal. Here's what a double bottom typically indicates:
Price Decline: The price falls to a support level (bottom 1), then rallies but fails to break significantly above a resi

Fetch.ai (FET) to print 70% correctionSince August of last year price action has risen to provide a 1700% return as forecast (long idea below). A number of reasons now exist to appreciate long risk far outweighs reward.
On the above 8 day chart:
1) Price action has arrived at legacy resistance in the uptrend channel. Look left. This

Long Term Fet prediction! Weekly chart (Hopeum Edition)Please feel free to zoom in and out of the chart for better clarity. For quite some time I was stuck in 4 hourly daily charts. Given the current situation ,I personally avoided checking larger weekly time frames for quite some time until now. I am not saying we are out of the bag yet!!. It still fee

Quickie on FETOpened a long at current prices, expecting a push into 2$ next week, prob. tue/wed.
Stay safe!

Alikze »» FET | Wave 3 or C bullish scenarioIn the daily and weekly time, after an upward cycle in the supply area, a complex mixed correction has been corrected to the 0.38 Fibo range of the previous wave, after which it faced demand.
🔰In the lower time, it went through a full cycle up to the green box area, which again grew up to the curren

Let's try this again - FET ShortFET has hit a 6.85 just as it did in its last market cycle top. I think that from here there is a chance that it dumps down to the 2.618 area as an initial dump. This is approximately around $1.22.
Once this initial dump takes place, it will likely do a nice bounce back upwards, which typically set

FETUSDT IDEAHello Traders Hope You Are Enjoying Our Analysis. Today We Will Discuss About FET
(Update)
The Descending Channel Formation On 12H Timeframe☑️
Now Its Ready To Breakout⏳
In Case Of Successful Breakout Expecting Massive Bullish Wave✍️

FET ANALYSIS (1D)According to the FET, it is inside the large C wave and this wave is a large diametric. It seems that we are at the end of the e wave of C.
From the red range it can drop in the medium term to complete the big F wave to the green range.
Closing a daily candle above the invalidation level will viol

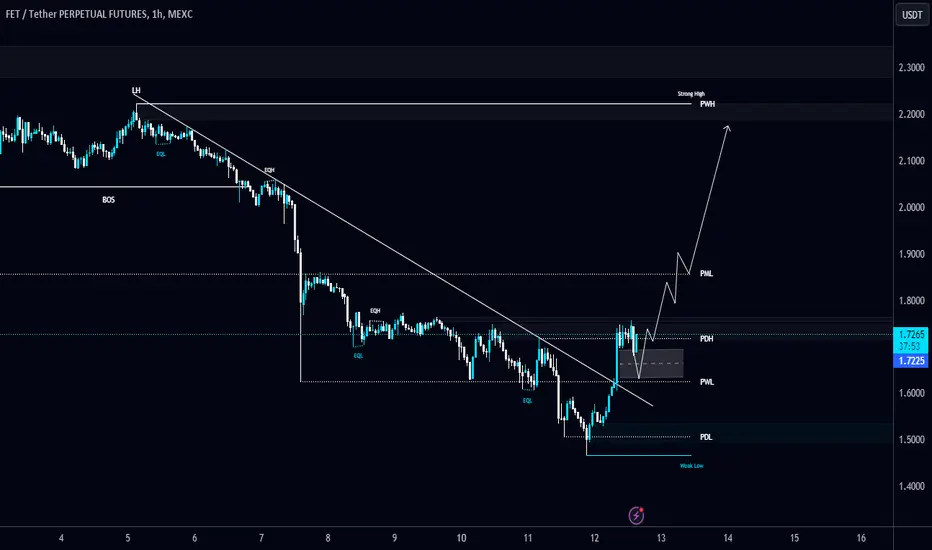
#FET/USDT breaks the Diagonal Trendlien in 1-Hour TF!#FET/USDT breaks the Diagonal Trendlien in 1-Hour TF!
Keeping an eye on mid-level of the FVG, I will wait for confirmation to open the Long position. The local resistance level is PML $1.8585.
FETUSDT still on the bearish trend. FETUSDT is still on the bearish, but retracement is incoming soon. Before the bearish trend continue

See all ideas