Metainfo
Overview
metainfo is a required field in the CustomIndicator object that you should specify to create a custom indicator.
custom_indicators_getter: function(PineJS) {
    return Promise.resolve([
        {
            // Indicator object
            metainfo: {
                // ...
            },
            // ...
        }
    ]);
},
This field defines plot types that represent the indicator and contains the indicator's metadata, such as a name, description, style defaults, colors, plot types, inputs, and more.
The information should be arranged in a specific format and supplied as a StudyMetaInfo object. The indicator's Settings dialog is generated based on this object.
StudyMetaInfo is initialized once and cannot be changed after the chart is created.
This article describes the most important StudyMetaInfo properties. You can find the complete list of properties in the API section.
Consider the how-to guide that demonstrates an example of the metainfo implementation.
Service information
You should specify the properties below to provide service information on the indicator.
_metainfoVersion
The _metainfoVersion property represents a version number of metadata. The current version is 53, and the default one is 0. Even though this property is optional, we recommend that you always specify it and use the latest version. Therefore, your indicator is more compatible with newer versions of the library.
metainfo: {
    // ...
    _metainfoVersion: 53,
}
id
The id property is a string that has the <study name>@tv-basicstudies-1 format. The id value should be unique.
metainfo: {
    // ...
    id: 'Custom indicator@tv-basicstudies-1',
}
Indicator name
You should use the properties below to specify the indicator's name in the UI.
description
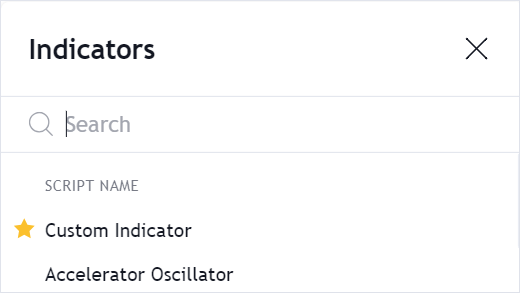
The description property contains the indicator's name that is displayed in the Indicators dialog and the Object Tree. You should use the description value as a name argument if you create an indicator using the createStudy method.
metainfo: {
    // ...
    description: 'Custom Indicator',
}
shortDescription
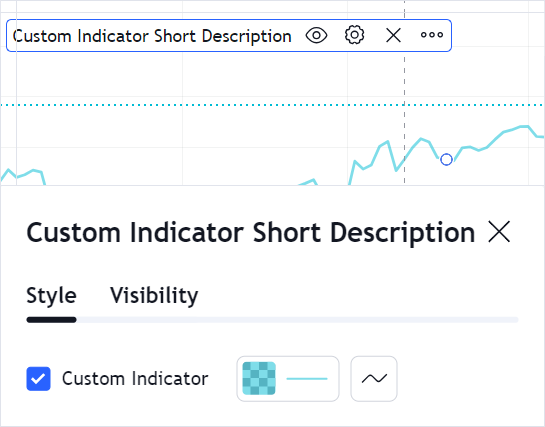
The shortDescription property contains the indicator's name that is displayed in the Legend, the Settings dialog, and the corresponding label on the Price Scale.
metainfo: {
    // ...
    shortDescription: 'Custom Indicator Short Description',
}
Data
You should use the properties below to specify data that the indicator uses.
format
Depending on the indicator data, the Price Scale displays price, volume, or percent values. To specify the indicator's data type, assign either a StudyPlotValueInheritFormat or StudyPlotValuePrecisionFormat object to the format property.
If the data has the same type and precision as the source symbol, create a StudyPlotValueInheritFormat object with the type property set to inherit.
Otherwise, create a StudyPlotValuePrecisionFormat object with the desired type and precision. For example, the code sample below specifies price values with two decimal places.
metainfo: {
    // ...
    format: {precision: 2, type: 'price'},
}
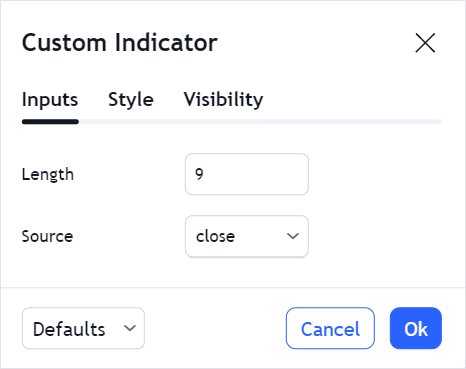
inputs
The inputs property defines input parameters that the indicator has. Input properties depend on the input type.
metainfo: {
    // ...
    inputs: [
        {
            id: "length",
            name: "Length",
            defval: 9,
            type: "integer",
            min: 1,
            max: 10000,
        },
        {
            id: "source",
            name: "Source",
            defval: "close",
            type: "source",
            options: [
                "open",
                "high",
                "low",
                "close",
                "hl2",
                "hlc3",
                "ohlc4",
            ],
        },
    ]
}
Options on the Inputs tab of the Settings dialog are generated based on inputs. Additionally, you should specify default values for input parameters in defaults.
metainfo: {
    // ...
    defaults: {
        // ...
        inputs: {
            length: 9,
            source: "close",
        },
    }
}
Refer to the Custom Studies Inputs article for more information.
symbolSource
The symbolSource property allows you to specify a symbol that will be used as a data source for the indicator. The default source is the main series that represents the main symbol on the chart.
Visual representation
You should use the properties below to specify visual elements that the indicator consists of.
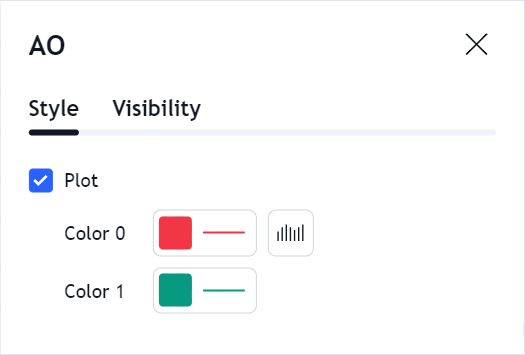
plots
The plots property defines simple elements, for example, lines and drawings, that the indicator consists of. Refer to the StudyPlotType page to see the list of all plot types.
metainfo: {
    // ...
    plots: [
        {
            id: 'plot_0',
            type: 'line',
        },
    ],
}
Each plot requires additional information that should be specified in styles and defaults.
metainfo: {
    // ...
    defaults: {
        // ...
        styles: {
            plot_0: {
                linestyle: 0,
                linewidth: 1,
                plottype: 1,
                trackPrice: false,
                transparency: 0,
                visible: true,
                color: '#000080',
            }
        },
    },
    styles: {
        plot_0: {
            title: "Plot",
            histogramBase: 0,
            joinPoints: false,
        },
    },
}
For more information about plots, refer to the Custom Studies Plots article.
ohlcPlots
The ohlcPlots property defines open-high-low-close (OHLC) plots that are used to display OHLC indicators.
Refer to the Custom Studies OHLC article for more information.
bands
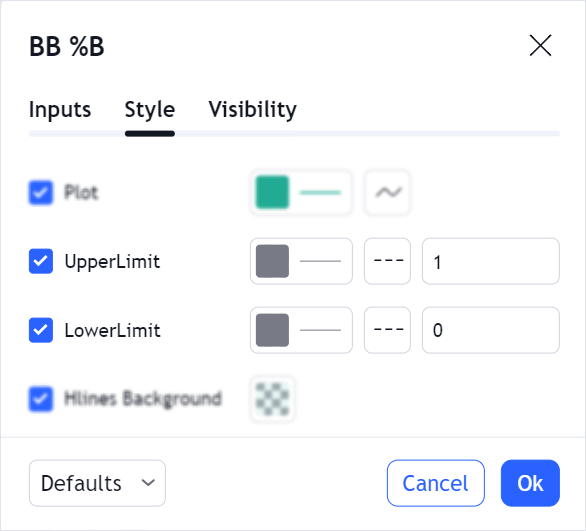
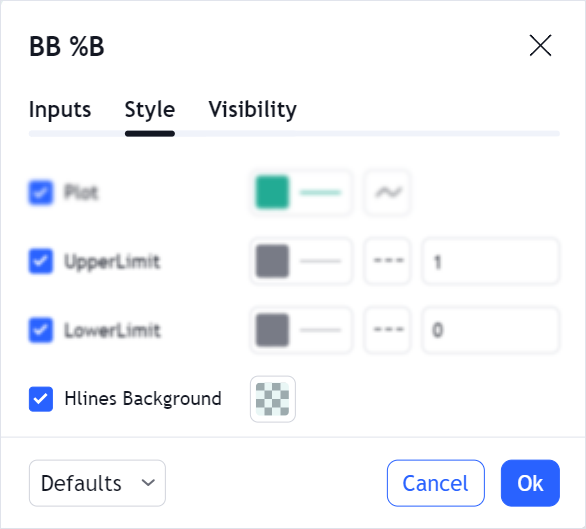
The bands property defines bands (horizontal lines) and their settings that users cannot change.
metainfo: {
    // ...
    bands: [
        {
            id: 'hline_0',
            name: 'UpperLimit',
            zorder: -1.1,
        },
        {
            id: 'hline_1',
            name: 'LowerLimit',
            zorder: -1.11,
        },
    ]
}
Additionally, you should specify default values for settings that the user can change on the Styles tab, for example, colors and styles, in the defaults properties.
metainfo: {
    // ...
    // ...
    defaults: {
        bands: [
            {
                color: '#787B86',
                linestyle: 2,
                linewidth: 1,
                visible: true,
                value: 1,
            },
            {
                color: '#787B86',
                linestyle: 2,
                linewidth: 1,
                visible: true,
                value: 0,
            }
        ]
    }
}
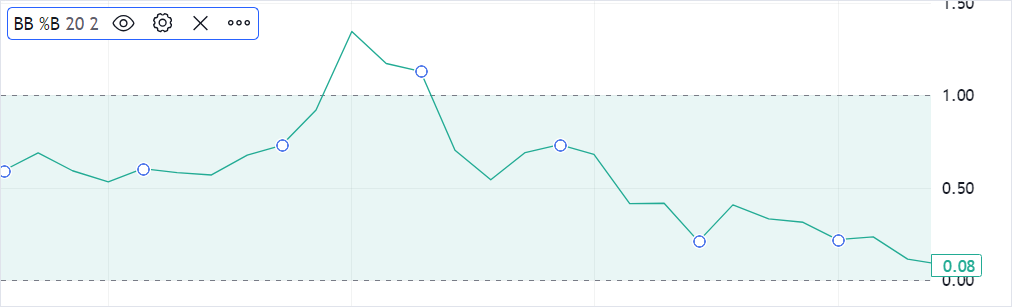
filledAreas
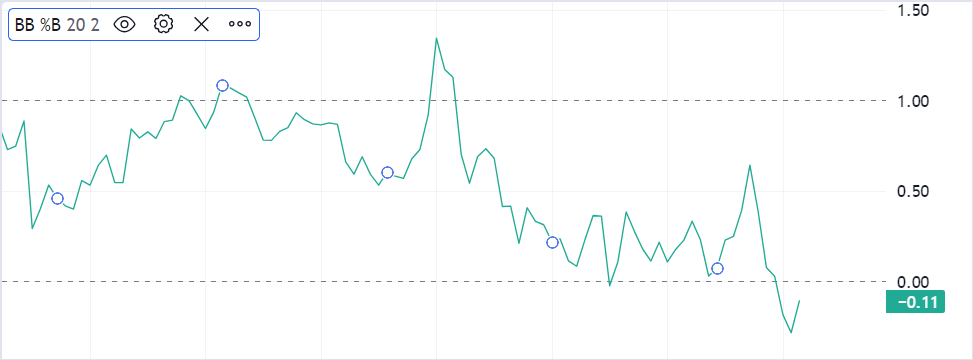
The filledAreas property defines color areas. These areas can be drawn between two plot lines or two bands, but not between a band and a plot line.
Consider the Complex Filled Areas example that shows how to use filledAreas.
Appearance and visibility
You should use the properties below to specify the indicator's appearance.
defaults
The defaults property contains default values for other properties in StudyMetaInfo like plots, inputs, styles, and others. In the Settings dialog, users can reset all settings or override default values using the Defaults dropdown list.
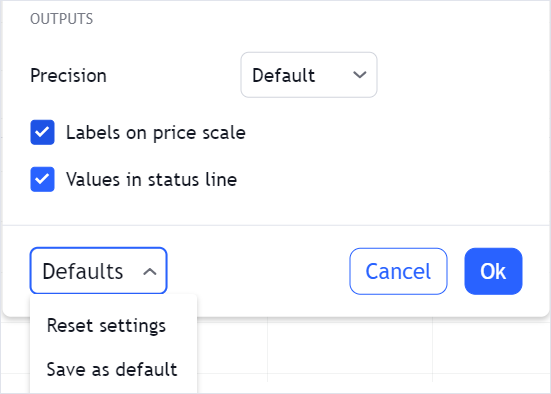
All properties that you can specify in defaults are listed in StudyDefaults. Refer to the Custom Studies Defaults for more information.
styles
The styles property contains style settings for each plot defined in plots. Users cannot change these settings in the UI.
metainfo: {
    // ...
    styles: {
        plot_0: {
            title: 'Plot',
            histogramBase: 0,
            joinPoints: false,
        }
    }
}
Additionally, you should specify default values for plot settings that the user can change in the Styles tab, for example, colors and styles, in the defaults properties.
metainfo: {
    // ...
    defaults: {
        styles: {
            plot_0: {
                linestyle: 0,
                linewidth: 1,
                plottype: 1,
                trackPrice: false,
                transparency: 0,
                visible: true,
                color: '#000080',
            }
        }
    }
}
palettes
The palettes property defines color palettes that are required if you use plot types such as Colorer, BarColorer, OhlcColorer, and others. These plot types allow you to draw an indicator that consists of lines, bars, or other elements of different colors. Consider the Coloring Bars example that shows how to use palettes.
is_hidden_study
The is_hidden_study property allows you to hide a custom indicator in the Indicators dialog. To do this, set this property to true. The default value is false.
metainfo: {
    // ...
    is_hidden_study: true,
}
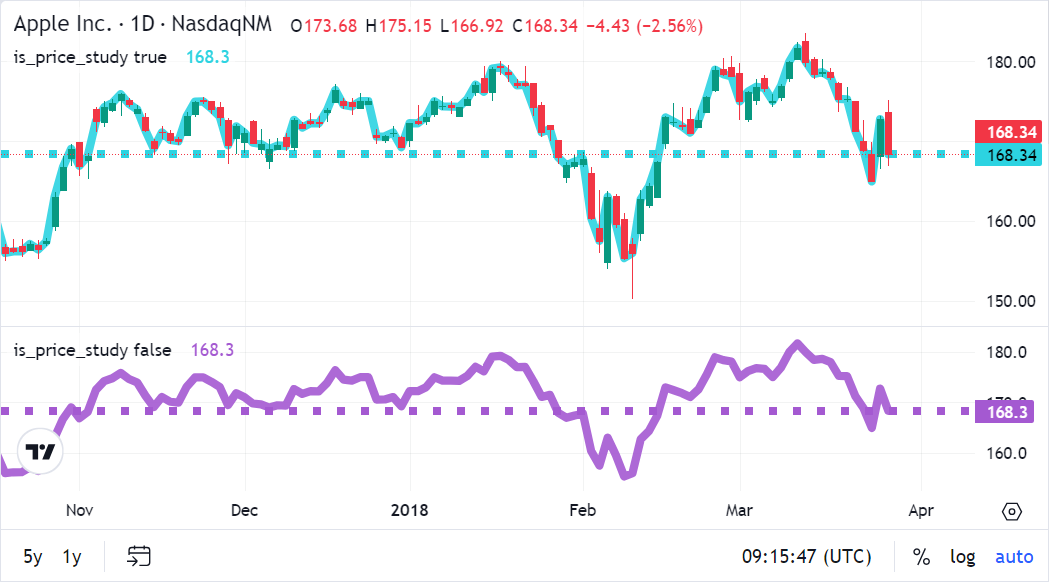
is_price_study
The is_price_study property specifies whether the indicator should be displayed on the same pane with the main series.
linkedToSeries
The linkedToSeries property specifies whether the indicator should use the same price scale as the main series. If the property is false, you can move the series to another pane without the indicator.
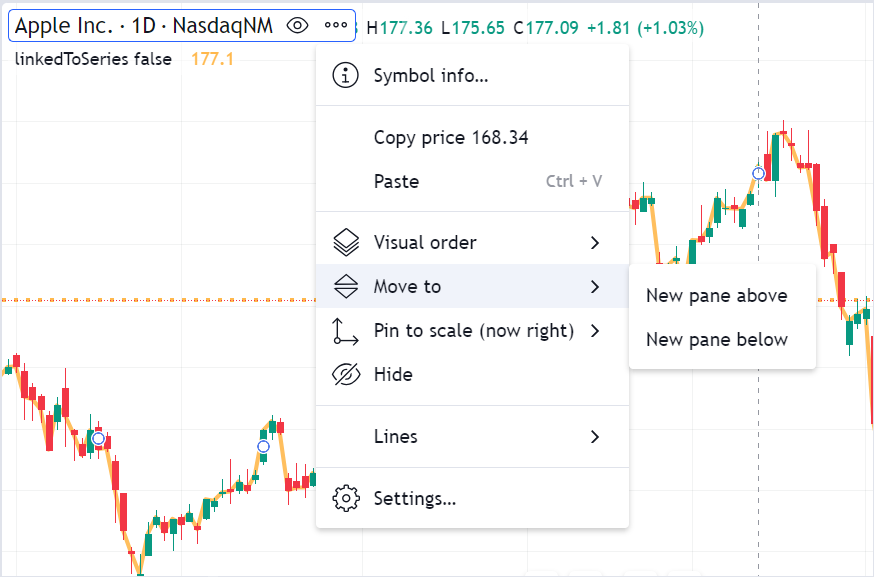
You should set linkedToSeries to true if you create an indicator that does not make sense without the series. In this case, the Move to option is hidden in the UI.