Price scale
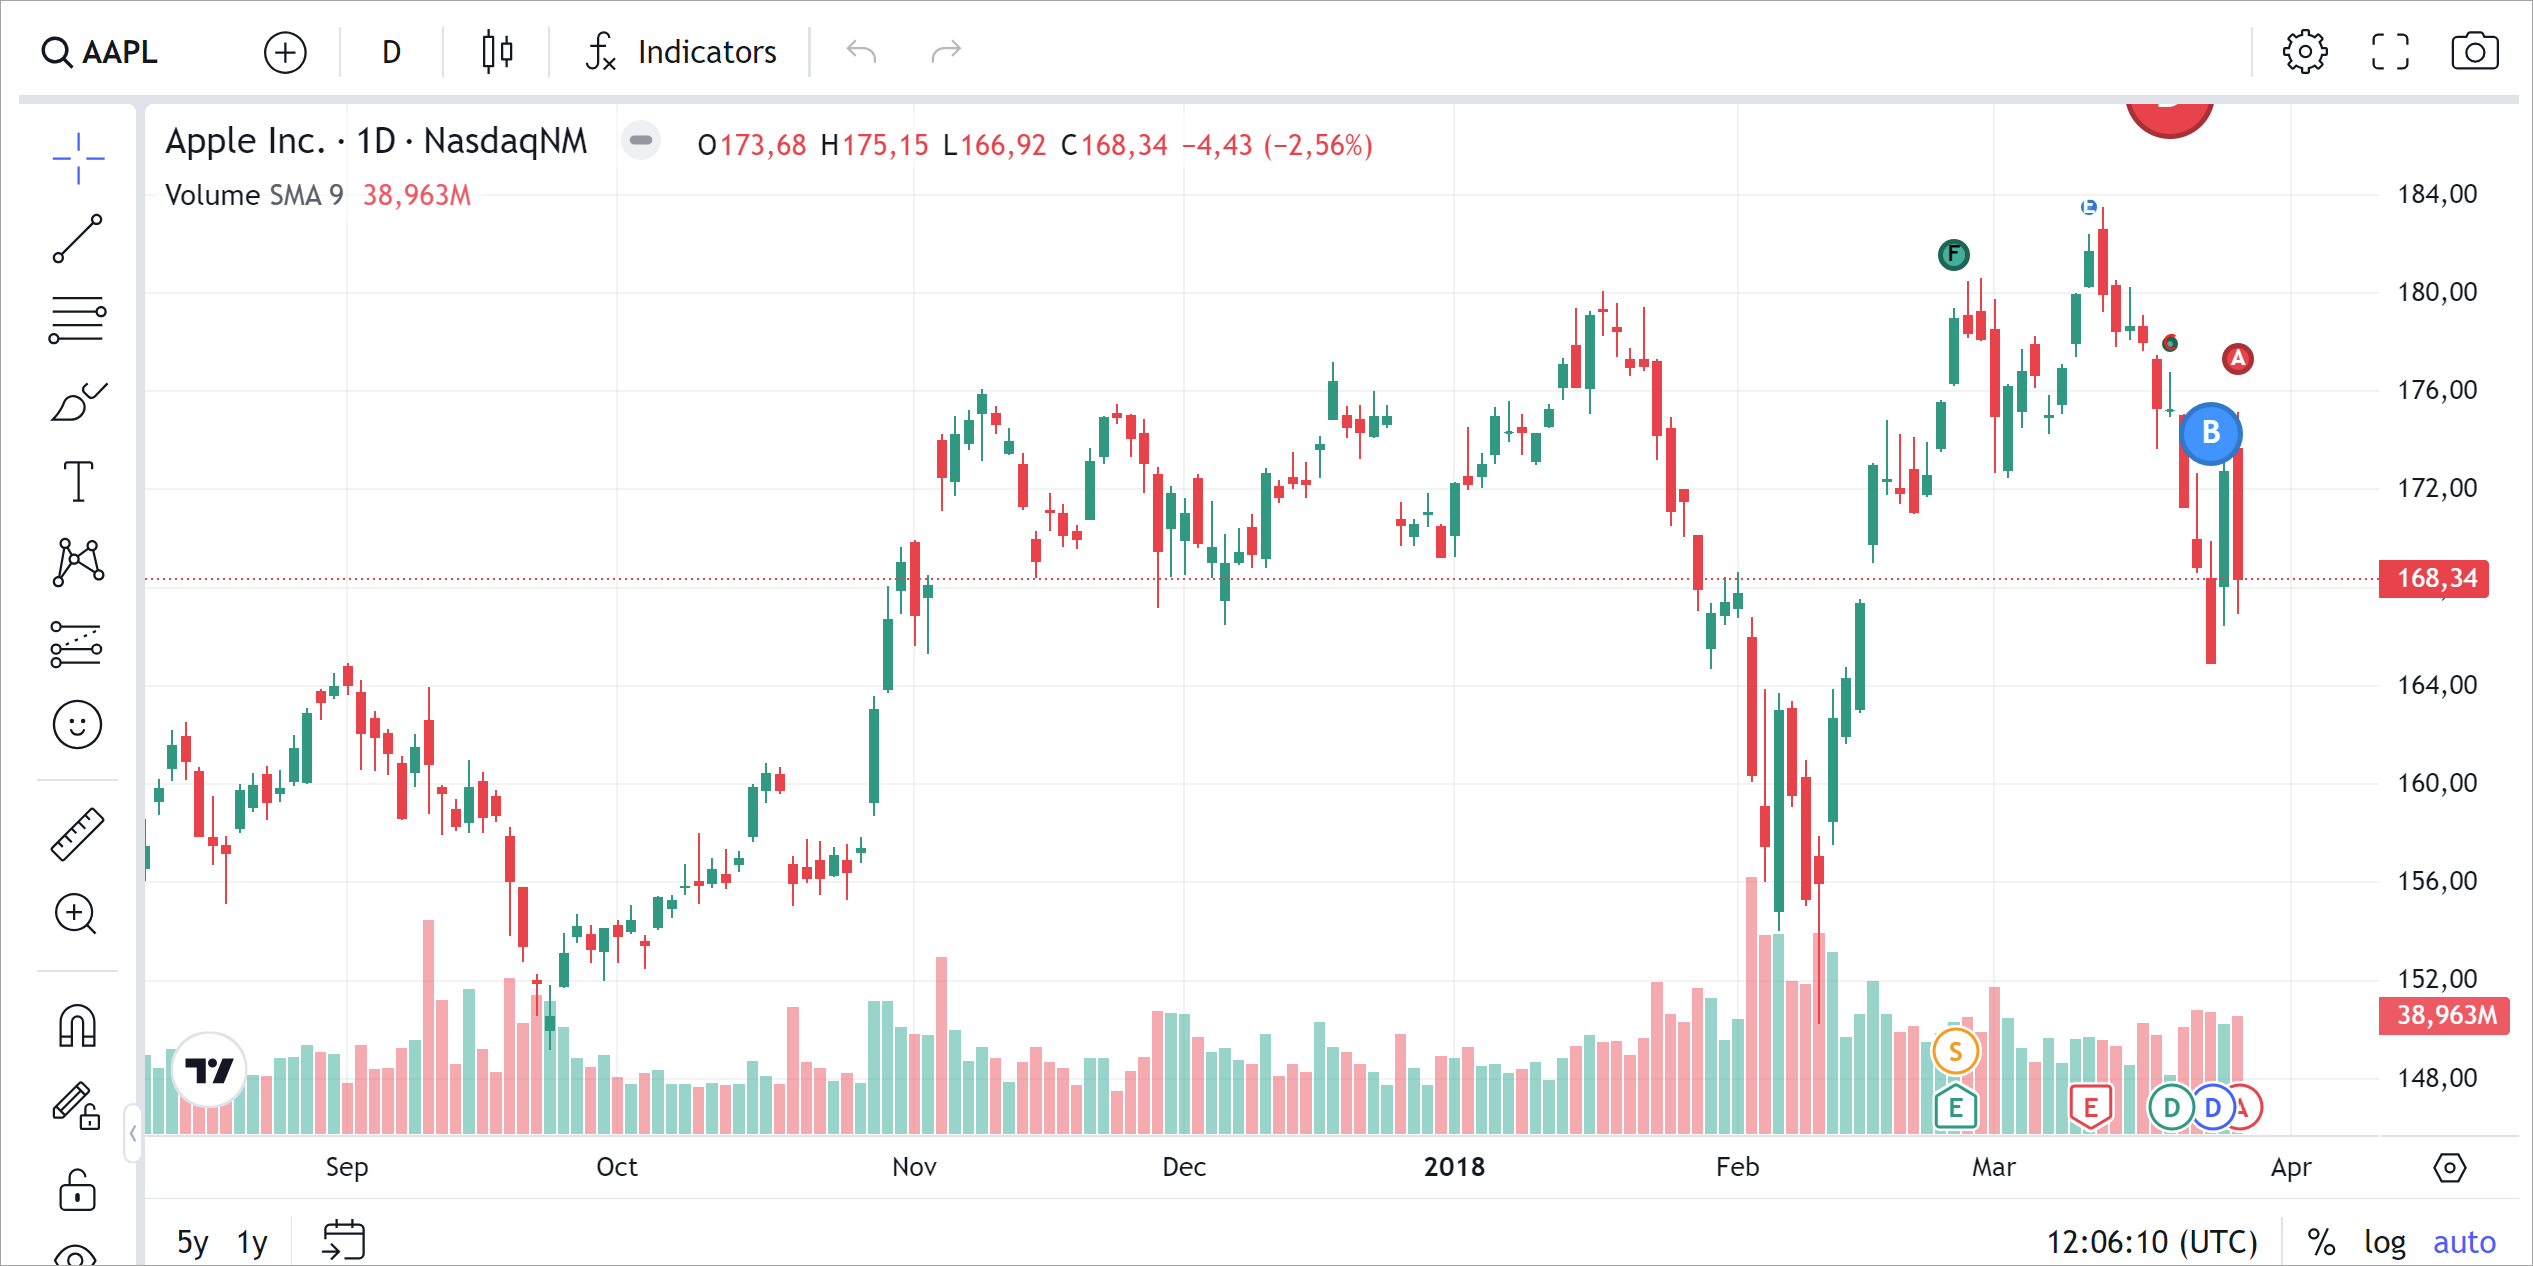
Price scale (or price axis) is a vertical scale on the right or left side of the chart that maps prices to coordinates and vice versa.
UI interactions
This section describes how users can interact with the price scale.
Adding price scale
Users can add new price scales via the Compare symbol dialog by selecting New price scale.
The library allows users to have up to eight price scales on the chart. However, only one price scale can be displayed on mobile applications.
Changing position
Users can place the price scale on the left or right side of the chart. To do this, they should select the Move scale to left/right button in the context menu of the price scale.
You can also programmatically change a price scale position.
Pinning to scale
Users can select Pin to scale in the symbol/indicator settings to attach symbols/indicators to the price scale.
You can also programmatically add a new indicator and attach it to a new price scale.
Inverting price scale
Users can invert the scale via Invert scale in the context menu of the price scale. When the option is enabled, the price increase is shown from top to bottom.
Resetting price scale
Users can reset the price scale when it is in a non-default state. Note that the Reset price scale option will not appear in the context menu with adjustments such as moving the scale to the left or switching to logarithmic mode.
Quick trading
This feature is only available in Trading Platform.
By default, the price scale includes a Plus button. When users click this button, a context menu opens, allowing them to quickly access trading options. Note that this menu will be empty unless you implement the Broker API.

To detect when the user clicks the Plus button, you can listen for the onPlusClick event.
You can disable this button by adding the chart_crosshair_menu featureset to the disabled_features array.
Style and default settings
Customize price scale appearance
You can customize the appearance of the price scale using the Overrides API. For example, the code sample below changes the text color and font size of the price and time scales.
const datafeed = new Datafeeds.UDFCompatibleDatafeed("https://demo-feed-data.tradingview.com");
new TradingView.widget({
    container: "chartContainer",
    locale: "en",
    library_path: "charting_library/",
    datafeed: datafeed,
    symbol: "AAPL",
    interval: "1D",
    overrides: {
        "scalesProperties.textColor": "#FF0000",
        "scalesProperties.fontSize": 14,
    }
})
Refer to the Scale colors and fonts section to see the full list of the overrides properties.
Change price scale position
You can change the position of the price scale attached to the main series.
When creating a chart, use the priceScaleSelectionStrategyName property of the Overrides API.
For example, the code sample below changes the price scale position to the left.
const datafeed = new Datafeeds.UDFCompatibleDatafeed("https://demo-feed-data.tradingview.com");
new TradingView.widget({
    container: "chartContainer",
    locale: "en",
    library_path: "charting_library/",
    datafeed: datafeed,
    symbol: "AAPL",
    interval: "1D",
    overrides: {
        "priceScaleSelectionStrategyName": "left",
    }
})
If the chart is already created, use the changePriceScale method of the ISeriesApi interface.
For example, the code sample below also changes the price scale position of the main series to the left.
widget.onChartReady(() => {
    widget.activeChart().getSeries().changePriceScale("new-left");
});
Attach indicators to price scale
You can attach indicators to the price scale.
To do this, specify the priceScale property in the options parameter of the createStudy method.
For example, the code sample below creates a Volume indicator and attaches it to a new price scale on the left.
widget.onChartReady(() => {
    widget.activeChart().createStudy('Volume', false, false, undefined, undefined, { "priceScale": "new-left" });
});
Hide price scale
If you want to hide the price scale when all series or indicators attached to it are hidden,
enable the hide_price_scale_if_all_sources_hidden featureset.
Hide settings button
The scale settings button is available directly below the price scale.
If users have more than one price scale on the chart, a letter will be displayed in place of the settings button.
Users should click the letter that indicates the scale to open the corresponding scale settings.
If you want to hide the settings button, disable the main_series_scale_menu featureset.
Add labels
You can add labels to the price scale to display additional information like a symbol name, bid/ask prices, indicators, and more. For example, the code sample below adds a symbol name label on the price scale.
const datafeed = new Datafeeds.UDFCompatibleDatafeed("https://demo-feed-data.tradingview.com");
new TradingView.widget({
    container: "chartContainer",
    locale: "en",
    library_path: "charting_library/",
    datafeed: datafeed,
    symbol: "AAPL",
    interval: "1D",
    overrides: {
        "scalesProperties.showSymbolLabels": true,
    }
})
Refer to the Labels on the scale section to see the full list of the overrides properties.
Enable auto scaling
You can enable auto scaling using the setAutoScale method of the Price Scale API.
widget.onChartReady(() => {
    const priceScale = widget.activeChart().getPanes()[0].getMainSourcePriceScale();
    priceScale.setAutoScale(true)
});
Set mode
You can set the price scale mode using the Overrides API or Price Scale API.
However, you cannot change the price scale mode using the applyOverrides method.
When creating a chart, use overrides to change the price scale mode.
For example, the code sample below enables the percentage mode.
const datafeed = new Datafeeds.UDFCompatibleDatafeed("https://demo-feed-data.tradingview.com");
new TradingView.widget({
    container: "chartContainer",
    locale: "en",
    library_path: "charting_library/",
    datafeed: datafeed,
    symbol: "AAPL",
    interval: "1D",
    overrides: {
        "mainSeriesProperties.priceAxisProperties.percentage": true,
    }
})
Refer to the Price scale mode section to see the full list of the overrides properties.
If the chart is already created, you can change the price scale mode only using the setMode method of the Price Scale API.
For example, the code sample below also enables the percentage mode.
widget.onChartReady(() => {
    const priceScale = widget.activeChart().getPanes()[0].getRightPriceScales()[0];
    priceScale.setMode(2);
});
Set visible price range
If you want to set a visible price range of the price scale,
you can use the setVisiblePriceRange method of the Price Scale API.
For example, the code sample below sets the visible price range between 140 and 170.
widget.onChartReady(() => {
    const priceScale = widget.activeChart().getPanes()[0].getRightPriceScales()[0];
    priceScale.setVisiblePriceRange({ "from": 140, "to": 170 });
});
Price formatting
The format property in the LibrarySymbolInfo object determines how prices appear on the scale.
Specifying the volume format displays prices as decimals in thousands, millions, billions, or trillions.
If you specify the price format, the prices will be formatted in decimal or fractional format
according to the minmov, pricescale, minmove2, fractional, variablemintick properties.
Refer to the Price Format section for more information.
You can also change the decimal sign for the prices or implement your custom logic of the price formatting.
Change decimal sign
You can apply custom formatting using the numeric_formatting property of the Widget Constructor.
For example, the code sample below sets a comma to separate the decimal/fractional part of the prices.
const datafeed = new Datafeeds.UDFCompatibleDatafeed("https://demo-feed-data.tradingview.com");
new TradingView.widget({
    container: "chartContainer",
    locale: "en",
    library_path: "charting_library/",
    datafeed: datafeed,
    symbol: "AAPL",
    interval: "1D",
    numeric_formatting: { decimal_sign: "," },
})
The image below shows that the decimal parts of the prices on the price scale and the legend are separated with a comma.
Use custom formatting
You can adjust the display format of price values using the custom_formatters property of the Widget Constructor.
For example, the code sample below defines a custom price formatting function for the volume format type.
This function replaces numerical zeros with letter representations like billions (B), millions (M), and thousands (K).
const datafeed = new Datafeeds.UDFCompatibleDatafeed("https://demo-feed-data.tradingview.com");
new TradingView.widget({
    container: "chartContainer",
    locale: "en",
    library_path: "charting_library/",
    datafeed: datafeed,
    symbol: "AAPL",
    interval: "1D",
    custom_formatters: {
        priceFormatterFactory: (symbolInfo, minTick) => {
            if (symbolInfo === null) {
                return null;
            }

            if (symbolInfo.format === 'volume') {
                return {
                    format: (price, signPositive) => {
                        if (price >= 1000000000) {
                            return `${(price / 1000000000).toFixed(3)}B`;
                        }

                        if (price >= 1000000) {
                            return `${(price / 1000000).toFixed(3)}M`;
                        }

                        if (price >= 1000) {
                            return `${(price / 1000).toFixed(3)}K`;
                        }

                        return price.toFixed(2);
                    },
                };
            }
            return null; // The default formatter will be used.
        },
    }
})
Symbol currency
Display symbol currency
To display symbol currency on the price scale, follow the steps below.
- Enable the
pricescale_currencyfeatureset to show the Currency menu in Chart Settings → Scales. - Assign a currency code to the
currency_codeproperty of theLibrarySymbolInfoobject. Note that the currency code must be a three-letter string in the ISO 4217 format.
Enable currency conversion
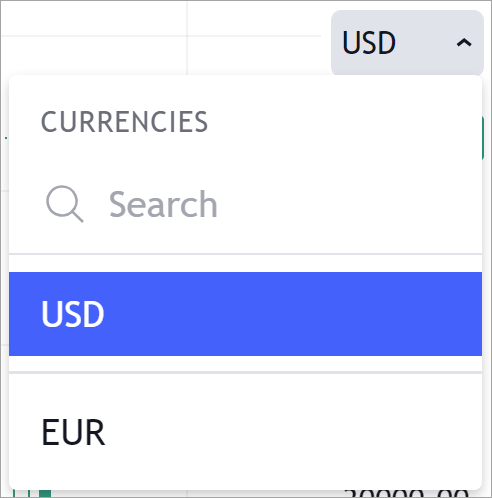
The library provides a drop-down menu for selecting the currency in which the symbol is displayed. To switch between currencies, you should implement the currency conversion. Follow the steps below to enable the currency conversion.
- Enable the
pricescale_currencyfeatureset to show the Currency menu in Chart Settings → Scales. - Add the
currency_codeandoriginal_currency_codeproperties to theLibrarySymbolInfoobject. Note that the currency code must be a three-letter string in the ISO 4217 format. - Provide a list of available currencies in the
currency_codesproperty of theDatafeedConfigurationobject. - Pass
currencyCodeto theresolveSymbolmethod. - Implement the conversion algorithm. The conversion algorithms can vary, but you can choose one from the following two:
- Constant currency rate algorithm. With this approach, you retrieve the current currency exchange rate and multiply each bar by this value. However, this approach may yield inaccurate results for historical bars if the exchange rate has fluctuated significantly over time.
- Corresponding currency rate algorithm. With this approach, you request historical currency exchange rates from the server and then multiply each bar by its corresponding currency rate.
Implementing either of these algorithms is straightforward when all symbols and Forex rates share the same time zone. However, if time zones differ, you need to find an appropriate way to accurately match the corresponding rate to each bar.
After this, users can view symbol prices in their preferred currency.
To switch to a different currency, users can click the currency drop‑down menu and choose another option.
When a new currency is selected, the resolveSymbol method is called with the same symbolInfo
but with an added currency_code property indicating the chosen currency.