Marks
Marks allow you to display some extra information like news, bar patterns, splits/dividends, and more on the chart or time scale.
Use the subscribe method to handle events raised when users interact with marks. You can also refresh and clear marks using the chart methods.
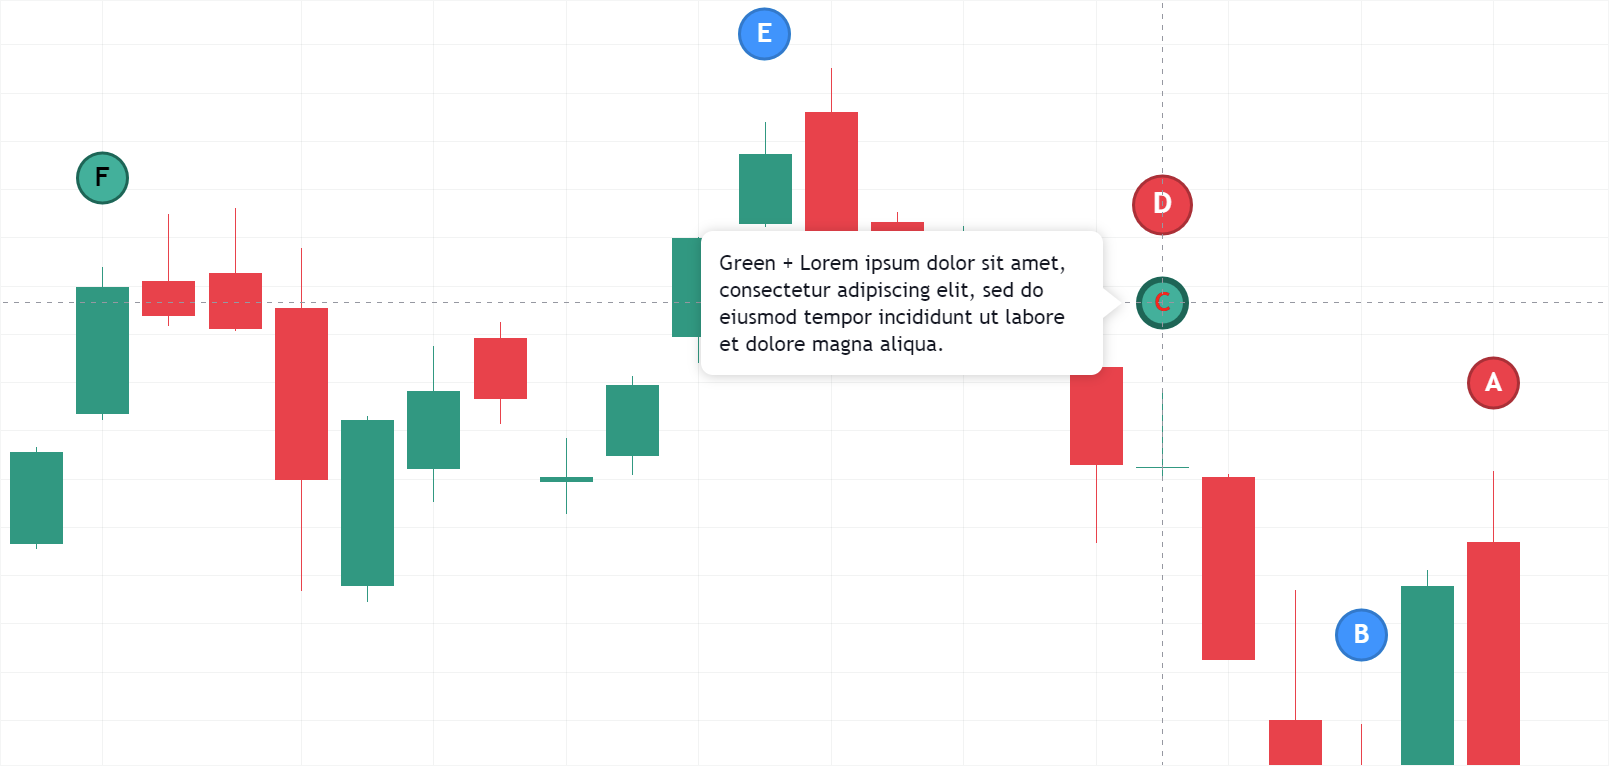
Marks on the chart
Marks on the chart are circles that are attached to bars and contain a character inside. You can customize the circle size and color. If you want to display two characters (like 'ED', 'AB', 'CD', etc.), you should enable the two_character_bar_marks_labels featureset.
One bar can have several marks. When a user clicks on the mark, the tooltip appears. The tooltip can only contain plain text. HTML code is not supported.
Marks are requested from your datafeed if you set supports_marks to true. The library calls getMarks or requests /marks to get mark data for the visible data range.
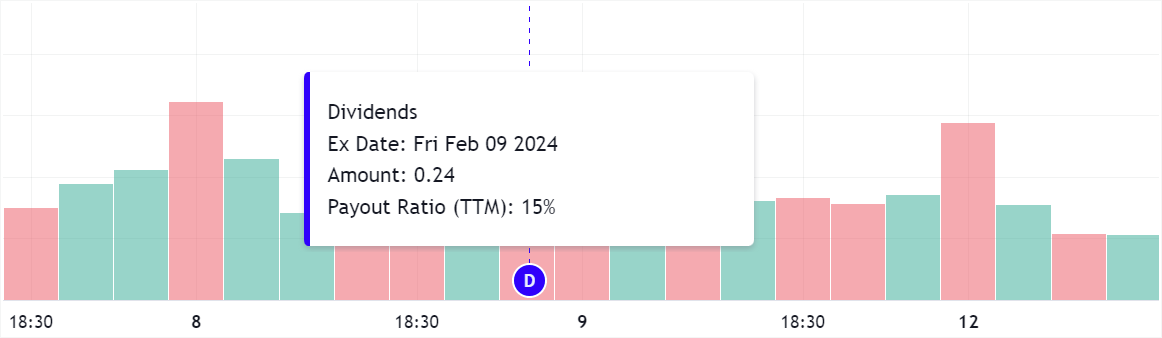
Marks on the time scale
Marks on the time scale are figures above the time scale. Each mark has a character inside and a pop-up tooltip with information strings. The tooltip does not support HTML code. You can specify a time scale mark shape using the shape property. Images can be displayed within time scale marks by providing an image URL in the imageUrl property.
Time scale marks are requested from your datafeed if you set supports_timescale_marks to true. The library calls getTimescaleMarks or requests /timescale_marks to get mark data for the visible data range.