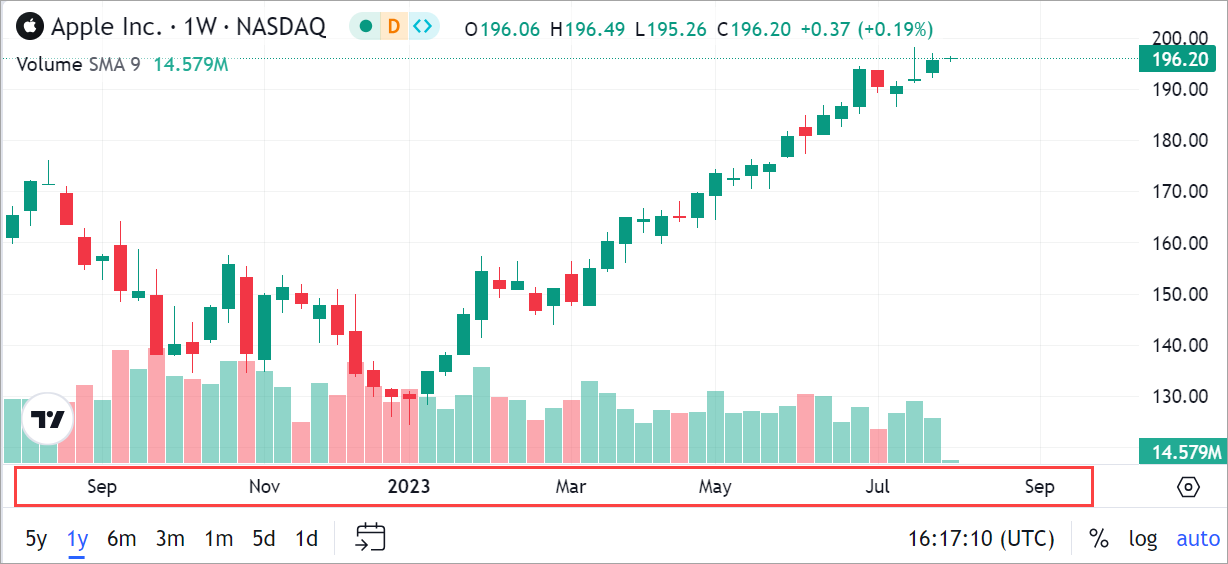
Time scale
Time scale (or time axis) is a horizontal scale at the bottom of the chart that displays the time of bars.
Time range
Time (date) range is a period of time that is currently visible on the chart canvas. This range changes when users scale or scroll the chart.
You can specify a certain range using the setVisibleRange method.
widget.activeChart().setVisibleRange(
    { from: 1420156800, to: 1451433600 }
)
If the library cannot fit the specified range within the canvas, which may happen on small screens, it will render as much data as possible.
In this case, the to parameter is considered more prior than from.
To ensure the full range is displayed, consider decreasing the bar spacing to a smaller number, which allows more data to fit within the available space.
You can adjust bar spacing using the min_bar_spacing option or the setBarSpacing method.
time_scale: {
    min_bar_spacing: 0.01
},
Using min_bar_spacing forces the library to perform more calculations. This may lead to the following issues:
- The chart UI may update slowly because the browser thread is blocked.
- The browser may use excessive memory or even run out of memory due to the large number of bars on the screen.
Use this option carefully and only when necessary.
Time scale API
You can manage the time scale using the Time scale API.
For example, you can set a specific right margin or detect when the chart has been zoomed in/out.
Refer to ITimeScaleApi for more information.
Customize scale appearance
You can customize the appearance of the time scale using the Overrides API. For example, the code sample below changes the text color and font size of the time and price scales.
const datafeed = new Datafeeds.UDFCompatibleDatafeed("https://demo-feed-data.tradingview.com");
new TradingView.widget({
    container: "chartContainer",
    locale: "en",
    library_path: "charting_library/",
    datafeed: datafeed,
    symbol: "AAPL",
    interval: "1D",
    overrides: {
        "scalesProperties.textColor": "#FF0000",
        "scalesProperties.fontSize": 14,
    }
})
Refer to the Scale colors and fonts section to see the full list of the overrides properties.
Date and time formatting
You can adjust the display format of date and time values using the custom_formatters property of the Widget Constructor.
Check out the Widget Constructor tutorial on YouTube for an implementation example.
Time frame toolbar
Time frames are time period buttons displayed at the bottom-left corner of the chart. When users switch a time frame, it causes the following changes to satisfy the selected time frame:
- The chart resolution changes.
- The bars scale horizontally to cover the entire requested date/time range.
For example, clicking 1Y makes the chart switch the resolution to 1W and
scale it accordingly to display weekly bars for the entire year.
Each time frame has its default chart resolution:
| Time frame | Chart resolution |
|---|---|
| 5Y | W |
| 1Y | W |
| 6M | 120 |
| 3M | 60 |
| 1M | 30 |
| 5D | 5 |
| 1D | 1 |
Time frame customization
You can customize displayed time frames using the time_frames property of the Widget Constructor.
Note that time frames that require resolutions that are unavailable for a particular symbol will be hidden.
You can also check out the Widget Constructor tutorial on YouTube for an implementation example.
Programmatic time frame setting
If you want to programmatically set the time frame for the active chart, use the setTimeFrame method of the IChartWidgetApi.
For example, the following code snippet applies the 1Y time frame, which is the same as when users click 1Y at the bottom of the chart:
const widget = new TradingView.widget(/* Widget properties */);

widget.onChartReady(() => {
    const chart = widget.chart();
    chart.setTimeFrame({val: {type: 'period-back', value: '12M'}, res: '1W'});
});
Extended time scale
You can enable indicators to extend the time scale. This allows you to create custom indicators that show bars at a higher resolution than the main series. Refer to Extending the time scale for more information.
Extended sessions
If you want to display extended sessions for some symbols, refer to the Extended sessions article for more information.